
Hyperthyroidism management
"hyperthyroidism"[MeSH Terms] AND "management"[MeSH Terms]
hyperthyroidism thyroid management treatment algorithm
![Summary : This flowchart presents the management algorithm for intrathyroid thymic carcinoma (ITC), detailing treatment pathways for resectable, locally advanced, and recurrent/metastatic disease, with node colours indicating treatment modalities and recommendations.
flowchart:
# Nodes :
• ITC (purple rectangle, algorithm title)
• Resectable (white rectangle)
• Resect according to ESMO CPG on thyroid cancer [IV, A] (orange rectangle, surgery)
• Adjuvant RTb [IV, B] (dark green rectangle, radiotherapy)
• Observation [V, C] (white rectangle, non-treatment aspect)
• Locally advanced (white rectangle)
• RT or CRT [V, B] (dark green rectangle, radiotherapy/chemoradiotherapy)
• Recurrent or metastatic (white rectangle)
• Salvage surgerya [IV, A] (orange rectangle, surgery)
• Platinum-based ChTc [V, B] (blue rectangle, systemic anticancer therapy)
# Connectors :
• ITC splits into three branches: Resectable, Locally advanced, Recurrent or metastatic.
• Resectable → Resect according to ESMO CPG on thyroid cancer [IV, A]
– Resect according to ESMO CPG → Adjuvant RTb [IV, B] and Observation [V, C]
– Adjuvant RTb [IV, B] → Observation [V, C]
• Locally advanced → RT or CRT [V, B]
• Recurrent or metastatic → Salvage surgerya [IV, A] → Platinum-based ChTc [V, B]
# Layout :
• Three main vertical branches from the central ITC node.
• Each branch represents a disease stage: resectable (left), locally advanced (middle), recurrent/metastatic (right).
• Nodes are colour-coded: purple (title), orange (surgery), dark green (RT), blue (systemic therapy), white (other management/non-treatment).
# Analysis :
• The flowchart visually separates management strategies by disease stage, with clear progression from initial assessment to specific treatments.
• Surgery is recommended for resectable and salvageable cases, followed by possible adjuvant radiotherapy or observation.
• Locally advanced cases are managed with radiotherapy or chemoradiotherapy.
• Recurrent/metastatic cases may undergo salvage surgery and then platinum-based chemotherapy.
• Colour coding aids in distinguishing treatment modalities, and footnotes clarify specific recommendations and regimen options.](https://cdn.orris.care/cdss_images/GLGCA_4543429_1766517391917_e00a4aa6-47df-4193-8d27-fd69ec40aed0_7d4b87f8-3c03-48c3-8a0c-a719cf665e4a.png)
Summary : This flowchart presents the management algorithm for intrathyroid thymic carcinoma (ITC), detailing treatment pathways for resectable, locally advanced, and recurrent/metastatic disease, with node colours indicating treatment modalities and recommendations. flowchart: # Nodes : • ITC (purple rectangle, algorithm title) • Resectable (white rectangle) • Resect according to ESMO CPG on thyroid cancer [IV, A] (orange rectangle, surgery) • Adjuvant RTb [IV, B] (dark green rectangle, radiotherapy) • Observation [V, C] (white rectangle, non-treatment aspect) • Locally advanced (white rectangle) • RT or CRT [V, B] (dark green rectangle, radiotherapy/chemoradiotherapy) • Recurrent or metastatic (white rectangle) • Salvage surgerya [IV, A] (orange rectangle, surgery) • Platinum-based ChTc [V, B] (blue rectangle, systemic anticancer therapy) # Connectors : • ITC splits into three branches: Resectable, Locally advanced, Recurrent or metastatic. • Resectable → Resect according to ESMO CPG on thyroid cancer [IV, A] – Resect according to ESMO CPG → Adjuvant RTb [IV, B] and Observation [V, C] – Adjuvant RTb [IV, B] → Observation [V, C] • Locally advanced → RT or CRT [V, B] • Recurrent or metastatic → Salvage surgerya [IV, A] → Platinum-based ChTc [V, B] # Layout : • Three main vertical branches from the central ITC node. • Each branch represents a disease stage: resectable (left), locally advanced (middle), recurrent/metastatic (right). • Nodes are colour-coded: purple (title), orange (surgery), dark green (RT), blue (systemic therapy), white (other management/non-treatment). # Analysis : • The flowchart visually separates management strategies by disease stage, with clear progression from initial assessment to specific treatments. • Surgery is recommended for resectable and salvageable cases, followed by possible adjuvant radiotherapy or observation. • Locally advanced cases are managed with radiotherapy or chemoradiotherapy. • Recurrent/metastatic cases may undergo salvage surgery and then platinum-based chemotherapy. • Colour coding aids in distinguishing treatment modalities, and footnotes clarify specific recommendations and regimen options.
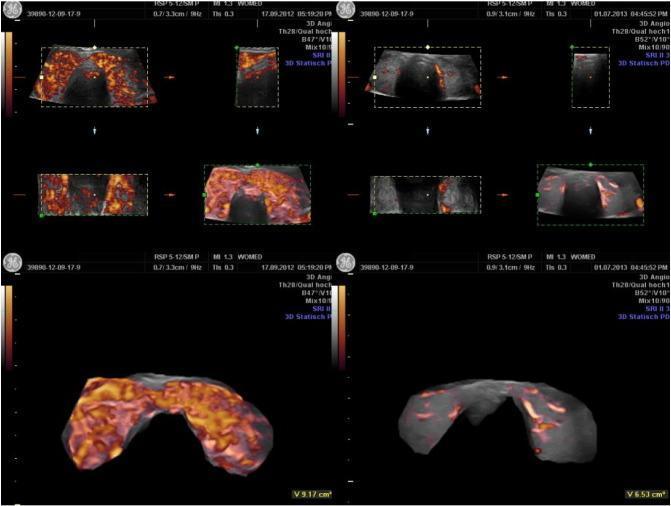
This diagnostic image set features comparative ultrasound studies of the thyroid gland in a patient with hyperthyroidism, demonstrating changes in morphology and perfusion over a 14-month treatment interval. The left panel shows the initial state with 3D Power Doppler imaging revealing marked hypervascularity (thyroid inferno) across both lobes and the isthmus, with a total glandular volume of 9.17 cm³. The right panel shows the follow-up state, characterized by a significant reduction in vascular density and a decrease in glandular volume to 6.53 cm³. The upper sections include multiplanar 2D ultrasound views (transverse and sagittal) with Power Doppler overlays, while the lower sections provide 3D volumetric reconstructions. These images illustrate the clinical utility of Power Doppler in assessing parenchymal vascularization intensity (Vascularization Index) and monitoring the response to therapy in autoimmune or endocrine thyroid disorders. The visual evidence correlates the reduction of thickened intra-thyroidal vessels and overall flow with the normalization of thyroid function.
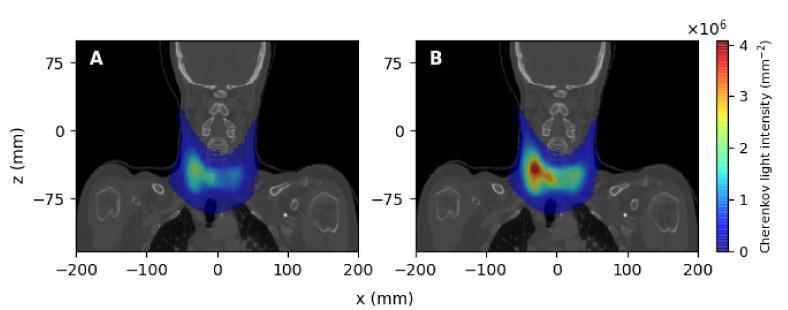
This diagnostic image set displays spectrally-integrated Cherenkov light intensity overlaid on coronal CT slices of a patient's neck, illustrating surface emission during hyperthyroidism treatment. Panels A and B represent administered Iodine-131 (I-131) activities of 400 MBq and 700 MBq, respectively. The heatmaps demonstrate the spatial distribution of light intensity emerging from the thyroid region, with a color scale ranging from blue (low intensity) to red/yellow (high intensity, up to 4x10^6 mm^-2). In Panel A, the emission is diffuse and centered over the thyroid lobes with lower peak intensity values. In Panel B, corresponding to higher radioactive activity, there is a more localized and prominent 'hot spot' of higher intensity on one side of the neck. This visualization serves as an educational tool for molecular radiotherapy (MRT) dosimetry, demonstrating how Cherenkov emission can correlate with internal radionuclide distribution and activity levels within anatomical structures like the thyroid gland.
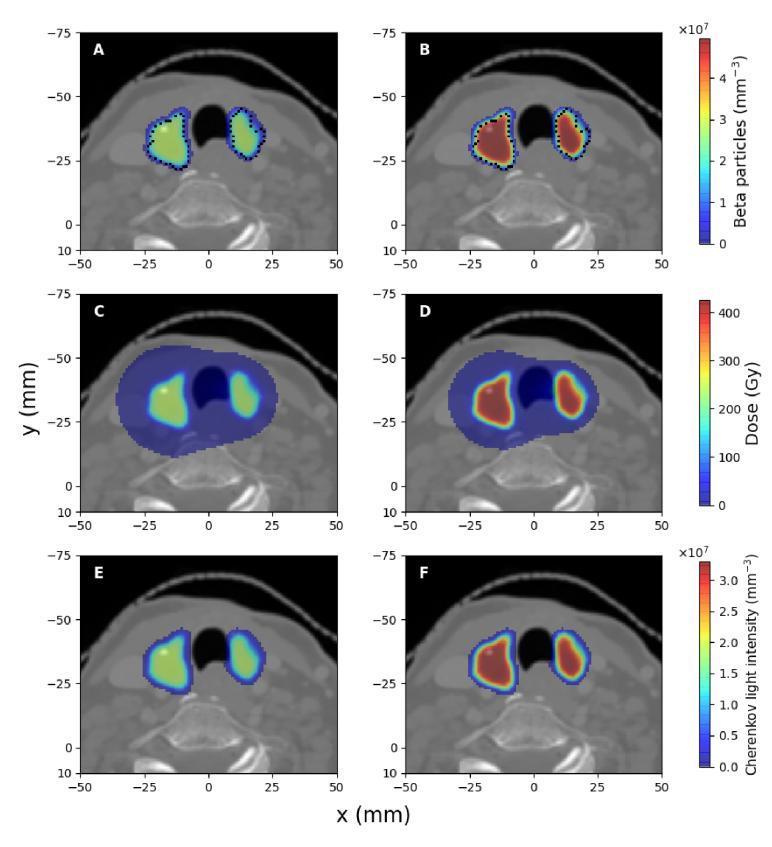
A comparison chart of clinical diagnostic images illustrating the spatial distribution of I-131 radioactive decay products in hyperthyroidism treatment. The images are displayed in a trans-axial plane (z=-50.6 mm) and organized into two columns representing administered activities of 400 MBq (left) and 700 MBq (right). Row 1 (A, B) shows beta particle concentration ($mm^{-3}$), with high intensity localized strictly within the bilateral thyroid lobes, demarcated by dotted contours. Row 2 (C, D) depicts the absorbed dose (Gy), demonstrating a broader spatial distribution that extends slightly beyond the thyroid lobes due to bremsstrahlung and gamma radiation. Row 3 (E, F) displays spectrally-integrated emitted Cherenkov light intensity ($mm^{-3}$), showing a localization pattern highly similar to beta particles but with distinct intensity scales. The 700 MBq group shows proportionally higher signal intensities across all parameters compared to the 400 MBq group. These simulations highlight the relationship between Cherenkov light emission and absorbed dose for molecular radiotherapy dosimetry.
"hyperthyroidism"[MeSH Terms] AND "antithyroid drugs"[MeSH Terms]
Hyperthyroidism: Management
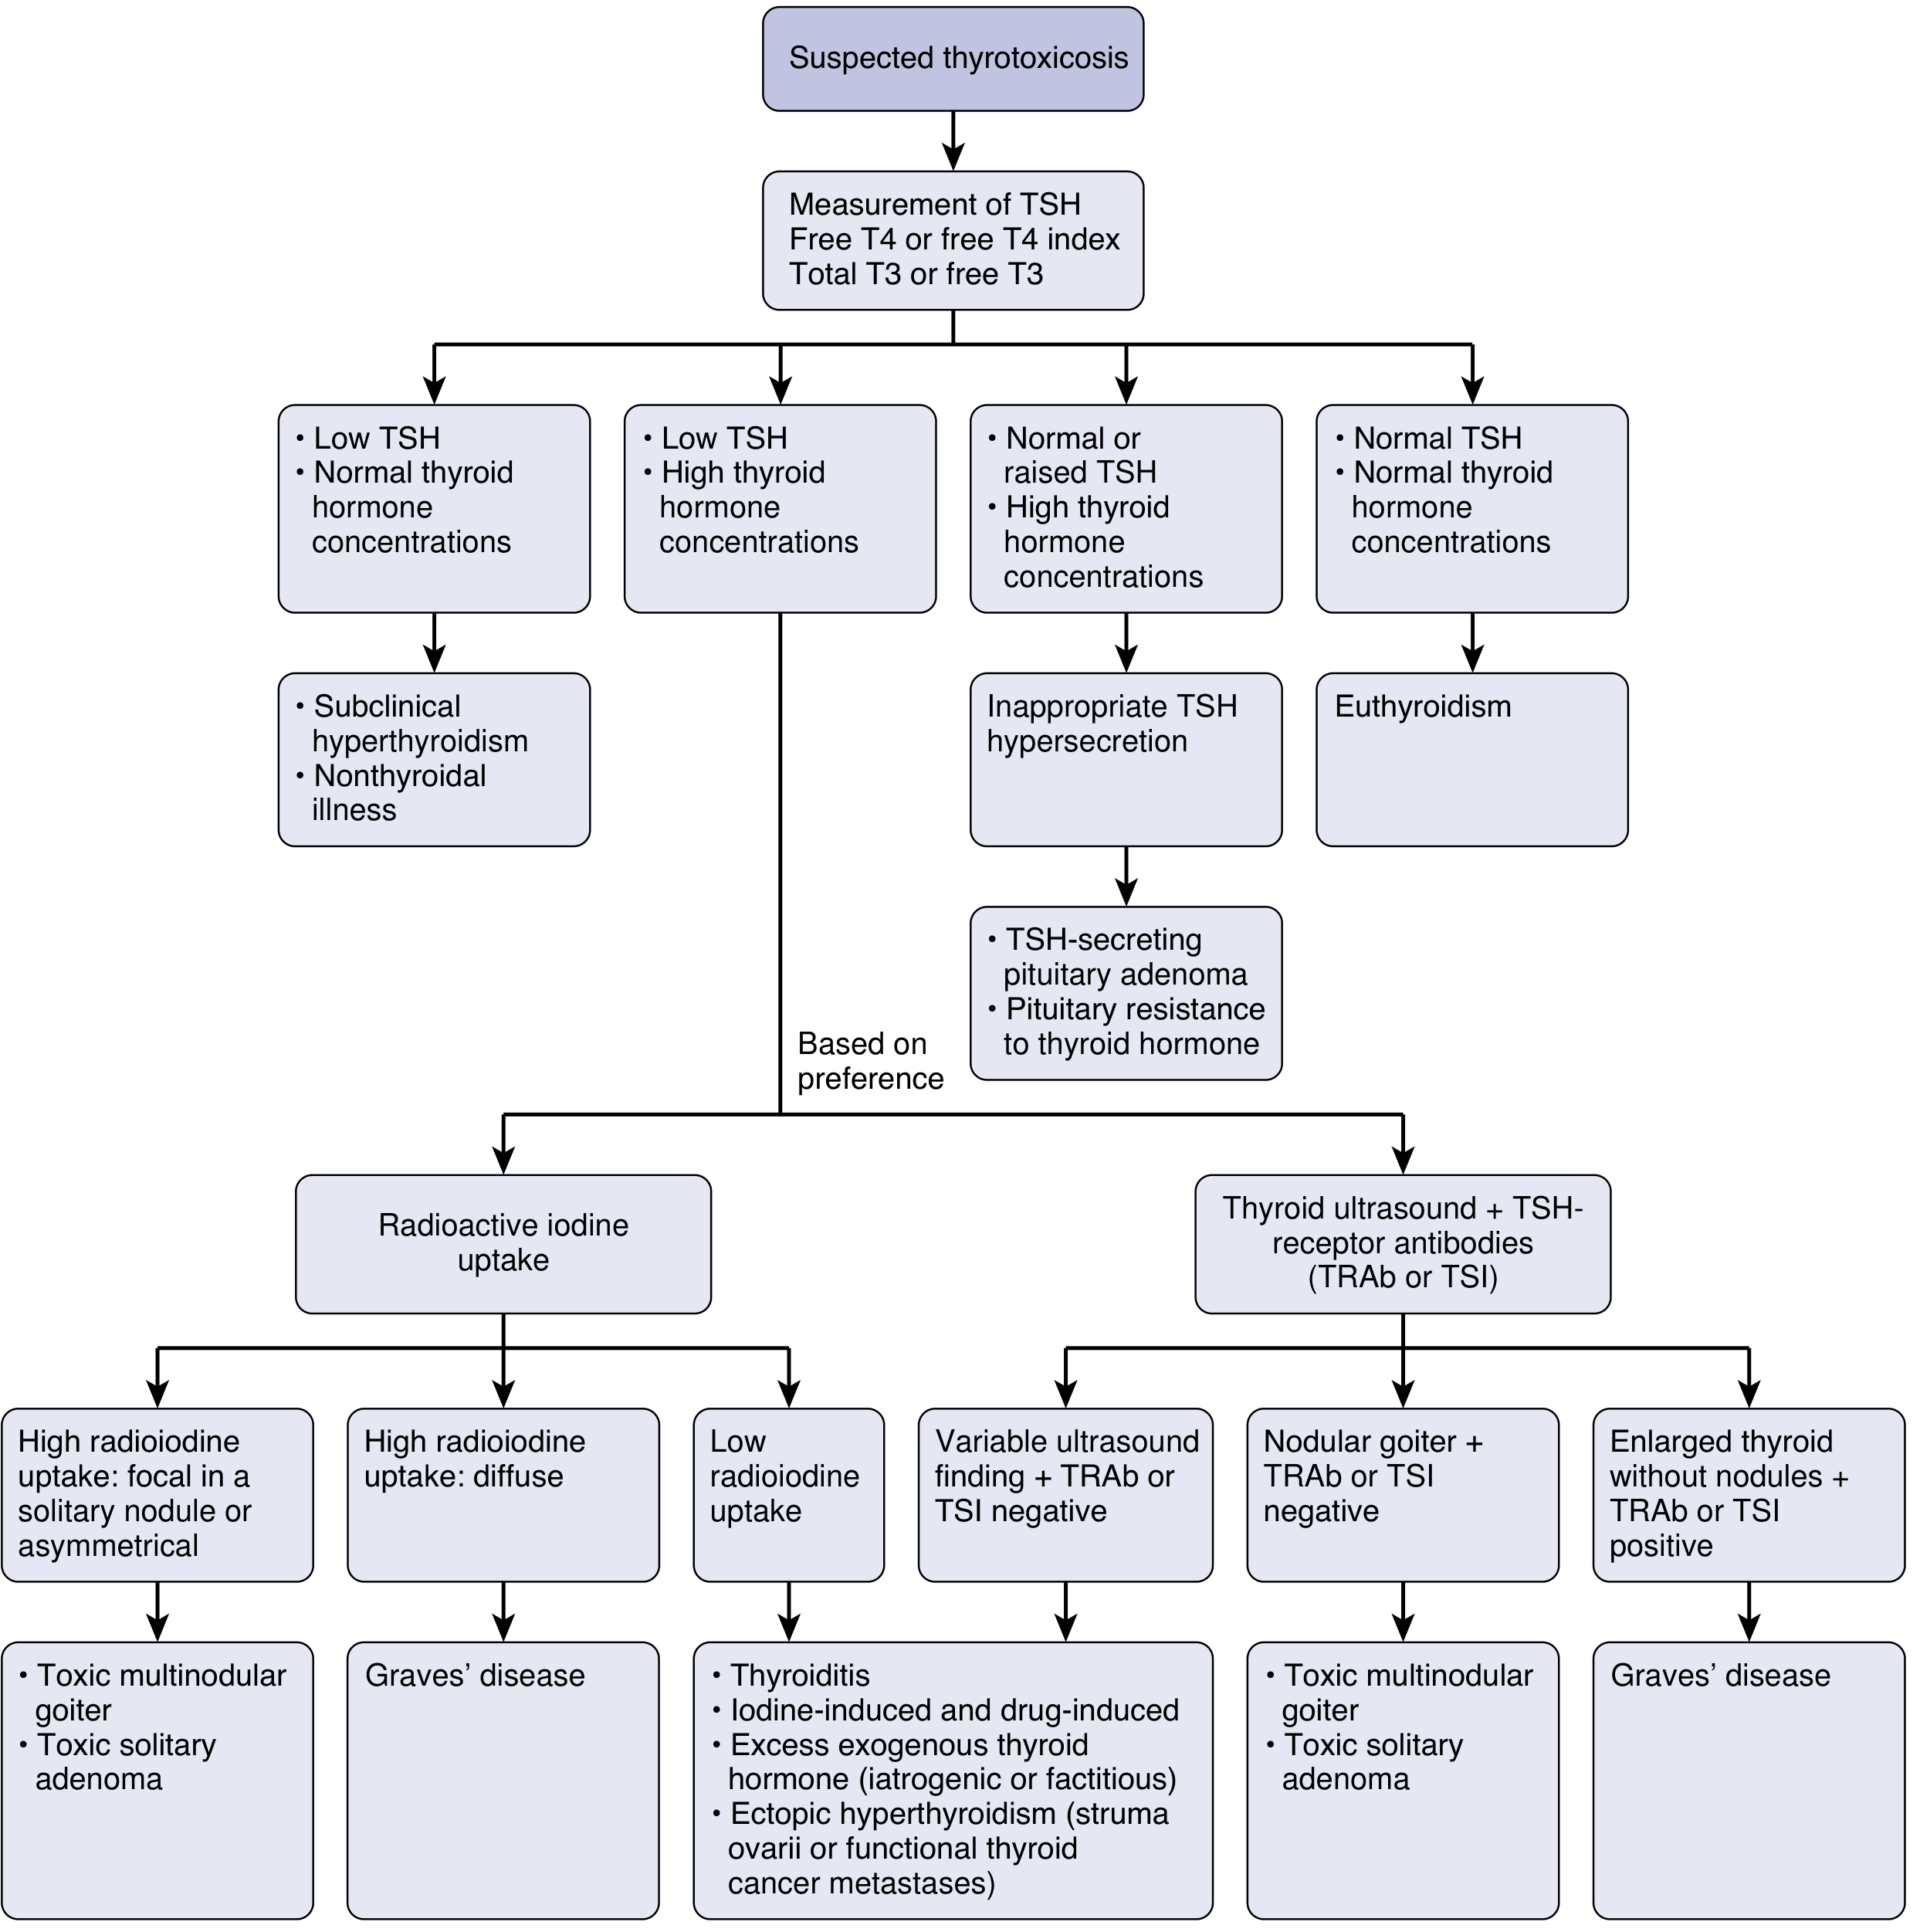
Overview of Treatment Modalities
Step 1: Immediate Symptom Control
- Elderly patients
- Resting HR > 90 bpm
- Coexistent cardiovascular disease
| Drug | Dose |
|---|---|
| Propranolol (non-selective) | 10-40 mg, 3-4x/day |
| Atenolol (beta-1 selective) | 25-100 mg, 1-2x/day |
| Metoprolol (beta-1 selective) | 25-50 mg, 2-3x/day |
- Beta-blockers are contraindicated in asthma (insufficient beta-1 selectivity at therapeutic doses). Use with caution in CHF, bradyarrhythmias, and Raynaud's disease.
- For patients intolerant to beta-blockers, calcium channel blockers provide effective rate control.
Step 2: Definitive Therapy - Choosing the Modality
Clinical Situations Table (ATA Guidance)
| Clinical Situation | RAI | ATD | Surgery |
|---|---|---|---|
| Pregnancy (1st trimester) | Contraindicated | Preferred (PTU) | Acceptable with caution |
| Active Graves' ophthalmopathy (GO) | Avoid | Preferred | Preferred |
| Inactive GO | Acceptable | Acceptable | Acceptable |
| Liver disease | Preferred | Caution | Acceptable |
| Large goiter / compressive symptoms | Acceptable | Acceptable | Preferred |
| Concurrent suspected thyroid malignancy | - | - | Preferred |
| High surgical risk / limited life expectancy | Preferred | Acceptable | Contraindicated |
| Women planning pregnancy within 6 months | - | Acceptable | Preferred |
Medical Management (Thionamides / ATDs)
Drugs Available
- Methimazole (MMI) - preferred agent in most situations (US, globally)
- Propylthiouracil (PTU) - reserved for specific scenarios
- Carbimazole - used in some countries; completely metabolized to MMI
MMI vs PTU - Key Differences
| Feature | MMI | PTU |
|---|---|---|
| Preferred? | Yes (first line) | Only for special situations |
| FDA Black Box Warning | No | Yes (2010) - liver injury / failure |
| Hepatotoxicity | Cholestatic (less severe) | Hepatocellular - can cause fulminant hepatic failure |
| Agranulocytosis | Lower risk at low doses | Higher risk at any dose |
| Pregnancy use | Teratogenic - avoid 1st trimester | Preferred in 1st trimester |
| Thyroid storm | 2nd line | Preferred (also blocks T4->T3 conversion) |
PTU use is now limited to:
- First trimester of pregnancy (MMI is teratogenic - causes aplasia cutis, choanal/esophageal atresia, omphalocele, cardiac/urinary malformations)
- Thyroid storm
Duration and Remission
- Treat for 12-18 months (randomized trial data shows no benefit beyond 18 months)
- Remission = biochemical euthyroidism >12 months after stopping therapy
- Relapse rate: 20-30% over 3-5 years
- If TRAb levels normalize, taper and discontinue
- On relapse: consider definitive therapy (RAI or surgery)
Geographic Practice Variation
- Europe, Latin America, Japan: Favour ATDs as first-line; surgery reserved for relapse
- USA: RAI historically preferred as first-line for Graves' disease
ATD Adverse Effects - Monitoring
| Adverse Effect | Details |
|---|---|
| Agranulocytosis | ANC < 500/uL; presents as fever/sore throat - STOP drug immediately, check CBC, IV broad-spectrum antibiotics, consider G-CSF |
| Vasculitis | Rare |
| MMI hepatotoxicity | Cholestatic pattern |
| PTU hepatotoxicity | Hepatocellular - potentially fatal |
Adjunctive Medical Therapies
- Glucocorticoids - inhibit peripheral T4→T3 conversion; used in thyroid storm
- Cholestyramine + MMI - lowers T3/T4 faster than MMI alone
- Lugol's solution / potassium iodide (SSKI) - used pre-operatively in Graves' disease (Wolff-Chaikoff effect - blocks hormone release); given 5-7 days pre-op
- Lithium and rituximab - infrequently used; limited by adverse effects
Radioactive Iodine (RAI) Therapy
- Goal: Ablate sufficient thyroid tissue to render the patient euthyroid (ideally hypothyroid - best marker of reversal of adverse tissue effects)
- Preferred first-line in the USA for Graves' disease and toxic multinodular goiter (TMNG)
- Contraindicated in: Pregnancy, active/moderate-severe Graves' ophthalmopathy, breastfeeding
- Long-term all-cause and vascular mortality increase after RAI is likely attributable to the underlying thyrotoxicosis, not RAI itself
- Fear of post-RAI cancer has not been realized in long-term studies - though Graves' disease itself may carry a slight increase in thyroid cancer risk
- In children < 5 years: Generally avoided; European Thyroid Association recommends thyroidectomy as primary therapy in childhood
Surgical Management (Thyroidectomy)
Indications
- Women planning pregnancy within <6 months
- Moderate-to-severe Graves' ophthalmopathy (active GO)
- Large thyroid nodules >4 cm, large goiters with compressive symptoms
- Suspected or known thyroid malignancy
- Concurrent primary hyperparathyroidism requiring parathyroidectomy
- Persistent disease despite ATD or RAI
- Children with Graves' (<5 years, or non-compliant with medications)
- Patient preference (rapid correction desired)
Procedure
- Total or near-total thyroidectomy for Graves' disease and TMNG
- Thyroid lobectomy for toxic adenoma
- Persistent/recurrent hyperthyroidism after total thyroidectomy: 0.3%
- After single-dose RAI: 21%
- After subtotal thyroidectomy: 10%
Preoperative Preparation
- Achieve euthyroid state with ATDs +/- beta-blockers (reduces perioperative risk, prevents thyroid storm)
- For Graves' disease: Lugol's solution or SSKI 5-7 days pre-op (reduces gland vascularity and intraoperative blood loss)
- Assess and manage cardiovascular comorbidities
Complications
- Hypoparathyroidism (highest risk with Graves' disease surgery)
- Recurrent laryngeal nerve (RLN) injury
- Thyroid storm (rare perioperative complication, risk minimized with adequate pre-op ATDs)
Relative Contraindications to Surgery
- Severe cardiopulmonary disease
- Advanced malignancy with short life expectancy
Special Populations
Pregnancy
- RAI is absolutely contraindicated throughout pregnancy
- First trimester: PTU preferred (MMI teratogenic)
- After first trimester: Switch to MMI (lower risk than PTU's hepatotoxic potential long-term)
- Surgery: Reserved for failed/contraindicated medical therapy; safest in second trimester
- Aim for lowest effective ATD dose (fetal hypothyroidism risk)
Children / Pediatric Graves' Disease
- MMI therapy for 1-2 years is initial management (PTU avoided due to hepatotoxicity risk)
- Most will NOT achieve durable remission on medication alone
- Surgery strongly preferred for children <5 years or large glands >80 g
- High-volume pediatric/thyroid surgeon is critical
Thyroid Storm (Thyrotoxic Crisis)
- PTU - blocks new hormone synthesis AND peripheral T4→T3 conversion
- Glucocorticoids - further inhibit T4→T3 conversion, treat possible adrenal insufficiency
- Iodine (Lugol's/SSKI) - given 1+ hour after PTU to block hormone release (Wolff-Chaikoff)
- Beta-blockers - control HR and adrenergic symptoms
- Supportive care - cooling, IV fluids, treat precipitating cause
Graves' Ophthalmopathy (GO)
- Active, moderate-to-severe GO: Surgery or ATDs preferred; RAI may worsen GO
- Teprotumumab - IGF-1R inhibitor; approved for active thyroid eye disease; data shows efficacy and safety in longer-duration disease and retreatment scenarios
- Selenium supplementation for mild GO
- Orbital decompression, radiotherapy, or immunosuppression for severe cases
Summary Algorithm
Hyperthyroidism confirmed (low TSH + high T3/T4)
          |
    Symptomatic? --> Beta-blocker immediately
          |
    Establish etiology (Graves' / TMNG / toxic adenoma / thyroiditis)
          |
    Choose definitive therapy:
    ┌─────────────────────────────────────────────────────────┐
    │  ATDs (MMI)     │  RAI            │  Surgery           │
    │  - Young pts    │  - US pref.     │  - Pregnancy <6mo  │
    │  - Europe pref. │  - Older adults │  - Active GO       │
    │  - Pregnancy    │  - TMNG         │  - Large goiter    │
    │  - Mild disease │  - No preg/GO   │  - Malignancy      │
    └─────────────────────────────────────────────────────────┘
- Current Surgical Therapy, 14th Edition - Medical and Surgical Management of Hyperthyroidism, pp. 889-895
- Scott-Brown's Otorhinolaryngology Head & Neck Surgery Vol 1 - Box 61.4, Management of Hyperthyroidism
- Katzung's Basic and Clinical Pharmacology, 16th Edition - Antithyroid Agents and Management of Hyperthyroidism, p. 1098
- Goodman & Gilman's Pharmacological Basis of Therapeutics - Thyroid Storm