
Teach me ECG from beginning
Reading File
Now let me search the medical library for ECG content across multiple angles simultaneously.
Finding Sources
Finding Sources
Finding Sources
Finding Sources
Reading File
Reading File
Finding Sources
Reading File
Reading File
Reading File
Reading File
Now let me fetch the key ECG diagrams and get interval/normal values data.
Loading Image
Loading Image
Finding Sources
Loading Image
Finding Sources
Reading File
I now have excellent material from the textbooks (Ganong's Physiology, Gray's Anatomy, Miller's Anesthesia, Roberts & Hedges' Emergency Procedures) along with the key diagrams. Let me compile the comprehensive ECG teaching guide.
ECG from the Beginning: A Complete Guide
Part 1 - Why the Heart Generates Electricity
The heart is a pump controlled entirely by electricity. Specialized muscle cells spontaneously generate and conduct electrical impulses, and these impulses cause contraction. The electrocardiogram (ECG) is a recording of these electrical events from electrodes placed on the body surface - it measures differences in electrical potential generated by the heart.
Part 2 - The Cardiac Conduction System
Before reading an ECG, you must understand what generates the signals. Here is the pathway, in order:
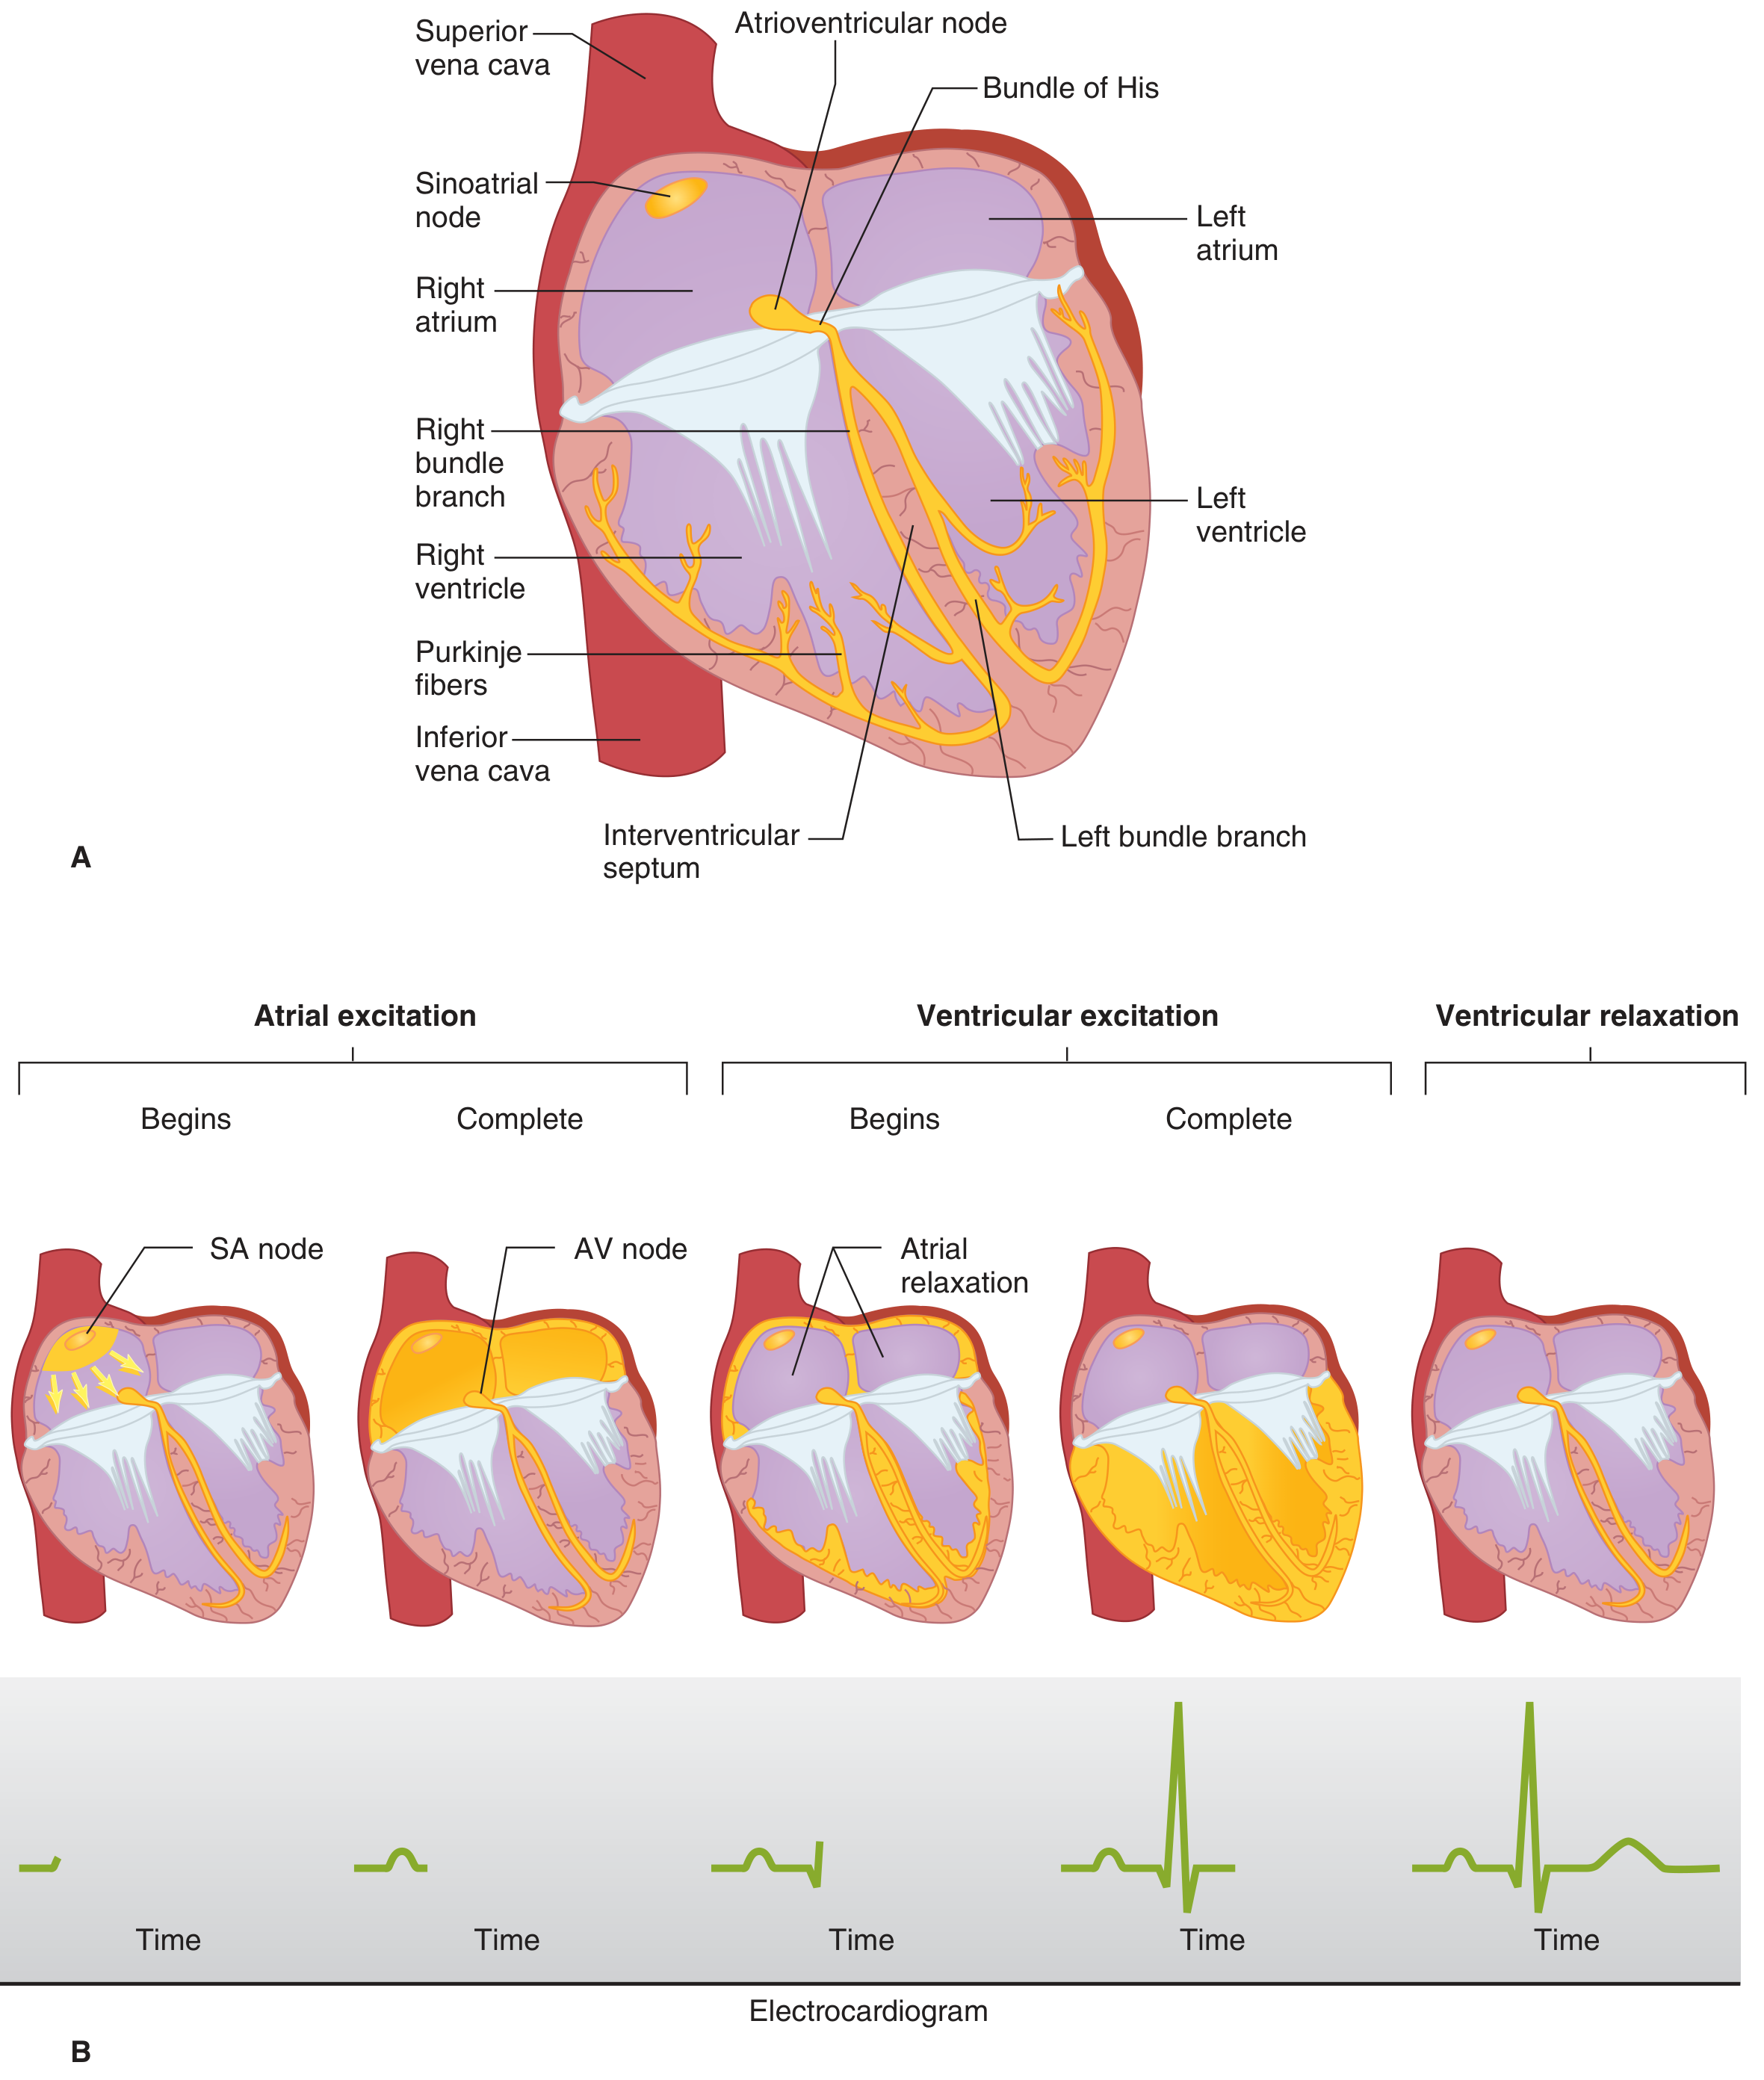
The Conduction Pathway (Step by Step)
| Step | Structure | What Happens | ECG Equivalent |
|---|---|---|---|
| 1 | Sinoatrial (SA) node | Located at the junction of the SVC and right atrium - the heart's natural pacemaker. Fires spontaneously ~60-100 times/min | Start of P wave |
| 2 | Atria | Excitation spreads across both atria, causing them to contract | P wave completes |
| 3 | AV node | Located near the coronary sinus opening. Deliberately slows conduction (gatekeeper) to allow atria to finish filling the ventricles | PR segment (isoelectric delay) |
| 4 | Bundle of His | Continuation of AV node, passes along the interventricular septum | Still PR interval |
| 5 | Right & Left bundle branches | Split at the septum, travel toward each apex | Late PR / early QRS |
| 6 | Purkinje fibers | Fine network spreading throughout ventricular subendocardium - fastest conduction in the heart | QRS complex |
| 7 | Ventricular myocardium | Depolarization from apex to base, causing contraction | QRS |
| 8 | Ventricular repolarization | Cells reset back to resting potential | T wave |
Key point: The SA node fires fastest (~70/min), so it overrides all other pacemakers. If the SA node fails, the AV node takes over (~45/min). If the AV node fails, ventricular muscle takes over (~30/min, called idioventricular rhythm).
- Gray's Anatomy for Students, p. 247
- Ganong's Review of Medical Physiology, 26th ed., p. 524
Part 3 - ECG Waves, Segments, and Intervals
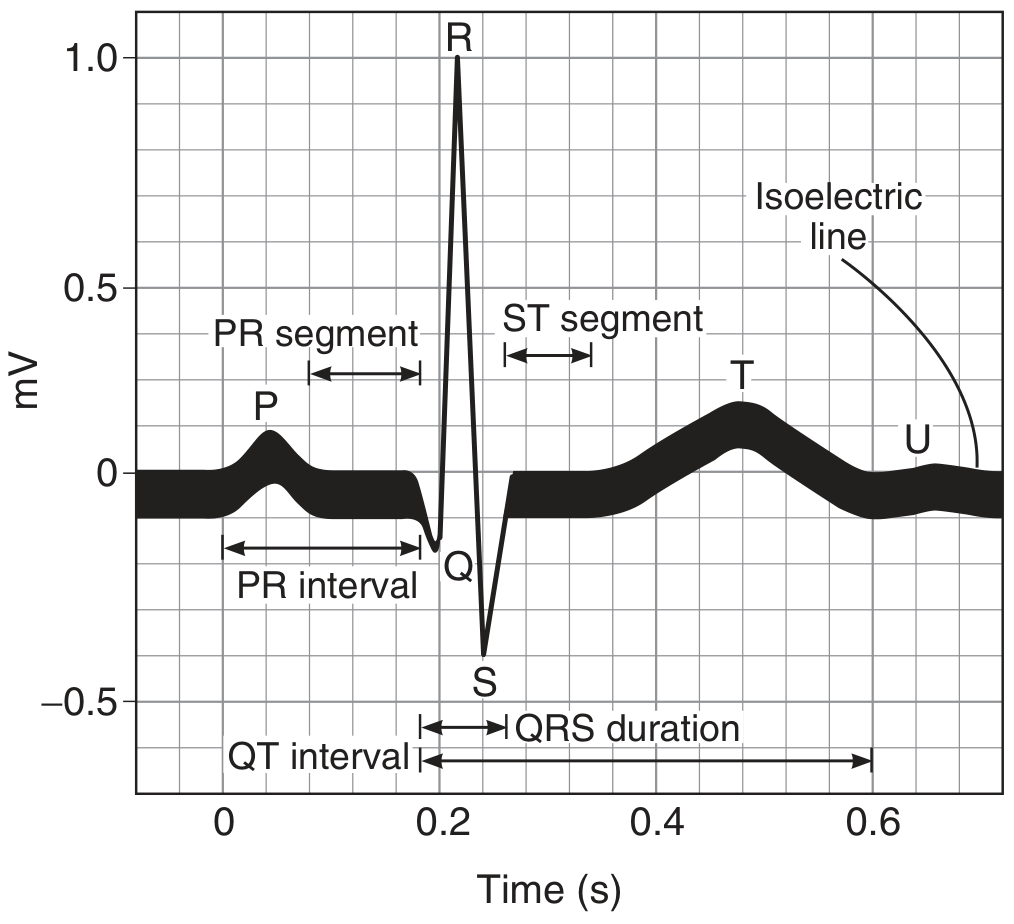
Every Component Explained
P wave
- Represents atrial depolarization (both atria contracting)
- Small, rounded, upright in most leads
- Duration: < 0.12 s (3 small squares)
- Amplitude: < 2.5 mm
PR interval
- From the start of P wave to start of QRS
- Represents time for impulse to travel from SA node through AV node to ventricles (AV conduction time)
- Normal: 0.12 - 0.20 s (3-5 small squares)
- Prolonged PR = heart block; Short PR = pre-excitation (e.g., WPW syndrome)
QRS complex
- Represents ventricular depolarization
- Q = first negative deflection (septal depolarization, left to right)
- R = tall positive deflection (ventricular depolarization, apex to base)
- S = negative deflection after R (basal depolarization)
- Normal duration: < 0.10 s (< 2.5 small squares)
- Wide QRS (> 0.12 s) = bundle branch block or ventricular rhythm
ST segment
- From end of QRS (J point) to start of T wave
- Should sit on the isoelectric line
- ST elevation = acute MI, pericarditis, Brugada
- ST depression = ischemia, reciprocal changes, digoxin effect
T wave
- Represents ventricular repolarization
- Normally upright in I, II, V3-V6; inverted in aVR
- Tall peaked T = hyperkalemia
- Flat or inverted T = ischemia, LVH, electrolyte disturbance
QT interval
- From start of QRS to end of T wave
- Represents total ventricular electrical activity (depolarization + repolarization)
- Normal: < 0.43 s (rate-dependent - use corrected QTc)
- Prolonged QT = risk of Torsades de Pointes (dangerous arrhythmia)
U wave
- Small wave after T wave - inconstant, not always visible
- Most prominent in leads V2-V3
- Prominent U = hypokalemia, bradycardia
Normal Interval Summary Table
| Interval | Average | Normal Range | Meaning |
|---|---|---|---|
| PR interval | 0.18 s | 0.12 - 0.20 s | AV conduction |
| QRS duration | 0.08 s | up to 0.10 s | Ventricular depolarization |
| QT interval | 0.40 s | up to 0.43 s | Ventricular action potential |
| ST interval | 0.32 s | - | Plateau of ventricular action potential |
Source: Ganong's Review of Medical Physiology, 26th ed., Table 29-2
Part 4 - The ECG Paper
Understanding the grid is essential before measuring anything.
Each small square  = 1 mm wide  = 0.04 s (40 ms)   at standard speed 25 mm/s
Each large square  = 5 mm wide  = 0.20 s (200 ms)
Each large square  = 5 mm tall  = 0.5 mV (at standard gain 10 mm/mV)
So counting is easy:
- 5 large squares across = 1 second
- Count large squares between R waves to get RR interval, then calculate rate
Heart Rate from ECG: Divide 300 by the number of large squares between two R waves.
| Large squares between R waves | Heart rate |
|---|---|
| 1 | 300/min |
| 2 | 150/min |
| 3 | 100/min |
| 4 | 75/min |
| 5 | 60/min |
| 6 | 50/min |
Memorize: 300, 150, 100, 75, 60, 50
- Roberts and Hedges' Clinical Procedures in Emergency Medicine, p. 346
Part 5 - The 12 Leads and What They "See"
A 12-lead ECG uses 10 electrodes to create 12 different views of the heart. Think of it like photographing the same building from 12 different angles.
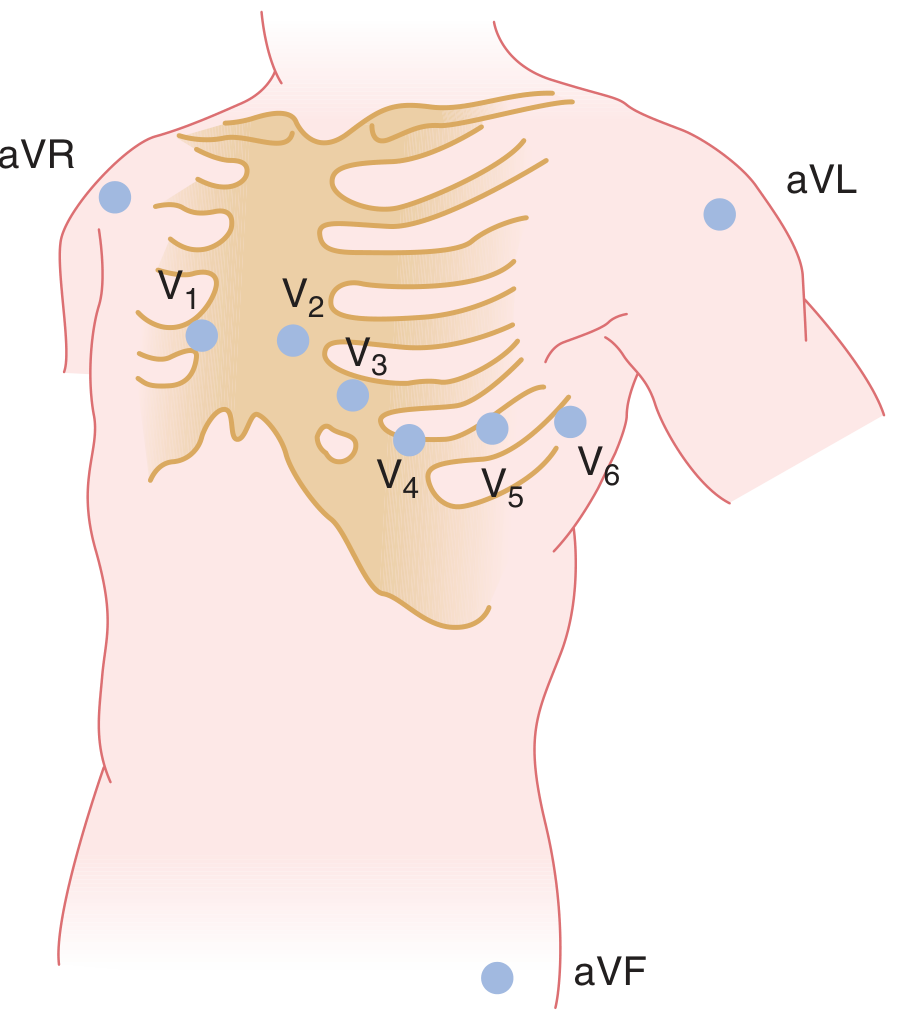
Limb Leads (Frontal Plane)
Bipolar leads - record potential difference between two limbs:
- Lead I: Left arm (+) vs Right arm (-) - looks at the heart from the left side
- Lead II: Left leg (+) vs Right arm (-) - looks at the inferior-left
- Lead III: Left leg (+) vs Left arm (-) - looks at the inferior-right
Augmented unipolar leads - each records from one limb against the average of the other two:
- aVR: Right arm - looks at the cavity of the heart from above-right (normally negative)
- aVL: Left arm - looks at the high lateral wall
- aVF: Left foot - looks at the inferior wall (diaphragmatic surface)
Precordial (Chest) Leads (Horizontal Plane)
| Lead | Position | Region of Heart |
|---|---|---|
| V1 | 4th intercostal space, right sternal border | Septal |
| V2 | 4th intercostal space, left sternal border | Septal |
| V3 | Between V2 and V4 | Anterior |
| V4 | 5th intercostal space, midclavicular line | Anterior |
| V5 | Anterior axillary line (same level as V4) | Lateral |
| V6 | Midaxillary line (same level as V4-5) | Lateral |
Lead Groupings by Territory (Critical for MI localization)
| Leads | Territory | Coronary Artery |
|---|---|---|
| II, III, aVF | Inferior wall | Right Coronary Artery (RCA) |
| V1-V4 | Anterior/Septal | Left Anterior Descending (LAD) |
| I, aVL, V5-V6 | Lateral wall | Left Circumflex (LCx) |
| V1-V2 (reciprocal changes) | Posterior wall | RCA or LCx |
- Roberts and Hedges' Clinical Procedures in Emergency Medicine, p. 346-350
- Miller's Anesthesia 10th ed.
Part 6 - A Systematic Approach to Reading Every ECG
Never look at an ECG randomly. Always use a system. Here is one that works:
Step 1 - Rate
Count the RR interval in large squares. Use the 300 method above.
- Normal: 60-100/min
- Bradycardia: < 60/min
- Tachycardia: > 100/min
Step 2 - Rhythm
- Is it regular? (Are all RR intervals equal?)
- Is there a P wave before every QRS?
- Is there a QRS after every P wave?
- If regular with P before QRS: Sinus rhythm
Step 3 - Axis
The cardiac axis is the average direction of ventricular depolarization. Look at leads I and aVF:
- Lead I +, aVF +: Normal axis (-30° to +90°)
- Lead I +, aVF -: Left axis deviation (< -30°) - seen in left bundle branch block, inferior MI
- Lead I -, aVF +: Right axis deviation (> +90°) - seen in right bundle branch block, right ventricular hypertrophy
Step 4 - P waves
- Present?
- Normal morphology (upright in II, inverted in aVR)?
- One P per QRS?
Step 5 - PR interval
- Normal (0.12-0.20 s)?
- Long = heart block
- Short = pre-excitation
Step 6 - QRS complex
- Width < 0.10 s? (Wide = bundle branch block or ventricular origin)
- Q waves present? (Pathological Q = > 0.04 s wide or > 25% of R wave height = old MI)
- R wave progression in chest leads? (R should get taller from V1 to V5, called "normal R wave progression")
Step 7 - ST segment
- Elevation (> 1 mm in limb leads, > 2 mm in chest leads)?
- Depression?
- Flat, down-sloping, or up-sloping?
Step 8 - T waves
- Upright in expected leads?
- Inverted? Peaked? Flattened?
Step 9 - QT interval
- Measure and correct for rate: QTc = QT / √RR (Bazett's formula)
- Normal QTc < 440 ms (men), < 460 ms (women)
Part 7 - Key Abnormalities at a Glance
| Finding | Common Causes |
|---|---|
| PR > 0.20 s | First-degree heart block (benign, AV node disease) |
| No relationship between P and QRS | Third-degree (complete) heart block - emergency |
| Wide QRS + specific pattern | Bundle branch block (RBBB or LBBB) |
| ST elevation | Acute STEMI, pericarditis, Brugada syndrome |
| ST depression | Ischemia, reciprocal change, digoxin |
| Tall peaked T waves | Hyperkalemia ("tented T waves") |
| Prolonged QTc | Hypokalemia, drugs (antipsychotics, antibiotics), congenital |
| Delta wave (slurred QRS upstroke) + short PR | Wolff-Parkinson-White syndrome |
| No R wave in V1-V2, Q waves in V1-V4 | Anterior MI (old or evolving) |
| P waves replaced by fibrillatory baseline + irregularly irregular rhythm | Atrial fibrillation |
Summary: The One-Line Takeaway for Each Part
- The heart fires electricity in one direction: SA node → AV node → Bundle of His → Bundle branches → Purkinje fibers → myocardium
- P = atria contract; QRS = ventricles contract; T = ventricles reset
- The paper: 1 small box = 0.04 s and 0.1 mV
- 12 leads = 12 views of the heart from different angles
- Always read in order: Rate → Rhythm → Axis → P → PR → QRS → ST → T → QT
Once you are comfortable with this foundation, the next steps are learning specific arrhythmias (AF, SVT, VT, heart blocks), axis deviation, bundle branch blocks, and MI patterns in detail. Ask when you are ready to go deeper into any section.
This is a shared conversation. Sign in to Orris to start your own chat.