I now have all the core textbook content I need. Let me now write the complete answers for all Group C and Group D questions.
GROUP C - SHORT NOTES (5 Marks)
C1. Disability Rates
Definition: Disability rates are epidemiological measures that quantify the burden of disability in a population. They express the number of persons with disability as a proportion of the total population.
Types of Disability Rates
1. Prevalence of Disability
= (Number of persons with disability / Total population) × 1000 (or per 10,000 or %)
The most commonly used measure. Captures the stock of disability in the community at a given point in time.
2. Incidence of Disability
= (Number of new cases of disability occurring in a defined period / Population at risk) × 1000
Captures the rate of new disability arising - useful for studying specific disabling conditions.
3. Cause-Specific Disability Rate
= (Number of persons disabled due to a specific cause / Total population) × 1000
Example: disability rate due to leprosy, road traffic accidents, polio.
4. Grade-Specific Disability Rate (in Leprosy)
Under NLEP, WHO classifies leprosy disability into:
- Grade 0: No anaesthesia, no visible deformity or damage
- Grade 1: Anaesthesia present, but no visible deformity or damage
- Grade 2: Visible deformity or damage present (e.g., claw hand, foot drop, lagophthalmos)
The Grade 2 Disability Rate = (New cases with Grade 2 disability / Total new cases detected) × 100
- This is a key programme indicator in NLEP - ideally should be <1% of new cases
5. New Case Disability Rate (NCDR): Proportion of new cases detected with visible Grade 2 deformity. Reflects delay in diagnosis and treatment.
6. Disability-Free Life Expectancy (DFLE): Years expected to be lived free from disability - a positive health indicator.
Significance of Disability Rates
- Assess the magnitude of disability burden in the community
- Evaluate effectiveness of prevention and rehabilitation programs
- Guide resource allocation for rehabilitation services
- Monitor trends (e.g., reduction in Grade 2 leprosy disability with early MDT treatment)
- Used in welfare planning and disability certification policies
India Context
- Census 2011: 2.68 crore persons with disability = 2.21% of population
- Categories: visual, hearing, speech, locomotor, mental illness, mental retardation, multiple disabilities
- Rights of Persons with Disabilities Act 2016: 21 categories of disability recognized; persons with ≥40% disability entitled to benefits
- Park's Textbook of Preventive and Social Medicine
C2. DALY (Disability-Adjusted Life Year)
DALY is a summary measure of population health that combines information on both mortality and morbidity into a single metric. It quantifies the burden of disease as the gap between current health status and an ideal situation where everyone lives to old age in full health.
Formula
DALY = YLL + YLD
| Component | Full Form | Meaning |
|---|
| YLL | Years of Life Lost (to premature mortality) | Number of deaths × standard life expectancy at age of death |
| YLD | Years of (healthy) Life lost due to Disability | Number of incident cases × disability weight × average duration of disability |
One DALY = one year of healthy life lost
Components Explained
YLL (Years of Life Lost to mortality):
YLL = Number of deaths × (Standard life expectancy at age of death - Age at death)
- Standard life expectancy based on Japanese life tables (longest life expectancy globally)
- A death at age 30 (when life expectancy is 80) = 50 YLLs
YLD (Years Lived with Disability):
YLD = Incidence × Disability Weight × Average Duration
- Disability weights range from 0 (perfect health) to 1 (equivalent to death)
- Example: Blindness disability weight ≈ 0.6; deafness ≈ 0.2
Key Features of DALY
- Social weighting (age weighting): Years lived as a young adult are valued higher than as a child or elderly - reflects society's interest in productivity
- Time discounting: Future years of health are discounted at 3% per year (accounts for preference for present health over future health)
- Developed by Murray & Lopez for the World Bank's Global Burden of Disease Study (1993)
Uses of DALY
- Compare disease burden across different conditions (communicable vs. NCD vs. injuries)
- Guide health policy - identify priority diseases for resource allocation
- Cost-effectiveness analysis - "cost per DALY averted" is a standard metric
- International comparisons between countries
- Monitor progress in reducing disease burden over time
- Highlights neglected conditions - e.g., psychiatric/neurological conditions account for 28% of YLD but only 1.4% of all deaths - revealing their huge, often-underestimated burden
Key Findings from GBD Studies
- 5 of the top 10 leading causes of disability worldwide are psychiatric conditions (depression, anxiety, schizophrenia, bipolar disorder, substance use)
- Global DALYs have remained largely stable from 1990-2019 but correcting for population growth shows improvement
- Disease burden has been shifting from communicable diseases to NCDs and injuries, and from premature death to years lived with disability
Limitations
- Disability weights are value-laden and culturally variable
- Data quality varies across countries
- Age weighting and discounting remain controversial
- Does not capture quality of life beyond disability
- Park's Textbook of Preventive and Social Medicine; Kaplan & Sadock's Comprehensive Textbook of Psychiatry
GROUP D - ESSAYS/WRITE-UPS (4 Marks)
D1. Monitoring and Surveillance - Differences with Examples
Though often used interchangeably in common language, monitoring and surveillance have distinct meanings in public health practice (Park's):
| Feature | Monitoring | Surveillance |
|---|
| Definition | "Performance and analysis of routine measurements aimed at detecting changes in the environment or health status of populations" | "Continuous, systematic collection, analysis, and interpretation of health data closely integrated with timely dissemination for public health action" |
| Nature | Episodic, intermittent, more technical | Continuous, ongoing, requires professional judgment |
| Process | Measurement + analysis | Collection + analysis + interpretation + action |
| Output | Tracks quantities (weight, pollutant levels) | Leads to recommendations and control activities |
| Who does it | Technicians, automated instruments | Epidemiologists, public health professionals |
| Examples | Growth monitoring (monthly weighing of children), air quality monitoring, blood glucose monitoring of a diabetic patient | IDSP (Integrated Disease Surveillance Programme) for outbreak detection, AFP surveillance for polio, dengue surveillance |
In essence: Monitoring becomes one specific, essential part of the broader concept of surveillance. Surveillance encompasses monitoring plus professional analysis and action.
Examples:
- Monitoring: An ANM weighing all under-5 children monthly and plotting on growth charts - this is growth monitoring
- Surveillance: IDSP collects S/P/L forms weekly from all districts; epidemiologists analyze trends; if cholera cases increase by >25% over 3-week baseline, an outbreak alert is issued and investigation is initiated - this is disease surveillance
D2. Health is Multi-Dimensional - Justify
The WHO definition of health (1948): "Health is a state of complete physical, mental and social well-being, and not merely the absence of disease or infirmity."
This definition, while aspirational, recognizes the multi-dimensional nature of health:
1. Physical Dimension
- Absence of disease, injury, or disability
- Normal functioning of organ systems
- Adequate nutrition, fitness, immunity
- Example: A person free from tuberculosis, with adequate haemoglobin and normal BP
2. Mental/Psychological Dimension
- "A state of well-being in which the individual realizes his/her own abilities, can cope with normal stresses, can work productively, and contributes to the community" (WHO definition of mental health)
- Includes emotional stability, cognitive function, absence of anxiety/depression
- Example: Adequate mental health cannot be substituted by physical health alone
3. Social Dimension
- Ability to fulfill social roles and relationships
- Social support networks, community integration
- Freedom from social exclusion and discrimination
- Example: A person with controlled diabetes who maintains family and occupational roles
4. Spiritual/Existential Dimension (added later by WHO, South East Asian Region)
- Sense of purpose, meaning, and inner peace
- Harmony with one's values and belief system
5. Vocational Dimension
- Ability to engage in productive, meaningful work
Why multi-dimensionality matters:
- These dimensions are interdependent - poor mental health worsens physical illness (depression worsens recovery from MI) and vice versa
- A purely biomedical model (absence of disease) is inadequate
- Health promotion must address all dimensions - not just curative care
- DALY captures both physical and mental health burden in a single metric
Justification: A person with a below-knee amputation has a physical impairment (physical dimension affected) but may maintain excellent mental health, productive employment, and social relationships - and is thus healthier across dimensions than a physically intact person with untreated severe depression. This illustrates why health cannot be reduced to a single dimension.
D3. Infant Mortality Rate is a Sensitive Indicator of Community Health
IMR Definition: Number of deaths of children under 1 year of age per 1000 live births in a given year.
Why IMR is the most sensitive indicator of community health (Park's):
1. Reflects multiple determinants simultaneously
IMR is influenced by: maternal health, nutritional status, quality of MCH services, immunization coverage, safe water and sanitation, birth spacing, breastfeeding practices, socioeconomic conditions, female literacy - essentially ALL determinants of health in one number.
2. Responds quickly to health improvements
"Infant mortality is affected rather quickly and directly by specific health programmes and hence may change more rapidly than the general death rate." (Park's) - A new vaccination program or ORS promotion campaign produces a measurable change in IMR within years.
3. Largest single age-category of mortality
Infants are uniquely vulnerable; diseases at this age differ from those of adults. IMR captures this unique vulnerability period.
4. Reflects equity
Wide disparities in IMR between rich and poor, urban and rural populations within a country reveal health inequalities.
5. International comparisons are valid and meaningful
Japan: IMR 2/1000; India: 32/1000 (2018); Niger: >50/1000 - these differences directly reflect development levels.
6. Composite of multiple sub-indicators:
- Neonatal Mortality Rate (deaths <28 days): Reflects antenatal care, safe delivery practices, care of newborn
- Post-neonatal Mortality Rate (28 days - 1 year): Reflects infection control, nutrition, immunization, safe water
7. Sensitive to socioeconomic development
Strong inverse correlation with per capita income, female literacy, safe water access - making it a proxy for overall development.
Limitation: Depends on accurate registration of births and infant deaths - under-registration can distort the value (especially in India).
India's IMR trend: 88 (1990) → 32 (2018) → current ~28 (SRS 2020) - reflecting improvement in MCH services but still above global average of 29.
D4. Disability and Handicap are not Synonymous
Based on the WHO ICIDH (International Classification of Impairments, Disabilities and Handicaps):
| Feature | Disability | Handicap |
|---|
| Definition | "Any restriction or lack (resulting from an impairment) of ability to perform an activity in the manner considered normal for a human being" | "A disadvantage for a given individual, resulting from an impairment or disability, that limits or prevents fulfilment of a normal role" |
| Level | Level of the person (functional) | Level of society (social role) |
| Nature | Functional limitation | Social consequence/disadvantage |
| Determinants | Biological/physical | Social, cultural, environmental factors |
| Question | "What CAN'T this person DO?" | "What role is this person DENIED in society?" |
Key distinction: The same disability may lead to different degrees of handicap depending on the social context and environment.
Example - Below-Knee Amputation:
- Impairment: Loss of lower limb (anatomical)
- Disability: Inability to walk without prosthesis, difficulty climbing stairs
- Handicap: Two scenarios -
| Scenario | Person A | Person B |
|---|
| Occupation | Software engineer (sedentary desk job) | Farmer (requires walking on uneven terrain) |
| Disability | Same - cannot walk without prosthesis | Same |
| Handicap | MINIMAL - can perform job with prosthesis, earnings unaffected | SEVERE - cannot farm, loses livelihood, family faces hunger |
This illustrates that handicap is NOT determined by disability alone - it depends on social roles, environmental demands, and available support. A wheelchair user with disability is NOT handicapped in a city with ramp access and accessible public transport - but IS severely handicapped in a city with no accessibility.
Modern perspective: WHO's ICF (International Classification of Functioning, Disability and Health, 2001) replaced ICIDH and uses a more positive framework: Body Functions/Structures → Activity → Participation, with contextual factors (personal + environmental) modulating the impact - recognizing that reducing handicap requires changing the environment, not just treating the individual.
D5. Primary Prevention is the Best Strategy for Non-Communicable Diseases
Justification:
1. NCDs have a prolonged, modifiable natural history
NCDs (CVD, diabetes, COPD, cancer) develop over decades with identifiable risk factors long before clinical disease. The prepathogenesis phase is long - providing a large window for primary prevention.
2. NCDs are not curable in the traditional sense
Unlike communicable diseases (which can be cured with antibiotics), NCDs involve permanent structural changes (atherosclerosis, fibrosis, malignant transformation). Secondary and tertiary prevention manage but do not cure. Prevention is therefore more impactful.
3. Risk factors are known, prevalent, and modifiable
The major NCD risk factors (tobacco use, physical inactivity, unhealthy diet, harmful alcohol use) are:
- Well-established (causal, not just associated)
- Highly prevalent in the population
- Modifiable through individual and population-level interventions
4. Population attributable risk is high
Tobacco causes >80% of lung cancers. Eliminating tobacco use (primary prevention) would prevent >80% of lung cancer cases - no secondary or tertiary intervention comes close to this impact.
5. Cost-effectiveness
WHO estimates that every $1 invested in tobacco control returns $7 in productivity gains. Primary prevention of NCDs through basic interventions (tobacco cessation, salt reduction, physical activity promotion) is among the most cost-effective interventions in global health.
6. "Best Buy" interventions (WHO)
WHO's "best buys" for NCDs are overwhelmingly primary preventive: tobacco taxes, alcohol policies, salt reduction in food industry, healthy diet promotion, physical activity campaigns, HPV and HBV vaccination (preventing cancer).
7. Limitations of treatment
- Antihypertensives control but do not reverse target organ damage
- Chemotherapy has significant toxicity and limited efficacy for many cancers
- Dialysis and transplants for diabetic nephropathy are expensive and scarce in LMICs
8. India context (National Programme)
NPCDCS and now National NCD Mission focuses heavily on primary prevention: school health programs, community-level awareness, regulation of tobacco and alcohol, promotion of healthy diets.
Conclusion: While secondary and tertiary prevention have their place (the iceberg phenomenon demands early detection; tertiary care is essential), the sheer scale of NCD burden, the modifiability of risk factors, and the cost-effectiveness of preventive interventions make primary (and primordial) prevention the cornerstone strategy for NCDs.
D6. Identifying the Weakest Point in the Chain of Transmission - Rabies and COVID-19
Principle: The chain of infection consists of: Infectious agent → Reservoir → Portal of exit → Mode of transmission → Portal of entry → Susceptible host. Effective disease prevention requires identifying and breaking the weakest link - the point most vulnerable to intervention. (This is central to epidemiological thinking - analogous to the "web of causation" concept where removing one critical link can interrupt disease.)
RABIES - Weakest Point: Reservoir (Animal Reservoir)
The chain for rabies:
Rabies virus → Dog (reservoir) → Bite (portal of exit + mode of transmission) → Skin wound (portal of entry) → Susceptible human
Weakest link = Reservoir (stray dog population)
- Why: Stray dogs are the source of >95% of human rabies cases in India
- Intervention at reservoir: Animal Birth Control (ABC) programme + mass dog vaccination (rabies vaccine to >70% of dog population achieves herd immunity and breaks transmission)
- Why this is strongest intervention: Eliminates the source completely rather than just protecting individual humans
- Example: Bhutan achieved near-zero human rabies by systematically vaccinating dogs - before widespread human vaccination
Other interventions along the chain:
- Portal of exit/transmission: Responsible pet ownership, leash laws
- Portal of entry/host: Post-exposure prophylaxis (PEP) - vaccine + RIG after bite (secondary prevention, not primary); Pre-exposure prophylaxis for veterinarians (primary protection of susceptible host)
Conclusion for rabies: Animal reservoir control is the mainstay - though post-exposure prophylaxis is also critical because rabies is 100% fatal once symptoms develop.
COVID-19 - Weakest Point: Mode of Transmission
The chain for COVID-19:
SARS-CoV-2 → Human cases/pre-symptomatic carriers → Respiratory droplets/aerosols → Upper respiratory tract → Susceptible human
Weakest link = Mode of Transmission (droplets/aerosols)
- Why: SARS-CoV-2 has no animal reservoir that drives ongoing human transmission (unlike rabies); the virus spreads primarily person-to-person via respiratory droplets
- Interventions at mode of transmission:
- Physical distancing (≥1 meter) - reduces droplet contact
- Masking (especially N95) - reduces aerosol transmission
- Ventilation - reduces aerosol concentration indoors
- Isolation of cases - removes infectious source
- Contact tracing and quarantine - breaks transmission chains
Other interventions:
- Susceptible host: Vaccination (primary prevention - most powerful intervention at host level)
- Portal of entry: Hand hygiene, PPE for healthcare workers
Why breaking transmission was the mainstay initially: Before vaccines were available, non-pharmaceutical interventions (NPIs) targeting transmission (lockdowns, masks, distancing) were the ONLY available tools. Even post-vaccination, breakthrough infections made NPIs necessary.
Key lesson: Both examples demonstrate that the epidemiological approach - mapping the entire chain and identifying the most vulnerable/accessible link - is more effective than blanket responses. For rabies: attack the reservoir. For COVID-19: attack transmission.
D7. Life Expectancy is One of the Best Indicators of a Country's Level of Development
Life Expectancy at Birth (e°): The average number of years a newborn infant would live if prevailing patterns of mortality at the time of birth were to apply throughout its life.
Why it is one of the best development indicators:
1. Composite of all-cause mortality
Life expectancy summarizes mortality from all causes across all ages in one number. It reflects the net effect of all health, social, economic, and environmental conditions on mortality.
2. Strong correlation with development
| Country | Life Expectancy (2022) | Development Status |
|---|
| Japan | 84 years | Highly developed |
| India | 70 years | Developing |
| Sub-Saharan Africa avg | ~60 years | Low-income |
| Sierra Leone | 54 years | Least developed |
Countries with high life expectancy invariably have: better nutrition, cleaner water, better healthcare, higher income, lower infant mortality, better education - all markers of development.
3. Reflects MCH success
A major driver of life expectancy is infant and child mortality. Reducing under-5 deaths (through immunization, nutrition, safe water) dramatically increases population-level life expectancy.
4. Captures both communicable and NCD burden
Unlike disease-specific rates, life expectancy captures total burden - the epidemiological transition from CDs to NCDs is visible in changing life expectancy trends.
5. Used in key composite development indices:
- Human Development Index (HDI) - uses life expectancy as one of three components (alongside education and income) - UNDP
- Physical Quality of Life Index (PQLI) - uses life expectancy + IMR + literacy
- These are standard tools for international development comparisons
6. Sensitive to equity
Gender gap in life expectancy (women live longer universally) and urban-rural gaps within countries reveal health inequalities.
Limitation: Life expectancy at birth is heavily influenced by IMR; it does not capture quality of years lived (hence DFLE and DALY are also needed). A country may have high life expectancy but high years lived with disability.
India's life expectancy trend: ~32 years (1947) → 70 years (2022) - reflecting 60+ years of health system development, immunization programs, and nutritional improvement.
D8 & D10. Growth Monitoring and Nutritional Surveillance are not the Same
(Same concept asked in D8 and D10 - combined)
| Feature | Growth Monitoring | Nutritional Surveillance |
|---|
| Definition | "The regular measurement of growth (weight, height) of individual children and the interpretation and use of these measurements for appropriate action" | "The continuous monitoring of the nutritional status of a population so as to make decisions which will lead to improvements in nutrition" (WHO/FAO) |
| Level | Individual child | Population/community |
| Purpose | Early detection of growth faltering in an individual child; trigger clinical/community action for that child | Policy-making, programme planning, early warning of food crises, monitoring of nutrition programmes at population level |
| Who does it | ANM, ASHA, AWW at the level of Anganwadi / subcentre | Nutritionists, epidemiologists, policymakers at state/national level |
| How | Monthly weighing, plotting on Road to Health card (weight-for-age chart), MUAC measurement | NNMB surveys, ICMR nutrition surveys, NFHS data analysis, HMIS data aggregation |
| Action | Individual-level: refer to AWC/PHC, counsel mother, provide supplementary nutrition | Population-level: policy changes, targeted food security programs, supplementary feeding schemes, fortification policies |
| Time | Periodic (monthly) at individual level | Continuous collection, periodic analysis and reporting |
| Example | An AWW weighs a 9-month-old child, finds weight below -3 SD, refers to PHC as SAM | NNMB survey reports 35% of under-5 children are stunted in Odisha → POSHAN Abhiyaan intensified |
In summary: Growth monitoring is the tool (measurement of individual children); nutritional surveillance is the system (continuous monitoring at population level for policy and programme response). Growth monitoring data from thousands of children can feed into nutritional surveillance, but they are not the same.
D9. Primordial Prevention is More Appropriately Used in Non-Communicable Diseases
Primordial prevention (Strasser, 1978): Prevention of the emergence or development of risk factors in countries or population groups in which they have not yet appeared.
Why it is MORE applicable to NCDs than communicable diseases:
1. Risk factors for NCDs are behavioural and environmental - preventable before they emerge
NCD risk factors (tobacco use, unhealthy diet, physical inactivity, alcohol, obesity) develop over time with changing lifestyles. These can be prevented from emerging in the first place - especially in children during formative years.
2. Long latency of NCDs allows early life intervention
Since NCDs take decades to develop, preventing risk factor acquisition in childhood (through education, healthy school environments, regulation of junk food advertising to children) prevents the risk factor, which in turn prevents the disease. India is currently in an epidemiological transition - many rural populations have not yet adopted high-salt/high-fat diets or tobacco use - primordial prevention can keep them that way.
3. For communicable diseases, primary prevention (specific protection) is more direct
For infections, immunization (primary prevention) is available for most priority diseases. There is no equivalent "risk factor prevention phase" - exposure to a pathogen is a binary event. One does not need to prevent "risk factors for TB exposure" - one vaccinates (BCG), or ensures adequate ventilation.
4. Reversibility is limited once NCD risk factors are established
Once a person becomes obese, hypertensive, or a long-term smoker, reversal is difficult. The most effective strategy is preventing these risk factors from developing - which is primordial prevention.
5. Population-wide impact
Primordial prevention policies (salt reduction in processed food industry, sugar taxes on beverages, tobacco advertising bans, urban planning for walkability) shift the entire population distribution of risk to the left - reducing risk for everyone, even those not yet identifiably at high risk. This is the population (mass) strategy for NCD prevention.
Examples of primordial prevention for NCDs:
- Banning tobacco sale to minors (prevents tobacco initiation - prevents the risk factor)
- School physical activity programs and healthy canteens (prevents childhood obesity)
- Urban planning with parks and cycling infrastructure (prevents sedentary lifestyle)
- FSSAI regulations reducing trans-fat and salt in packaged foods
- Prohibition of surrogate advertising for alcohol
For communicable diseases - primordial prevention exists (e.g., preventing environmental conditions that favour vector breeding), but is less specific and less distinctly classified as a separate level of prevention compared to NCDs.
D11. Prevalence Rate of <1 in Leprosy Will Not Ensure Elimination - Comment
Context: WHO defined "elimination of leprosy as a public health problem" as reducing the prevalence rate to <1 case per 10,000 population (not per 1000 or per million). India achieved this at the national level by 2005, and the current PR is ~0.67 per 10,000 (as of 2019).
Why achieving PR <1/10,000 does NOT ensure elimination:
1. Prevalence ≠ Incidence
Prevalence rate <1 means current registered cases are low. But new case detection rate (NCDR) reflects ongoing transmission. India's NCDR remains high (~10.5 per 100,000 in 2019) - indicating active ongoing transmission despite low prevalence. New case detection is a more sensitive indicator of true disease burden.
2. Prevalence is influenced by MDT treatment duration
The dramatic fall in prevalence was largely due to the shortening of MDT regimen (from 2-5 years to 12 months for MB, 6 months for PB) - this reduced the registered prevalence numerically but did NOT necessarily reduce transmission proportionately. Cases are registered for shorter periods.
3. Sub-national heterogeneity
While national PR may be <1, many high-endemic districts (in Chhattisgarh, Odisha, Jharkhand, Bihar, Maharashtra) continue to have PR >1 or >2 per 10,000. Aggregate national figures mask local hot-spots of transmission.
4. Hidden reservoir of infection
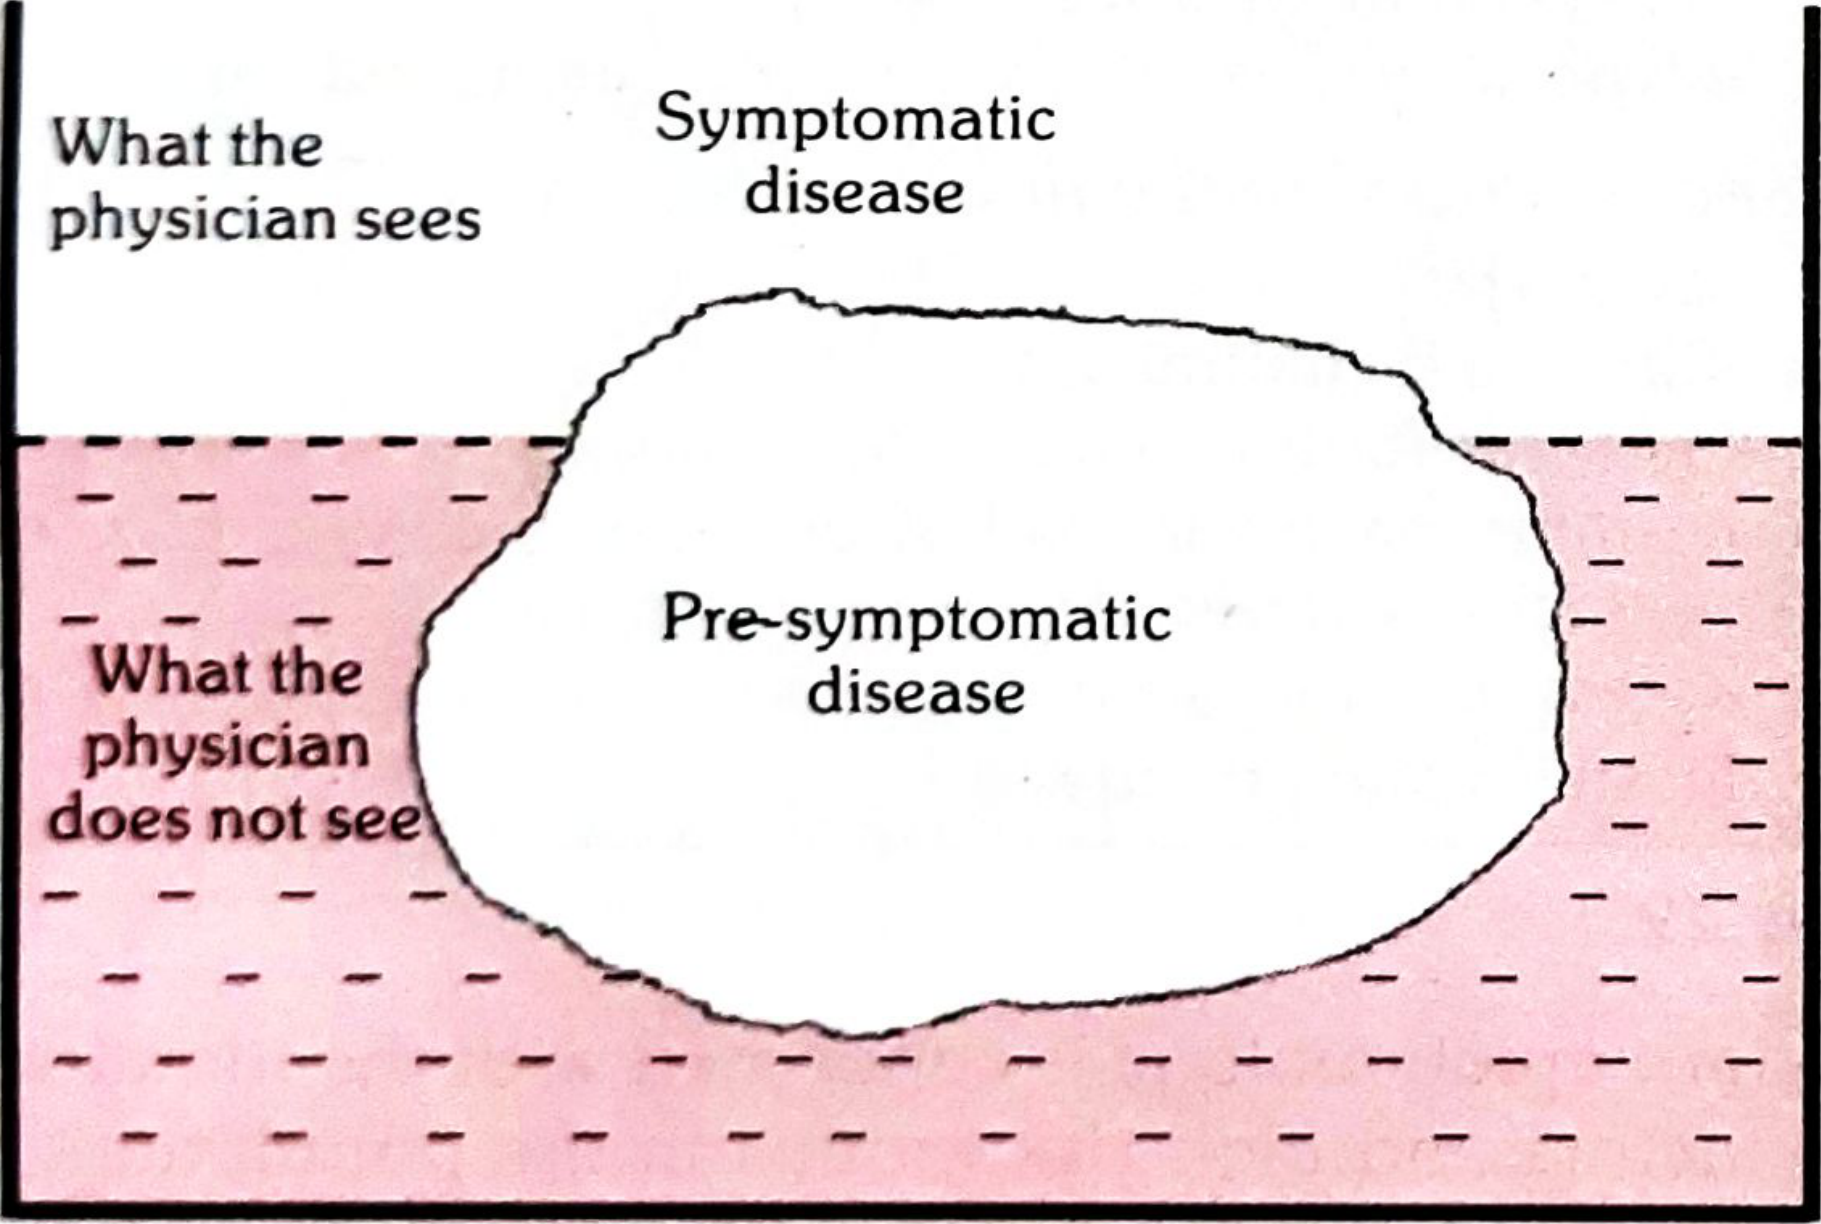
The iceberg phenomenon applies to leprosy - many subclinical/undiagnosed cases exist in the community, especially paucibacillary leprosy in contacts. These constitute an invisible reservoir that sustains transmission.
5. Disability burden persists independently
"Elimination as a public health problem" does not eliminate existing disability (Grade 1 and Grade 2 deformities) already present in the community. Disability rehabilitation and prevention remains a major challenge even after PR <1 is achieved.
6. Child cases and Grade 2 disability rates
High proportion of child cases (7.4% of new cases globally in 2019) indicates ongoing transmission at the community level - children get leprosy only from active cases, revealing continued transmission despite low prevalence.
7. No vaccine and limited chemoprophylaxis
Without a validated, highly effective vaccine and without tools to detect and treat latent infection (as exists for TB), the reservoir cannot be eliminated. Contacts of MB leprosy cases continue to be at risk.
What is needed beyond PR <1:
- Active case detection, contact screening, and post-exposure prophylaxis (single-dose rifampicin for contacts)
- Addressing social determinants (overcrowding, malnutrition)
- Sustained disability prevention and community-based rehabilitation
- Development of leprosy vaccine and rapid diagnostic tools
(Park's Textbook of Preventive and Social Medicine)
D12. Lung Cancer Can Be Controlled by Primary Preventive Measures
YES - Lung cancer is one of the most preventable cancers through primary prevention.
Evidence:
1. Tobacco is the dominant causative agent
- ~85-90% of lung cancer cases are attributable to tobacco smoking (cigarettes, bidis, smokeless tobacco)
- Smokers have 20-30x higher risk of lung cancer vs. non-smokers
- The dose-response relationship is clear - more pack-years = greater risk
- If tobacco were eliminated, lung cancer incidence would fall by >80-85%
2. Other preventable risk factors
- Passive smoking (secondhand smoke): Accounts for ~25% of lung cancer in non-smokers - preventable through smoke-free laws
- Occupational carcinogens: Asbestos (mesothelioma + lung cancer), radon gas, chromium, arsenic, nickel - all preventable through occupational health measures (PPE, engineering controls, substitution)
- Indoor air pollution: Biomass fuel smoke (chulha) in rural India - Ujjwala Yojana (LPG distribution) directly reduces this risk
- Outdoor air pollution: Vehicular and industrial emissions - air quality regulations
3. Primary preventive interventions that work:
- Tobacco control legislation: COTPA (India), pictorial health warnings, high tobacco taxes, ban on advertisements, ban on smoking in public places → proven to reduce smoking prevalence
- WHO MPOWER framework: Monitor, Protect (from smoke), Offer cessation support, Warn, Enforce bans, Raise taxes
- Smoking cessation services: Tobacco cessation clinics in India (iQuit, Tobacco Cessation Centres at medical colleges) - quitting reduces lung cancer risk progressively; after 10 years of cessation, risk is halved
- Radon mitigation: Testing homes in high-radon areas, building codes for ventilation
- Asbestos regulation: India banned chrysotile asbestos in construction (partial ban); complete ban needed
4. Cost-effectiveness
Tobacco taxes are consistently ranked among the most cost-effective health interventions globally. A 10% increase in tobacco price reduces consumption by ~4% in high-income and ~8% in LMICs.
Conclusion: Given that tobacco is responsible for the overwhelming majority of lung cancer cases, and given that tobacco use is a modifiable behaviour amenable to both individual and policy-level interventions, lung cancer is eminently controllable through primary prevention. This makes it a prime example of why primary prevention is the best strategy for NCDs (see D5).
D13. Sentinel Surveillance is Useful for Early Outbreak Detection
Sentinel Surveillance: A method of disease surveillance using selected, strategically placed reporting sites (sentinel sites) - typically specific hospitals, health facilities, or providers - who report cases more completely and quickly than the routine passive notification system.
Why sentinel surveillance aids early outbreak detection:
1. Overcomes limitations of passive surveillance
Routine passive surveillance (e.g., IDSP "S" forms) suffers from under-reporting - not all cases are reported. Sentinel sites are specifically chosen for their completeness and reliability of reporting.
2. Enhanced clinical and laboratory data
Sentinel sites are equipped to provide laboratory-confirmed diagnoses rather than just syndromic data. Example: Sentinel influenza surveillance sites perform virological testing to identify influenza A/H1N1, H3N2, or H5N1 strains - enabling early detection of novel strains with pandemic potential.
3. Detects trends before outbreak becomes apparent
By continuously monitoring at representative sites, rising trends in cases can be identified before the outbreak is widely apparent in the community. Example: A sudden 3-fold increase in cases of acute febrile illness with thrombocytopenia at a dengue sentinel site triggers investigation and vector control before a full outbreak.
4. Representative but feasible
Full population surveillance is impractical. Sentinel sites provide a representative, feasible alternative - selected to cover different geographic areas, populations, and health facility levels.
5. Detects rare/unusual presentations
Sentinel sites for AFP (Acute Flaccid Paralysis) surveillance - even a single AFP case triggers investigation for polio, enabling early detection of any poliovirus reintroduction.
Examples of sentinel surveillance systems:
- IDSP sentinel surveillance: State-level sentinel hospitals report all cases of specific syndromes weekly
- Influenza sentinel surveillance (ICMR/WHO): ~50+ sentinel sites across India (medical colleges + district hospitals) performing virological surveillance for influenza and SARI (Severe Acute Respiratory Illness)
- HIV sentinel surveillance: Annual surveys at ANC and STI clinic sentinel sites to estimate HIV prevalence trends
- Rotavirus sentinel surveillance: Hospital-based sentinel sites for rotavirus gastroenteritis in children <5 years
- Dengue sentinel surveillance: NVBDCP-designated sites
Limitation: Sentinel surveillance is not population-representative unless sites are carefully selected; reporting quality depends on sustained training and motivation.
D14. Disability Limitation and Rehabilitation are Important Components of NLEP
NLEP (National Leprosy Eradication Programme): India's national programme for leprosy control, under the Ministry of Health and Family Welfare. Aims to eliminate leprosy as a public health problem (PR <1/10,000) and achieve zero Grade 2 disability in new cases.
Why Disability Limitation and Rehabilitation are Central to NLEP:
1. Leprosy causes unique, specific disabilities
M. leprae directly attacks peripheral nerves, causing:
- Anaesthesia (loss of sensation in hands, feet, face) → injury goes unnoticed → progressive tissue destruction
- Muscle paralysis: Claw hand (ulnar nerve), foot drop (common peroneal nerve), lagophthalmos (facial nerve)
- Grade 2 deformities: Visible, permanent deformities that cause severe stigma and social exclusion
- Lepra reactions (Type 1 and Type 2): Acute nerve damage during/after MDT - require urgent medical intervention (steroids) to prevent permanent disability
2. Disability persists even after cure
MDT cures the infection (kills M. leprae), but does NOT reverse existing nerve damage or deformity. Patients cured of leprosy may still carry Grade 1 or Grade 2 disabilities for life. Thus disability management is essential even in the post-MDT era.
3. Disability Limitation (Tertiary Prevention) in NLEP:
- POD (Prevention of Disability): Regular examination of hands, feet, and eyes at MDT clinics; early detection and treatment of lepra reactions with steroids; self-care training (patients taught to care for anaesthetic feet/hands - daily inspection, soaking, applying oil, use of footwear)
- Lagophthalmos management: Eye care (lubricating drops, protective glasses, surgical correction - tarsorrhaphy)
- Physiotherapy: Passive and active exercises to prevent contractures; tendon transfer surgeries for claw hand, foot drop
- MCR (Micro Cellular Rubber) footwear: Custom-designed footwear to protect anaesthetic feet from plantar ulcers - provided free under NLEP
4. Rehabilitation in NLEP:
- Medical rehabilitation: Surgical reconstruction - corrective surgeries for claw hand, foot drop, lagophthalmos (performed at District Leprosy Officers and referred centres)
- Social rehabilitation: Integration of leprosy-cured persons into mainstream society; combating stigma through NLEP IEC activities; repeal of anti-leprosy laws (India repealed discriminatory laws in states)
- Economic/Vocational rehabilitation: Under the Sparsh Leprosy Awareness Campaign and collaboration with NGOs (e.g., The Leprosy Mission); skill development and self-help groups for persons affected by leprosy; provision of aids and appliances (crutches, wheelchairs)
- Community-Based Rehabilitation (CBR): Integrating persons with leprosy-related disabilities into mainstream CBR programmes
5. NLEP Indicators for Disability:
- Grade 2 Disability Rate among new cases (should be <1% ideally)
- New cases with Grade 2 disability - WHO monitors this as key indicator
- Reduction in these indicators is a programmatic goal
Conclusion: Since leprosy is both a disease of infection AND a disease of disability, achieving the NLEP goal requires not just detecting and treating cases (MDT) but actively preventing, limiting, and rehabilitating disability. A programme that only administers MDT but neglects disability will leave patients cured of infection but disabled, stigmatized, and economically excluded - defeating the broader goal of elimination.
- Park's Textbook of Preventive and Social Medicine
All answers are based primarily on Park's Textbook of Preventive and Social Medicine (the standard reference for Community Medicine/PSM in India), supplemented by standard WHO definitions and national programme guidelines. These answers are structured for West Bengal MBBS PSM examination format.