
Cardiac cycle with flowchart
A detailed medical flowchart of the cardiac cycle showing all 7 phases in sequence: (1) Atrial Systole, (2) Isovolumetric Ventricular Contraction, (3) Rapid Ventricular Ejection, (4) Reduced Ventricular Ejection, (5) Isovolumetric Ventricular Relaxation, (6) Rapid Ventricular Filling, (7) Reduced Ventricular Filling. Each phase box should list: ECG event, valve positions (open/closed), pressure changes, volume changes, and heart sounds. Use arrows to connect phases in a circular loop. Color-code systole phases in red/orange and diastole phases in blue/purple. Include key values like normal heart rate 72 bpm, systole ~0.3s, diastole ~0.5s. Clean medical education style with white background.
The Cardiac Cycle
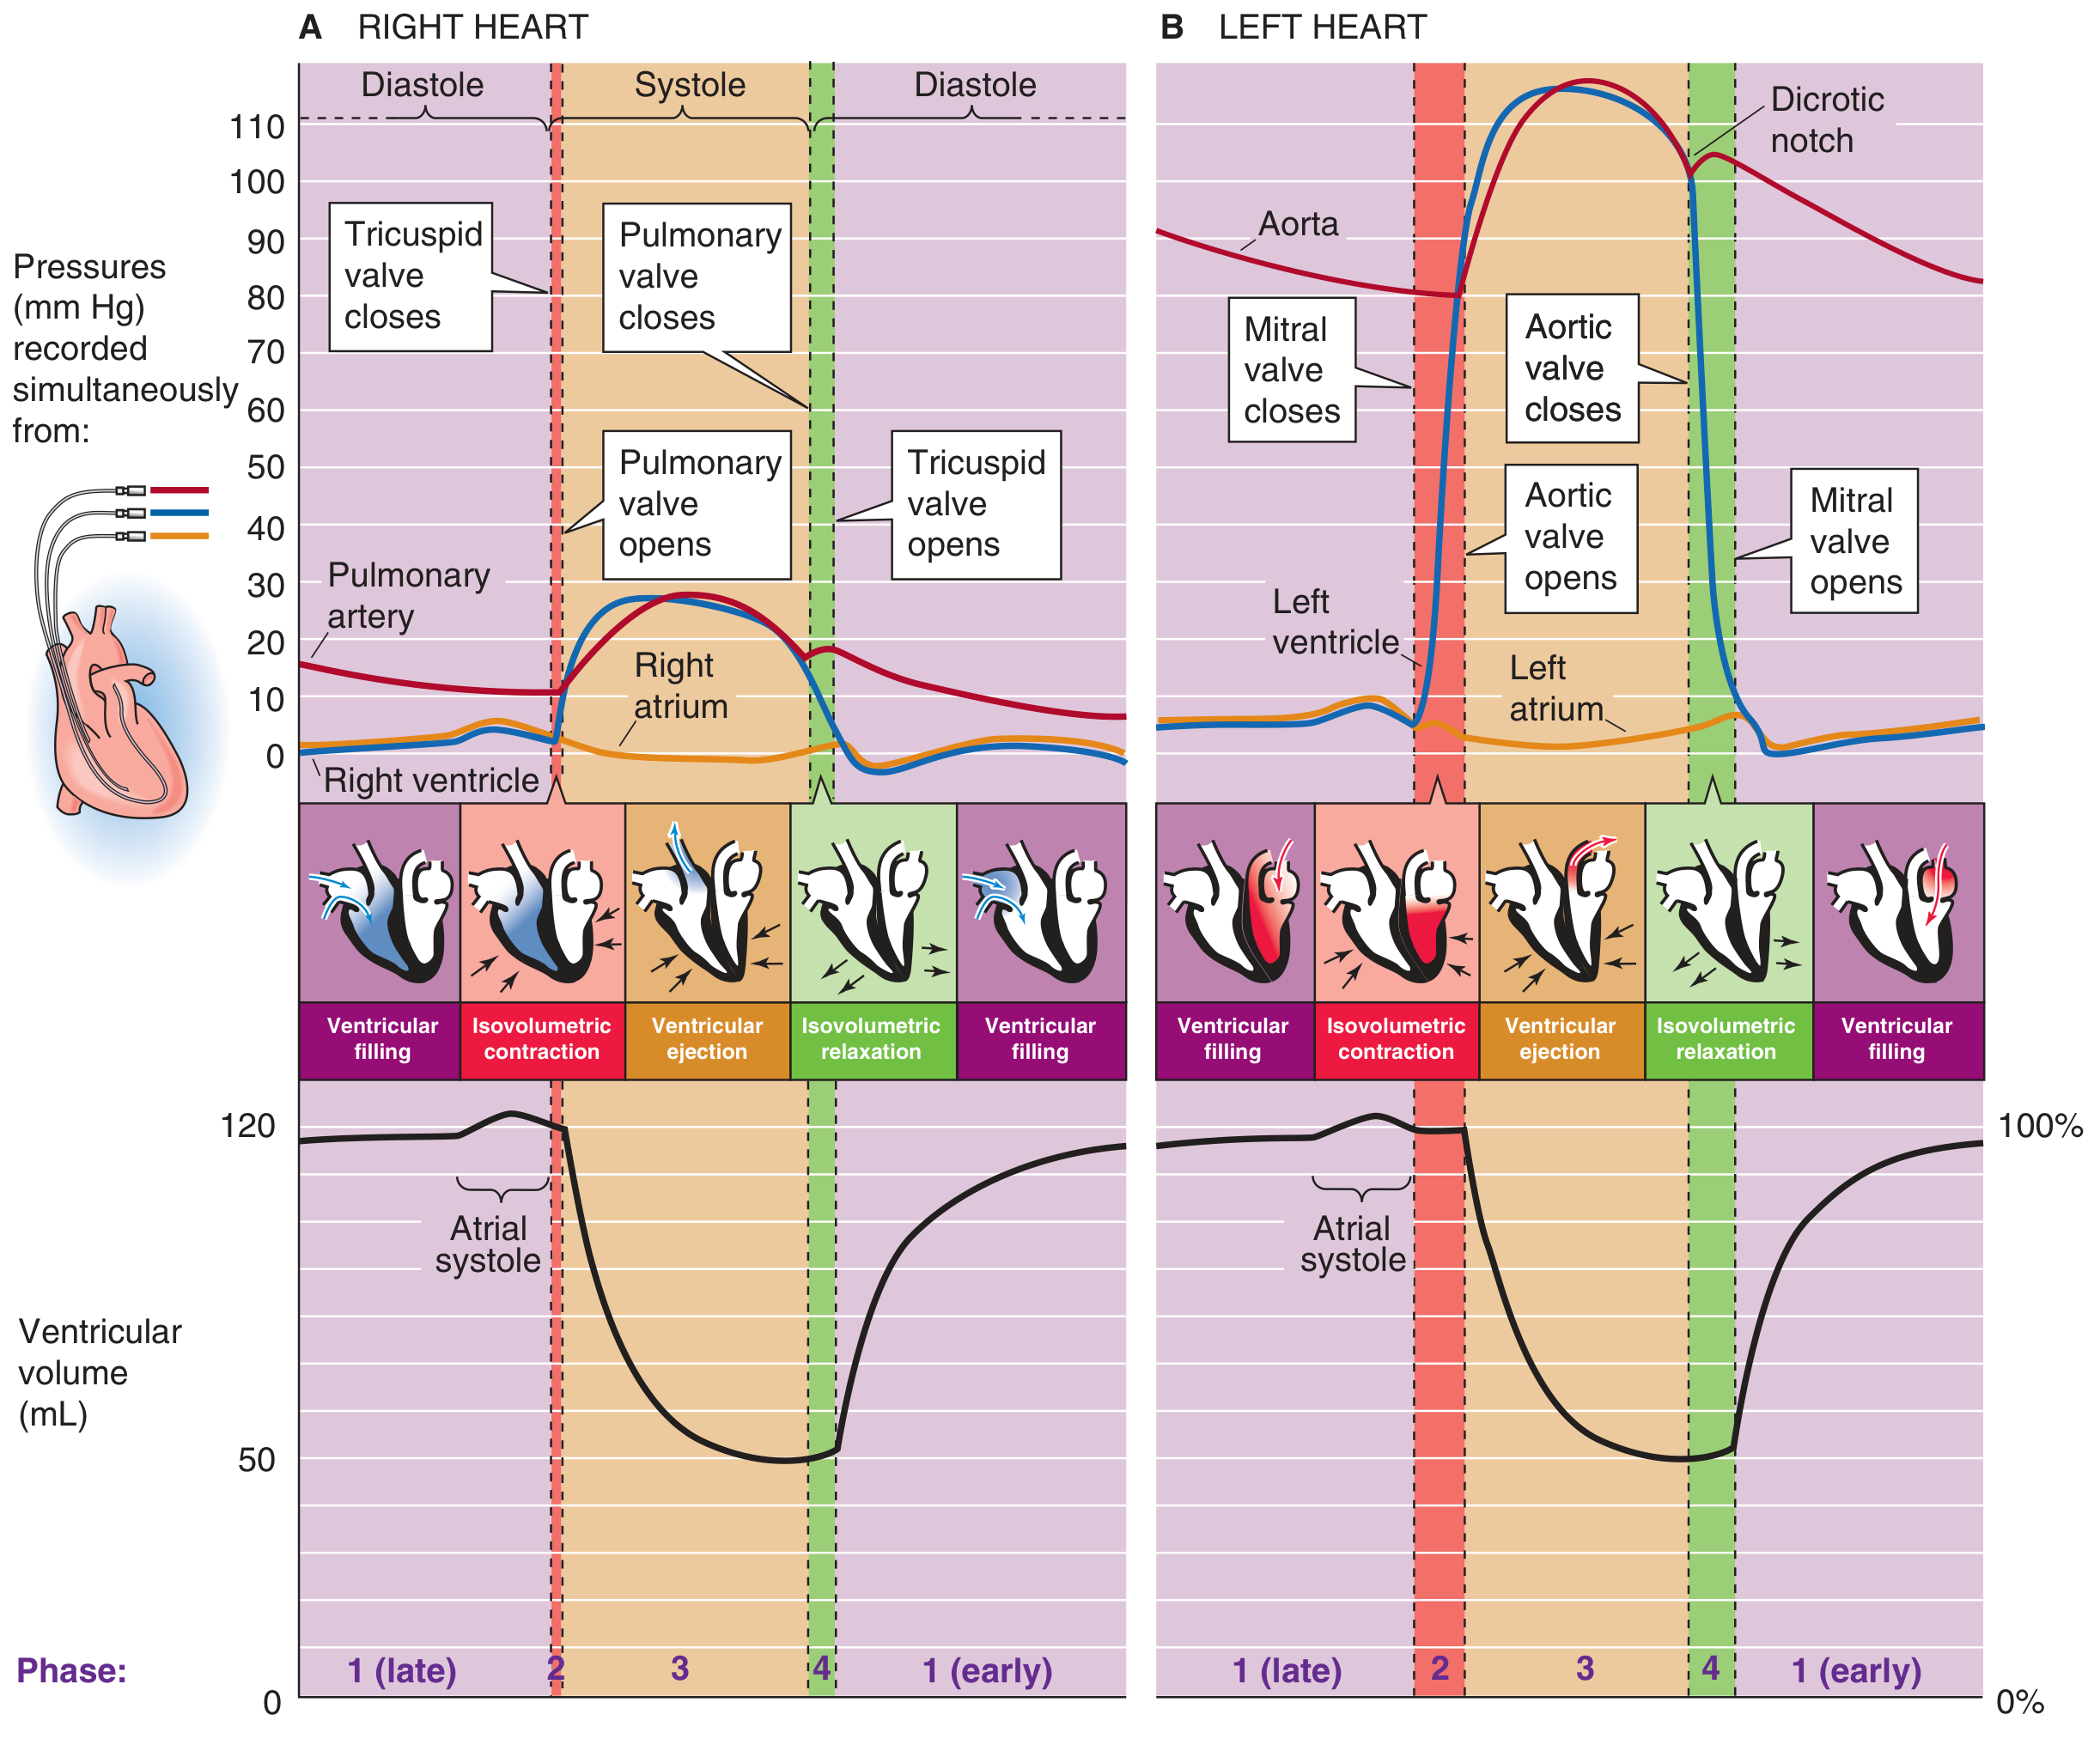
Wiggers Diagram (Pressures and Volumes)
Flowchart
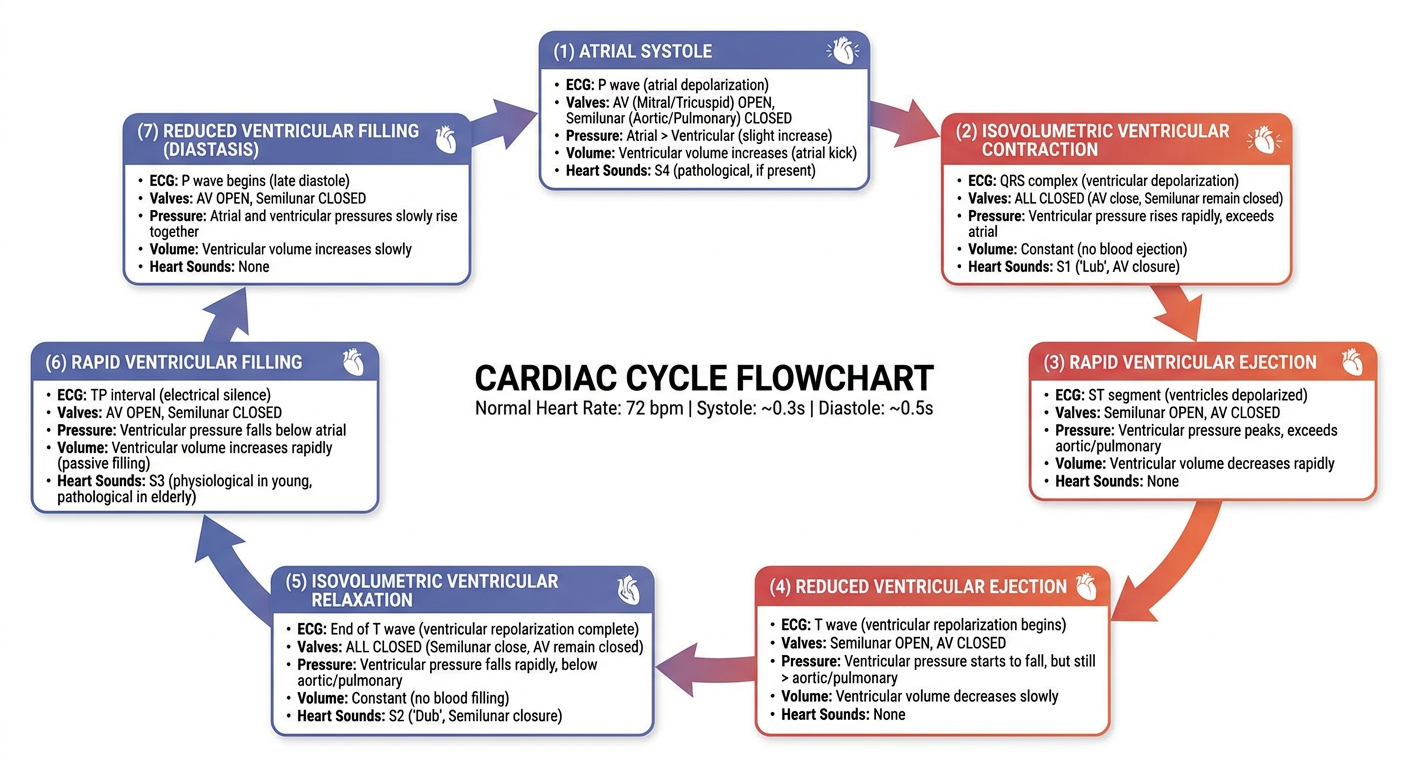
The 7 Phases in Detail
SYSTOLE (3 phases)
Phase A - Atrial Systole
| Parameter | Event |
|---|---|
| ECG | P wave (atrial depolarization) |
| Valves | Mitral/tricuspid OPEN; aortic/pulmonary CLOSED |
| Mechanism | Atria contract → push blood into relaxed ventricles through open AV valves |
| Pressure | Left atrial pressure rises → visible as "a wave" on venous pulse |
| Volume | LV volume increases (final 20-30% of ventricular filling) |
| Heart Sound | S4 (not audible in normal adults; heard in ventricular hypertrophy) |
The ventricle was already filling passively before atrial systole; atrial contraction adds the final "top-up."
Phase B - Isovolumetric Ventricular Contraction (IVC)
| Parameter | Event |
|---|---|
| ECG | QRS complex (ventricular depolarization) |
| Valves | ALL FOUR VALVES CLOSED |
| Mechanism | Ventricles begin contracting → pressure rises rapidly, but no blood leaves yet |
| Pressure | LV pressure rises sharply from ~0 to ~80 mmHg until it exceeds aortic pressure |
| Volume | No change (isovolumetric = constant volume) |
| Heart Sound | S1 - closure of mitral and tricuspid valves |
"Iso" = same; "volumetric" = volume. Volume cannot change because all valves are shut. - Costanzo Physiology 7th Edition
Phase C - Rapid Ventricular Ejection
| Parameter | Event |
|---|---|
| ECG | ST segment |
| Valves | Aortic/pulmonary valves OPEN; mitral/tricuspid CLOSED |
| Mechanism | LV pressure exceeds aortic pressure → aortic valve opens → blood ejected rapidly |
| Pressure | LV and aortic pressure rise together to ~120 mmHg (systolic) |
| Volume | LV volume decreases rapidly (~70 mL ejected) |
| Heart Sound | None |
Phase D - Reduced Ventricular Ejection
| Parameter | Event |
|---|---|
| ECG | T wave (ventricular repolarization) |
| Valves | Aortic/pulmonary STILL OPEN |
| Mechanism | Ejection continues but slows; aortic pressure slightly exceeds LV pressure but forward momentum of blood keeps aortic valve open |
| Pressure | Both LV and aortic pressure begin to fall |
| Volume | LV volume reaches its minimum (end-systolic volume, ESV ~50 mL) |
| Heart Sound | None |
DIASTOLE (3 phases)
Phase E - Isovolumetric Ventricular Relaxation (IVR)
| Parameter | Event |
|---|---|
| ECG | After T wave (isoelectric) |
| Valves | ALL FOUR VALVES CLOSED |
| Mechanism | Retrograde blood flow snaps aortic valve shut → ventricles relax, pressure falls |
| Pressure | LV pressure falls sharply; dicrotic notch appears on aortic pressure tracing (brief rise when aortic valve snaps shut) |
| Volume | No change |
| Heart Sound | S2 - closure of aortic and pulmonary valves |
Phase F - Rapid Ventricular Filling
| Parameter | Event |
|---|---|
| ECG | Isoelectric (between T and next P) |
| Valves | Mitral/tricuspid OPEN; aortic/pulmonary CLOSED |
| Mechanism | LV pressure falls below LA pressure → mitral valve opens → rapid passive filling (accounts for ~70-80% of ventricular filling) |
| Pressure | LV pressure low and constant; blood rushes in passively |
| Volume | LV volume increases rapidly |
| Heart Sound | S3 (not normally audible; heard in volume overload states like heart failure) |
Phase G - Reduced Ventricular Filling (Diastasis)
| Parameter | Event |
|---|---|
| ECG | Isoelectric |
| Valves | Mitral/tricuspid OPEN |
| Mechanism | Passive filling continues but slows as pressure gradient equalizes |
| Pressure | Atrial and ventricular pressures nearly equalized |
| Volume | LV volume continues to rise slowly toward ~120 mL (EDV) |
| Heart Sound | None |
Then the cycle repeats with the next P wave and atrial systole.
Summary Table
| Phase | Valves | ECG | Heart Sound | Volume |
|---|---|---|---|---|
| A Atrial Systole | AV open | P wave | S4 (abnormal) | ↑ LV fills |
| B IVC | All closed | QRS | S1 | Unchanged |
| C Rapid Ejection | Semilunar open | ST segment | - | ↓↓ |
| D Reduced Ejection | Semilunar open | T wave | - | ↓ to ESV |
| E IVR | All closed | Isoelectric | S2 | Unchanged |
| F Rapid Filling | AV open | Isoelectric | S3 (abnormal) | ↑↑ |
| G Reduced Filling (Diastasis) | AV open | Isoelectric | - | ↑ to EDV |
Key Values to Remember
| Parameter | Normal Value |
|---|---|
| Heart rate | 72 beats/min |
| Cycle duration | 0.833 sec |
| Systole | ~0.3 sec (40%) |
| Diastole | ~0.5 sec (60%) |
| End-Diastolic Volume (EDV) | ~120 mL |
| End-Systolic Volume (ESV) | ~50 mL |
| Stroke Volume (SV = EDV - ESV) | ~70 mL |
| Ejection Fraction (EF = SV/EDV) | ~58-65% |
| LV systolic pressure | ~120 mmHg |
| LV diastolic pressure | ~8 mmHg |
| Aortic pressure range | 80-120 mmHg |
Effect of Heart Rate on Cycle Duration
Explain cardiac output and its regulation in a form of an answer
Cardiac Output and Its Regulation
Definition
Formula
| Term | Meaning | Normal Value |
|---|---|---|
| CO | Cardiac Output | ~5 L/min (resting adult) |
| SV | Stroke Volume (volume ejected per beat) | ~70 mL |
| HR | Heart Rate | ~70-72 beats/min |
-
SV = EDV - ESV = 140 - 70 = 70 mL
-
CO = 70 mL × 75 bpm = 5,250 mL/min (~5.25 L/min)
-
Ejection Fraction (EF) = SV / EDV = 70/140 = 0.50 (50%)
-
Costanzo Physiology 7th Edition
Cardiac Index
Regulation of Cardiac Output
A. Regulation of Stroke Volume
1. Preload
"The volume of blood ejected by the ventricle depends on the volume present in the ventricle at the end of diastole."
-
As venous return increases → EDV increases → myocardial fibers stretch → they contract with greater force → SV increases → CO increases
-
This is a direct consequence of the length-tension relationship in cardiac muscle
-
In the physiologic range the relationship is nearly linear; at excessive EDV the curve flattens
-
The Frank-Starling mechanism ensures that cardiac output automatically matches venous return in steady state
-
Costanzo Physiology 7th Edition
| Factor | Effect |
|---|---|
| Increased blood volume (IV fluids, hypervolemia) | ↑ venous return → ↑ EDV |
| Decreased heart rate (more time to fill) | ↑ EDV |
| Venoconstriction | Shifts blood from unstressed to stressed volume → ↑ venous return |
| Supine posture | ↑ venous return from legs |
| Inspiration | ↓ intrathoracic pressure → ↑ venous return |
2. Afterload
-
As afterload increases → ventricle must generate more pressure before ejection can begin → ejection slows → ESV increases → SV decreases → CO falls
-
Cardiac output declines in response to large increases in afterload; modest changes may have no effect on CO
-
The right ventricle (thinner wall) is more sensitive to afterload changes than the left ventricle
-
In heart failure, CO becomes highly sensitive to afterload - hence vasodilators (ACE inhibitors, nitrates) improve CO by reducing SVR
-
Morgan and Mikhail's Clinical Anesthesiology, 7th Edition
3. Contractility (Inotropy)
| Positive Inotropes | Negative Inotropes |
|---|---|
| Sympathetic stimulation (NE/E via β₁) | Hypoxia, acidosis |
| Digoxin | High PCO₂ (intracellular acidosis) |
| Dopamine, dobutamine | Beta-blockers |
| Calcium, glucagon | Most general anesthetics |
| Thyroid hormone | Loss of myocardial mass (MI, ischemia) |
Sympathetic fibers innervate both atrial and ventricular muscle. Norepinephrine enhances contractility primarily via β₁-receptor activation. - Morgan and Mikhail's Clinical Anesthesiology, 7th Edition
B. Regulation of Heart Rate (Chronotropy)
| Mechanism | Effect on HR | Mechanism |
|---|---|---|
| Sympathetic (β₁) stimulation | ↑ HR (tachycardia) | Increases slope of phase 4 depolarization in SA node |
| Parasympathetic (vagal) stimulation | ↓ HR (bradycardia) | Hyperpolarizes SA node; slows phase 4 |
| Increased body temperature | ↑ HR | Speeds SA node firing rate |
| Bainbridge reflex | ↑ HR | Stretch of right atrium → via vagus → sympathetic reflex; 10-15% increase in HR |
| Hypoxia / ↑ PCO₂ | ↑ HR | Chemoreceptor-mediated tachycardia (see below) |
C. Extrinsic Regulatory Mechanisms
1. Autonomic Nervous System
- Sympathetic activation (exercise, stress, hemorrhage): releases norepinephrine → β₁ receptor activation → positive chronotropy (↑ HR) + positive inotropy (↑ contractility) → ↑ CO
- Parasympathetic (vagal) activation (rest, valsalva): releases acetylcholine → negative chronotropy (↓ HR) + mild negative inotropy → ↓ CO
2. Baroreceptor Regulation
-
High-pressure baroreceptors (carotid sinus, aortic arch) sense arterial pressure - not CO directly
-
A fall in BP → baroreceptor firing decreases → sympathetic output increases → HR and SV increase → CO rises
-
Importantly: baroreceptors do not correct changes in CO that occur without a change in MAP (e.g., if CO rises but SVR falls proportionally, MAP is unchanged and baroreceptors do not respond)
-
Medical Physiology (Boron & Boulpaep)
3. Chemoreceptor Regulation
- Peripheral chemoreceptors detect ↓ PO₂, ↑ PCO₂, ↓ pH
- Low CO → low tissue perfusion → ↓ PO₂, ↑ PCO₂ → chemoreceptor stimulation → reflex tachycardia → ↑ CO (a negative-feedback correction)
- Note: high PCO₂ also directly depresses myocardial contractility (via intracellular acidosis reducing troponin C sensitivity to Ca²⁺); the reflex tachycardia counterbalances this direct depressant effect
4. Low-Pressure (Atrial) Baroreceptors
- Located in pulmonary artery, atrial-venous junctions, atria, and ventricles
- Detect "fullness" of the circulation (venous return)
- When activated by increased venous pressure → trigger Bainbridge reflex: tachycardia + renal vasodilation + diuresis (to reduce volume load)
5. Local Metabolic Autoregulation
"The venous return to the heart is the sum of all the local blood flows through all the individual tissue segments." - Guyton and Hall Textbook of Medical Physiology
- Tissues with increased metabolic demand (e.g., exercising muscle) release vasodilatory metabolites (CO₂, adenosine, H⁺, K⁺, lactic acid) → local arteriolar dilation → ↑ local blood flow → ↑ venous return → Frank-Starling raises CO
- This is why CO can rise from 5 L/min at rest to 20-25 L/min during strenuous exercise in trained athletes
6. Hormonal Regulation
| Hormone | Effect on CO | Mechanism |
|---|---|---|
| Epinephrine (adrenal medulla) | ↑ | β₁ inotropy + chronotropy |
| Thyroid hormone (T₃/T₄) | ↑ | Increases myosin ATPase activity; enhances β-receptor sensitivity |
| Glucagon | ↑ | cAMP-mediated positive inotropy |
| Atrial Natriuretic Peptide (ANP) | ↓ indirect | Reduces preload via diuresis/vasodilation |
| Angiotensin II | ↑ indirect | Vasoconstriction → ↑ venous return; also increases aldosterone → ↑ blood volume |
Summary - Determinants of Cardiac Output
CARDIAC OUTPUT = STROKE VOLUME × HEART RATE
                      |
          ____________|____________
         |            |            |
      PRELOAD      AFTERLOAD   CONTRACTILITY
         |            |            |
    Frank-Starling  SVR/MAP    Sympathetic/Ca²+
    Venous return   Aortic     Catecholamines
    Blood volume    impedance  Inotropic drugs
Key Normal Values
| Parameter | Normal Resting Value |
|---|---|
| Cardiac Output | ~5 L/min |
| Cardiac Index | ~3 L/min/m² |
| Stroke Volume | ~70 mL |
| Heart Rate | 72 beats/min |
| Ejection Fraction | 55-70% |
| SVR | 800-1200 dyn·s·cm⁻⁵ |
| CO in maximal exercise | 20-25 L/min |
What is svr
Systemic Vascular Resistance (SVR)
Definition
Formula
| Variable | Meaning | Normal Value |
|---|---|---|
| MAP | Mean Arterial Pressure | ~93 mmHg |
| RAP | Right Atrial Pressure (central venous pressure) | ~2-6 mmHg |
| CO | Cardiac Output | ~5 L/min |
| 80 | Conversion factor (Wood units → dyn·s·cm⁻⁵) | - |
Worked Example
- Harrison's Principles of Internal Medicine 22E
SVR Index (SVRI)
What Determines SVR?
- Arteriolar diameter - the most important factor (resistance ∝ 1/r⁴ by Poiseuille's Law)
- Vessel length
- Blood viscosity (e.g., rises with polycythemia, falls with anemia)
- Number of parallel vessels (more vessels = lower total resistance)
Factors That Change SVR
| Increase SVR (↑) | Decrease SVR (↓) |
|---|---|
| Sympathetic stimulation / catecholamines | Vasodilators (nitroprusside, nitroglycerin) |
| Vasopressin / angiotensin II | Sepsis / anaphylaxis |
| Hypothermia | Exercise (active muscle vasodilation) |
| Hypovolemia (compensatory vasoconstriction) | Pregnancy (↓ by ~20-30%) |
| α₁-agonists (phenylephrine, norepinephrine) | Liver cirrhosis (hyperdynamic circulation) |
| Pain / anxiety | ACE inhibitors / ARBs |
SVR vs. CO Relationship
- If CO falls (e.g., heart failure) → SVR rises compensatorily to maintain MAP
- If SVR falls (e.g., septic shock) → CO must rise to maintain MAP
- This is why septic shock presents with low SVR + high CO (hyperdynamic state), while cardiogenic shock presents with high SVR + low CO
Limitations of SVR as Afterload
- Arterial wall compliance and elasticity
- Pulsatile (frequency-dependent) nature of blood flow
- Arterial wave reflection
- Blood viscosity and density
- These factors become especially important in elderly patients or those with atherosclerosis, where pulsatile load on the LV is significant even if SVR is "normal"
Pulmonary Vascular Resistance (PVR) - Comparison
| SVR | PVR | |
|---|---|---|
| Normal value | 800-1200 dyn·s·cm⁻⁵ | 50-150 dyn·s·cm⁻⁵ |
| Ventricle affected | Left | Right |
| Driving pressure | MAP - RAP | MPAP - PCWP |
Explain blood pressure and its determinants Also explain the regulation if blood pressure
Blood Pressure - Definition, Determinants, and Regulation
Definition
Types of Arterial Blood Pressure
| Type | Definition | Normal Value |
|---|---|---|
| Systolic BP (SBP) | Peak pressure during ventricular ejection | <120 mmHg |
| Diastolic BP (DBP) | Lowest pressure during diastolic relaxation | <80 mmHg |
| Pulse Pressure (PP) | SBP - DBP | ~40 mmHg |
| Mean Arterial Pressure (MAP) | Time-weighted average across a cycle | 70-100 mmHg |
MAP Formula
The Fundamental Equation of Blood Pressure
Blood pressure is the product of Cardiac Output and Systemic Vascular Resistance. All determinants of BP ultimately act through one or both of these two variables.
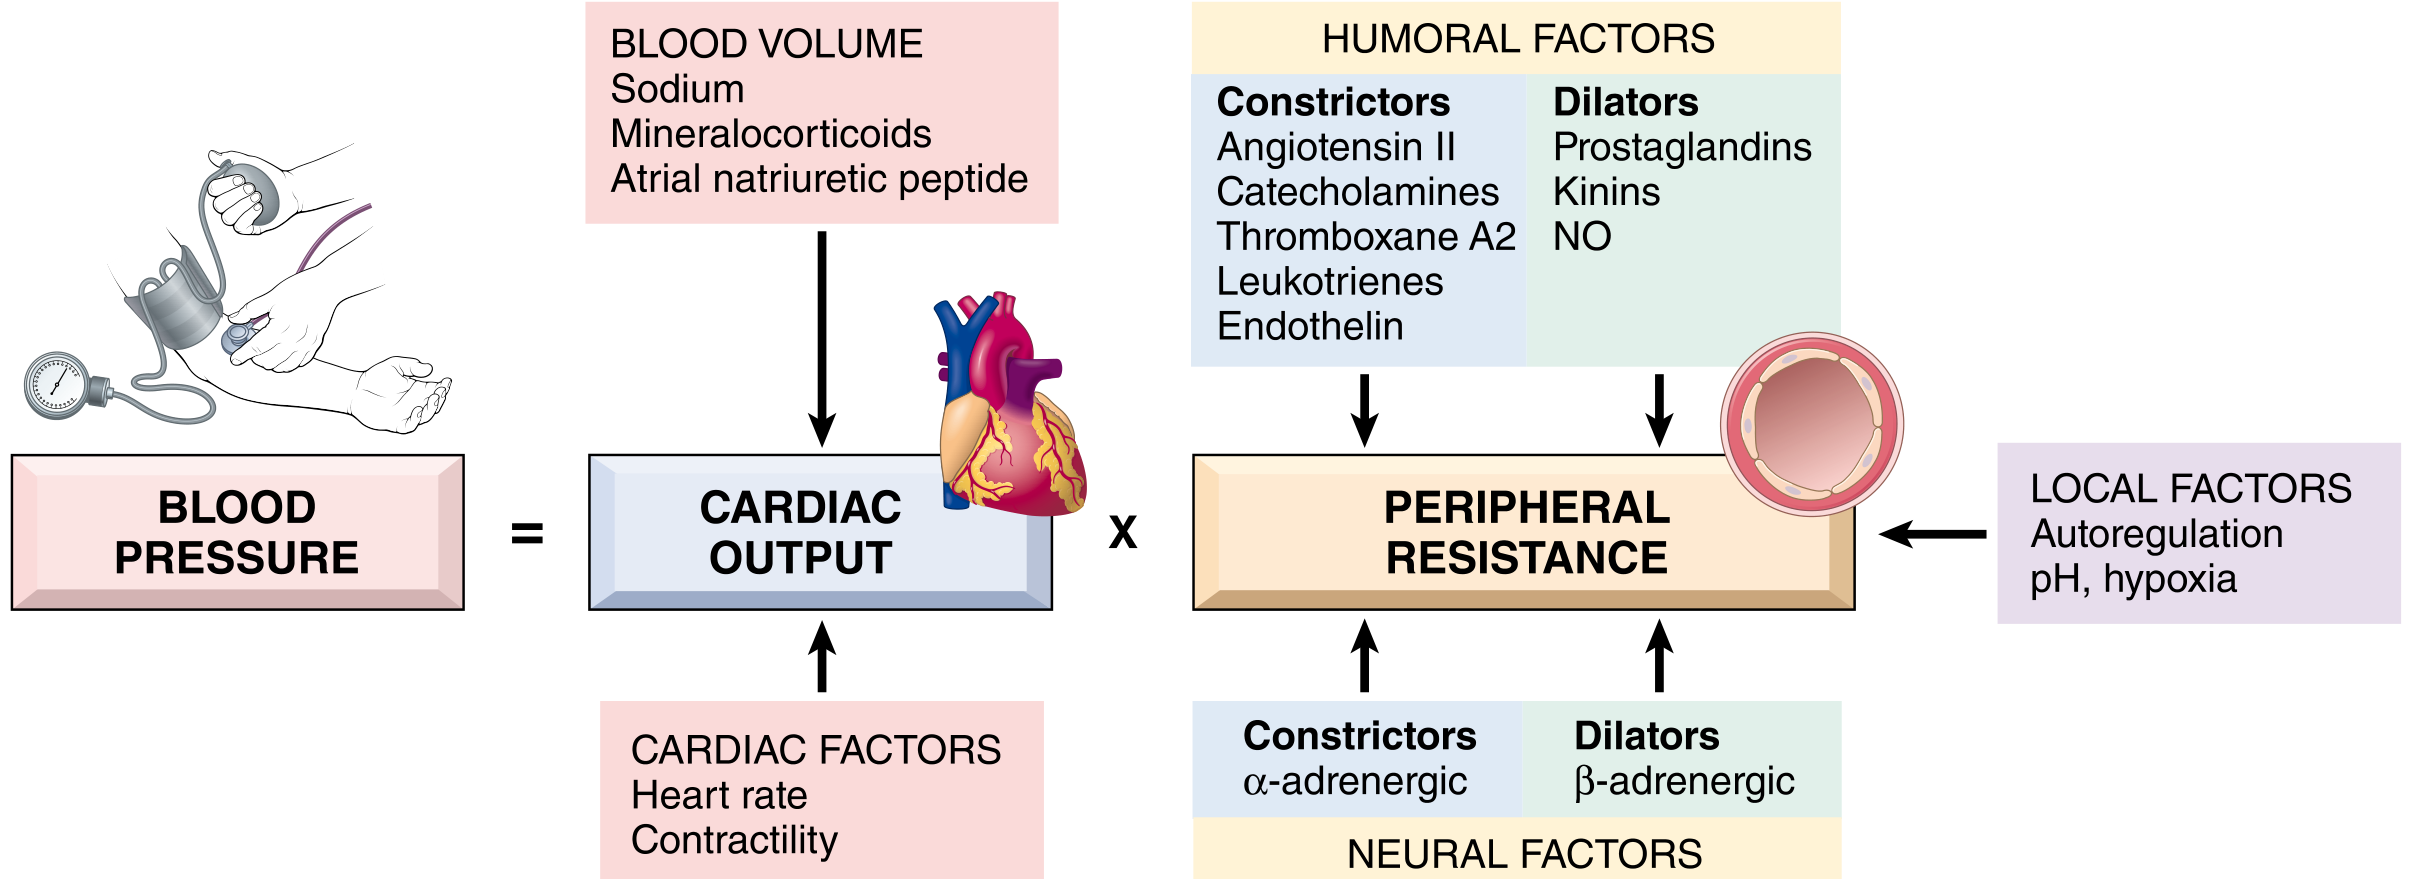
Determinants of Blood Pressure
I. Cardiac Output (CO)
A. Heart Rate
- Controlled by the autonomic nervous system
- Sympathetic (β₁) → ↑ HR
- Parasympathetic (vagal) → ↓ HR
B. Stroke Volume - determined by three factors:
| Factor | Description | Increases SV when... |
|---|---|---|
| Preload (EDV) | Ventricular filling at end-diastole | Blood volume ↑, venous return ↑ |
| Contractility | Intrinsic force of myocardial contraction | Sympathetic stimulation, catecholamines |
| Afterload (SVR) | Resistance the ventricle pumps against | ↑ Afterload → ↓ SV |
C. Blood Volume
- The most important determinant of stroke volume is filling pressure, which is regulated by sodium homeostasis
- Sodium balance controls water retention → blood volume → venous return → EDV → SV
- Regulated mainly by renal sodium excretion/resorption via aldosterone and ANP - Robbins, Cotran & Kumar Pathologic Basis of Disease
II. Systemic Vascular Resistance (SVR / Peripheral Resistance)
- Regulated predominantly at the level of arterioles by neural and hormonal inputs
- Vascular tone = balance between vasoconstrictors and vasodilators
| Vasoconstrictors | Vasodilators |
|---|---|
| Angiotensin II | Prostaglandins (PGI₂) |
| Catecholamines (α₁ effect) | Kinins (bradykinin) |
| Endothelin | Nitric Oxide (NO) |
| Thromboxane A₂ | β-adrenergic stimulation |
| Leukotrienes | Tissue hypoxia / low pH |
Regulation of Blood Pressure
SHORT-TERM REGULATION (Seconds - Minutes)
1. Baroreceptor Reflex (Most Important Rapid Mechanism)
- Location: Carotid sinus (CN IX) and aortic arch (CN X)
- Mechanism: Stretch-sensitive mechanoreceptors that fire in proportion to arterial pressure
- Pathway: Baroreceptors → Nucleus of the Tractus Solitarius (NTS) in medulla → vasomotor center
| BP Change | Baroreceptor Firing | Sympathetic Outflow | Parasympathetic | Net Effect |
|---|---|---|---|---|
| ↑ BP | ↑ Firing | ↓ (inhibited) | ↑ (activated) | ↓ HR, vasodilation → BP falls back |
| ↓ BP | ↓ Firing | ↑ (activated) | ↓ (inhibited) | ↑ HR, ↑ contractility, vasoconstriction → BP rises |
- Allows rapid adjustment to postural changes (standing up), hemorrhage, and exercise
- In chronic hypertension, the baroreceptor reflex is "reset" to maintain the elevated pressure rather than correct it - Ganong's Review of Medical Physiology, 26th Edition
2. Chemoreceptor Reflex
- Peripheral chemoreceptors (carotid/aortic bodies) detect ↓ PO₂, ↑ PCO₂, ↓ pH
- Hypoxia/hypercapnia → sympathetic activation → ↑ HR, vasoconstriction → ↑ BP
3. CNS Ischemic Response (Cushing Reflex)
- When cerebral perfusion pressure falls critically → massive sympathetic discharge → ↑↑ BP
- A last-resort emergency mechanism
INTERMEDIATE REGULATION (Minutes - Hours)
4. Renin-Angiotensin-Aldosterone System (RAAS)
Low BP / Low Na⁺ / ↑ Catecholamines
              ↓
    Juxtaglomerular cells (kidney)
              ↓ release
            RENIN
              ↓ cleaves
       Angiotensinogen (liver)
              ↓
        Angiotensin I
              ↓ ACE (lung endothelium)
        Angiotensin II
         /          \
Vasoconstriction    Adrenal cortex
 (↑ SVR → ↑ BP)         ↓
                   ALDOSTERONE
                        ↓
              ↑ Na⁺ reabsorption (kidney)
                        ↓
              ↑ Blood volume → ↑ CO → ↑ BP
LONG-TERM REGULATION (Hours - Days)
5. Renal Pressure-Diuresis / Natriuresis (Most Important Long-term Mechanism)
"The kidney is the ultimate long-term regulator of blood pressure." - Guyton and Hall Textbook of Medical Physiology
- When BP ↑ → kidneys excrete more Na⁺ and water (pressure diuresis/natriuresis) → ↓ blood volume → ↓ CO → BP returns to normal
- When BP ↓ → kidneys retain Na⁺ and water → ↑ blood volume → ↑ CO → BP rises
- This mechanism has infinite gain over the long term - no other mechanism can permanently change BP without also altering the renal set-point
6. Atrial Natriuretic Peptide (ANP) and BNP
- Released from atrial myocardium (ANP) and ventricular myocardium (BNP) in response to volume overload
- Lower BP by:
- Systemic vasodilation (↓ SVR)
- Inhibiting Na⁺ reabsorption in distal renal tubules → natriuresis and diuresis (↓ blood volume)
- Antagonizing RAAS and sympathetic activity
- Elevated ANP/BNP = hypervolemia, most commonly seen in congestive heart failure - Robbins, Cotran & Kumar Pathologic Basis of Disease
7. Vascular Autoregulation (Local)
- Tissues regulate their own blood flow to match metabolic demand
- Increased blood flow → myogenic vasoconstriction (Bayliss effect) → protects against hyperperfusion
- Metabolic signals (↓ pH, ↑ CO₂, ↑ adenosine, ↓ O₂) → local vasodilation → ↓ local SVR
Summary Table
| Mechanism | Speed | Acts Via | Raises or Lowers BP |
|---|---|---|---|
| Baroreceptor reflex | Seconds | ANS → HR, SVR | Both (negative feedback) |
| Chemoreceptor reflex | Seconds | ANS → HR, SVR | ↑ BP |
| Cushing reflex | Seconds | Massive sympathetic | ↑↑ BP |
| RAAS | Minutes-hours | Ang II, Aldosterone | ↑ BP |
| Renal pressure diuresis | Hours-days | Na⁺/water excretion | Both (long-term control) |
| ANP/BNP | Hours | Vasodilation + diuresis | ↓ BP |
| Local autoregulation | Seconds-minutes | Arteriolar tone | Local only |
Key Takeaway
- Short-term: Baroreceptors and the autonomic nervous system provide rapid second-to-second adjustments
- Medium-term: RAAS adjusts blood volume and vascular tone over minutes to hours
- Long-term: The kidneys (pressure diuresis) are the ultimate arbiters of chronic blood pressure, setting the equilibrium point that all other mechanisms revolve around