
Explain renal circulation
renal circulation blood flow kidney diagram
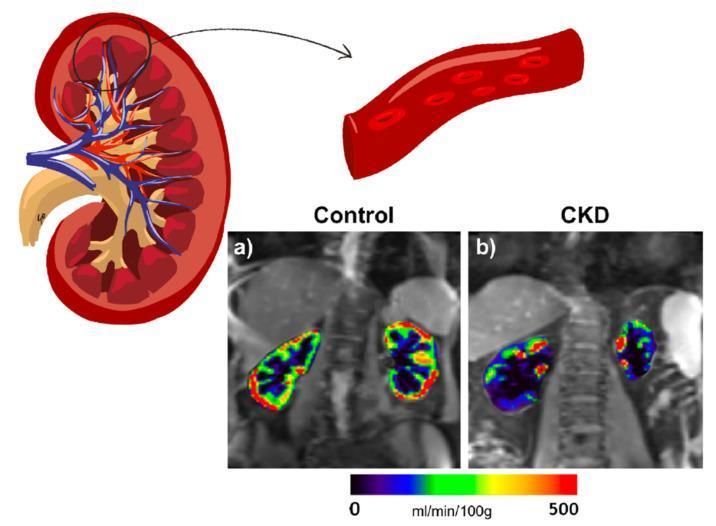
This educational image combines anatomical illustrations and diagnostic MRI imaging to demonstrate Renal Blood Flow (RBF). The upper section contains a sagittal anatomical diagram of a kidney showing cortical and medullary structures, and an inset illustrating arterial blood flow with red blood cells. The lower section presents two diagnostic images utilizing Arterial Spin Labeling (ASL) MRI to map perfusion. Panel (a) shows a 66-year-old healthy control, exhibiting robust, symmetrical RBF indicated by a warm color palette (green, yellow, red) ranging toward 500 mL/min/100g. Panel (b) depicts a 76-year-old patient with diabetes and Chronic Kidney Disease (CKD), showing significantly reduced perfusion. The CKD patient's kidneys exhibit a cooler color distribution (deep blue and purple), indicating lower RBF values closer to 0 mL/min/100g. Both maps are overlaid on M0 reference images, highlighting the clinical utility of non-invasive MRI techniques in assessing microvascular alterations and disease progression in diabetic kidney disease.
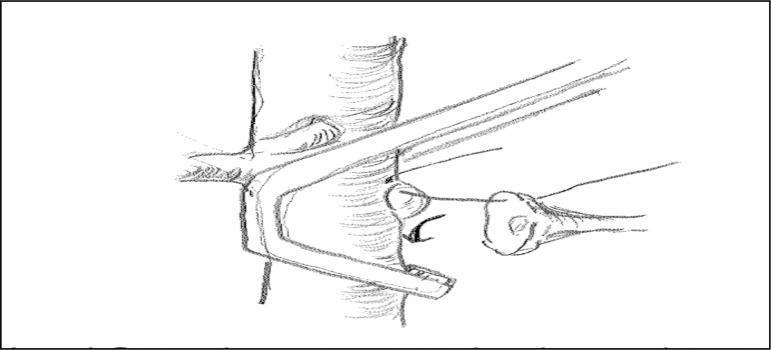
A surgical illustration depicting orthotopic renal transplantation, specifically focusing on the arterial clamping technique. The diagram shows the abdominal aorta as a central, vertical cylindrical vessel. A Satinsky surgical clamp is applied to the aorta, positioned precisely at the base of the left renal artery. This selective clamping method is designed to occlude blood flow for the creation of an anastomotic opening (approximately 8 mm from the artery base) while purposefully sparing the mesenteric arteries and the right renal artery, which are visible branching superiorly to the clamped segment. The illustration highlights the relationship between the surgical instrumentation and vascular anatomy to maintain systemic circulation and prevent lower limb or contralateral renal ischemia during the procedure. Key features include the orientation of the clamp jaws relative to the aortic wall and the positioning of the arterial suture lines for donor kidney attachment.
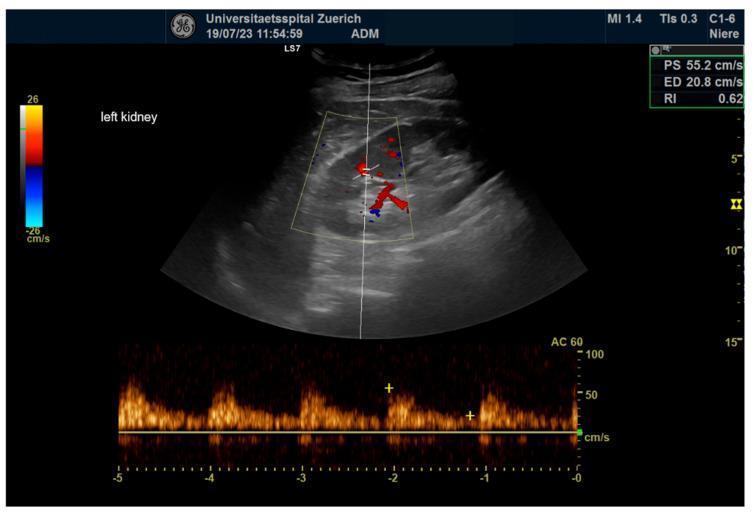
This diagnostic image shows a color-coded duplex sonography (ultrasound) of a left kidney, focusing on renal hemodynamics. The upper panel displays a grayscale B-mode image of the kidney with a color Doppler overlay showing the vascular arborization; red indicates blood flow toward the transducer and blue away from it. The lower panel features a spectral Doppler waveform indicating velocity over time. The waveform exhibits a pulsatile flow pattern typical of renal arterial circulation, characterized by a rapid systolic upstroke and continuous diastolic flow. Key hemodynamic measurements are displayed in the upper right corner: Peak Systolic Velocity (PS) of 55.2 cm/s, End-Diastolic Velocity (ED) of 20.8 cm/s, and a calculated Renal Resistance Index (RI) of 0.62. This RI value is within the normal physiological range (typically <0.70), suggesting normal vascular resistance and parenchymal health. This image is an educational example of monitoring renal perfusion and vascular resistance using non-invasive duplex sonography in a clinical setting.
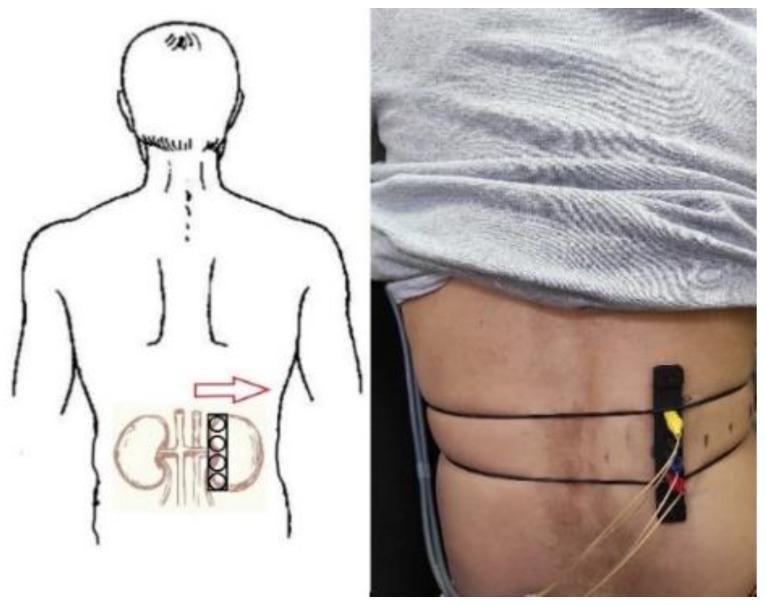
This dual-panel image demonstrates the clinical application of a tetrapolar electrode system for bio-impedance measurement of renal blood flow. The left panel is an anatomical diagram showing a posterior view of the human torso. It illustrates the schematic positioning of two kidneys in the lumbar region, with a tetrapolar electrode array (four circular contacts in a rectangular housing) projected over the right kidney. A horizontal arrow indicates the potential shift for mapping. The right panel is a clinical photograph showing the actual setup on a male subject. A black rectangular electrode patch with four contacts is affixed to the right flank. It is secured by thin, dark elastic bands wrapped around the waist to ensure stable skin contact. Multiple colored lead wires (yellow, blue, and red) emerge from the electrode housing. This side-by-side comparison illustrates the translation of theoretical anatomical targeting into practical non-invasive monitoring for renal hemodynamics and potential assessment of acute kidney injury.
glomerular capillary peritubular capillary vasa recta kidney anatomy
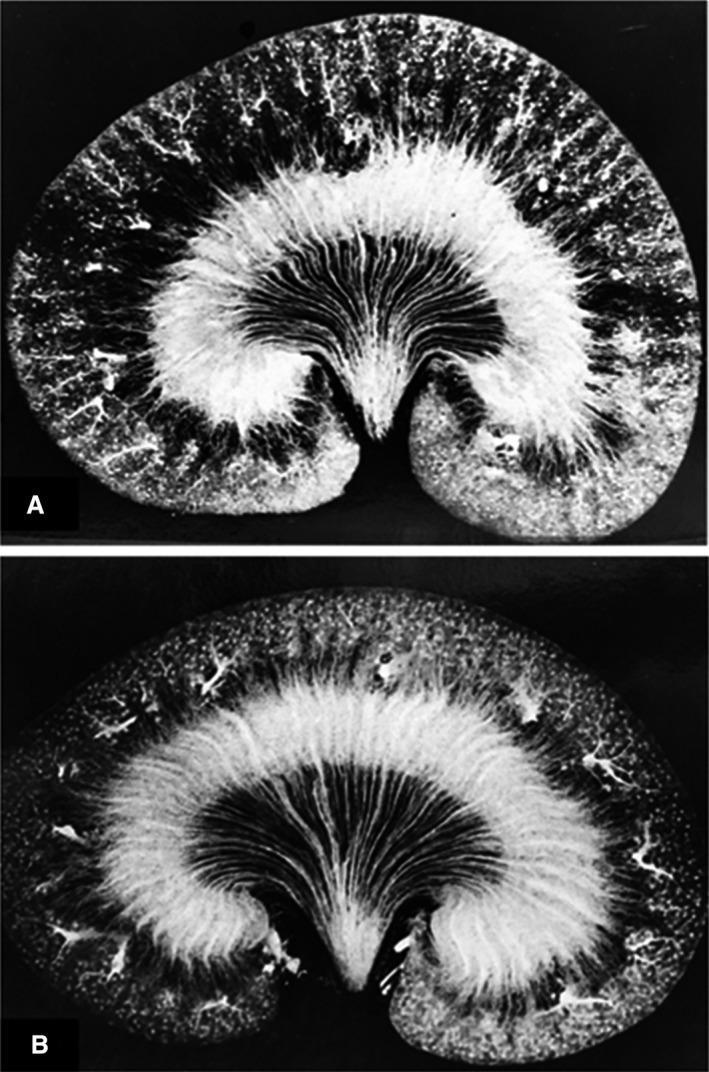
This diagnostic image displays two cross-sectional views of rat kidneys (Figure 1A and 1B) utilizing Microfil injection to visualize the renal microvasculature. Figure 1A demonstrates a normally hydrated (euvolemic) state, showing a dense, uniform filling of all renal zones, including the superficial and deep cortex, as well as the outer and inner medulla. The glomerular and peritubular capillaries are clearly defined. In contrast, Figure 1B illustrates the kidney after 16 hours of water deprivation (dehydration). This image shows a visibly altered pattern of postglomerular microcirculation, characterized by less dense vascular filling and reduced perfusion in the cortical regions compared to the control. The vasa recta in the medullary regions appear less robustly filled. This comparison is used in renal physiology to demonstrate how hydration status influences intrarenal blood flow distribution and vascular resistance across different capillary beds.
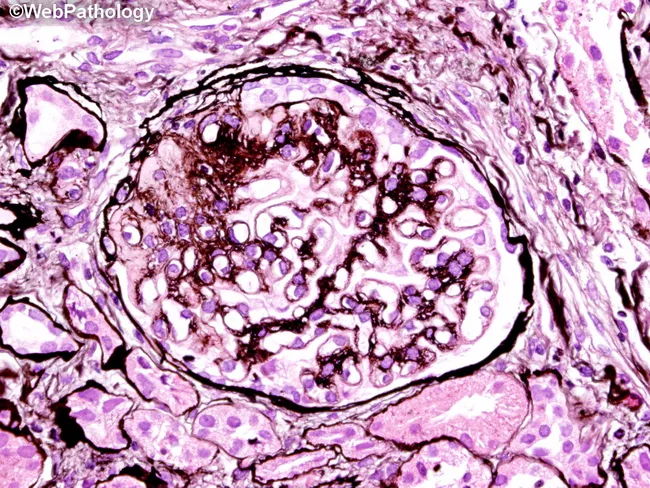
This image shows a renal glomerulus from a kidney cortex biopsy prepared for light microscopy and stained with Hematoxylin and Eosin (H&E), with alternate PAS-based cues. The circular renal corpuscle is bounded by Bowman's capsule, containing a tuft of capillary loops embedded in a dense mesangial matrix. Capillary lumina are variably patent, and the tuft exhibits focal thickening of the glomerular basement membranes suggested by intensified pink staining in the periphery. Mesangial expansion and subtle cellularity changes are evident, with nodular-like accumulations that give a lobulated contour to portions of the tuft. Surrounding tubulointerstitial tissue shows mild, non-destructive changes. Overall, the histologic pattern is compatible with a glomerular lesion characterized by mesangial expansion and potential nodular sclerosis, a feature classically described in nodular glomerulosclerosis and may reflect diabetic nephropathy, though clinical correlation is required. The image emphasizes glomerular architecture, basement membrane alteration, and mesangial pathology, all critical for differential diagnosis among glomerulonephritides. Clinically, such findings correlate with proteinuria, hypertension, and reduced renal function. This representation is valuable for educational purposes, enabling recognition of renal corpuscle anatomy, comparative evaluation of glomerular diseases, and integration of histology with nephrology practice and research.
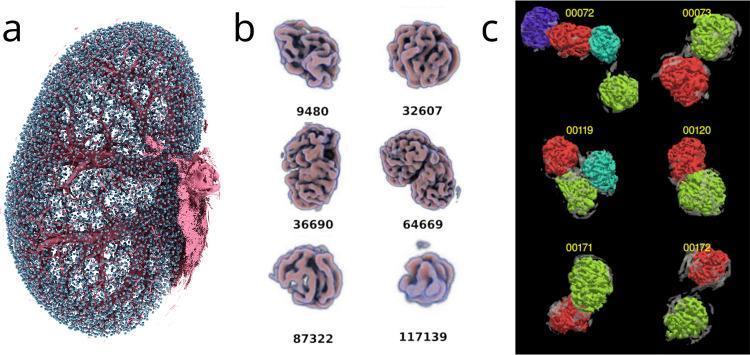
This composite educational graphic illustrates the results of advanced micro-tomography (SRµCT) and machine learning applied to renal micro-anatomy. Panel (a) shows a 3D volume rendering of an entire kidney, where thousands of individual glomeruli are mapped in cyan, densely populating the renal cortex. Large pre-glomerular blood vessels are rendered in magenta, providing a structural framework of the renal vasculature. Panel (b) provides a high-resolution gallery of individual volume-rendered glomeruli, identified by reference numbers. These renderings showcase the complex, convoluted capillary tuft morphology and the natural variation in glomerular size and shape. Panel (c) displays the results of morphometric analysis used to differentiate and separate clustered glomeruli that appear fused due to shared vascular connections, with individual units color-coded (red, green, cyan, purple) for distinction. This visual material is intended for advanced study in nephrology, specifically regarding glomerular filtration barrier architecture and quantitative renal morphometry.
Renal Circulation
1. Vascular Anatomy - The Arterial Tree
| Level | Vessel | Notes |
|---|---|---|
| 1 | Renal artery | Enters at hilum |
| 2 | Segmental arteries | Functional "end arteries" - occlusion causes infarction of that zone |
| 3 | Interlobar arteries | Run between renal pyramids |
| 4 | Arcuate arteries | Arch between cortex and outer medulla |
| 5 | Interlobular (cortical radial) arteries | Extend toward cortex surface |
| 6 | Afferent arterioles | Each supplies one glomerulus |
2. The Two Capillary Beds in Series
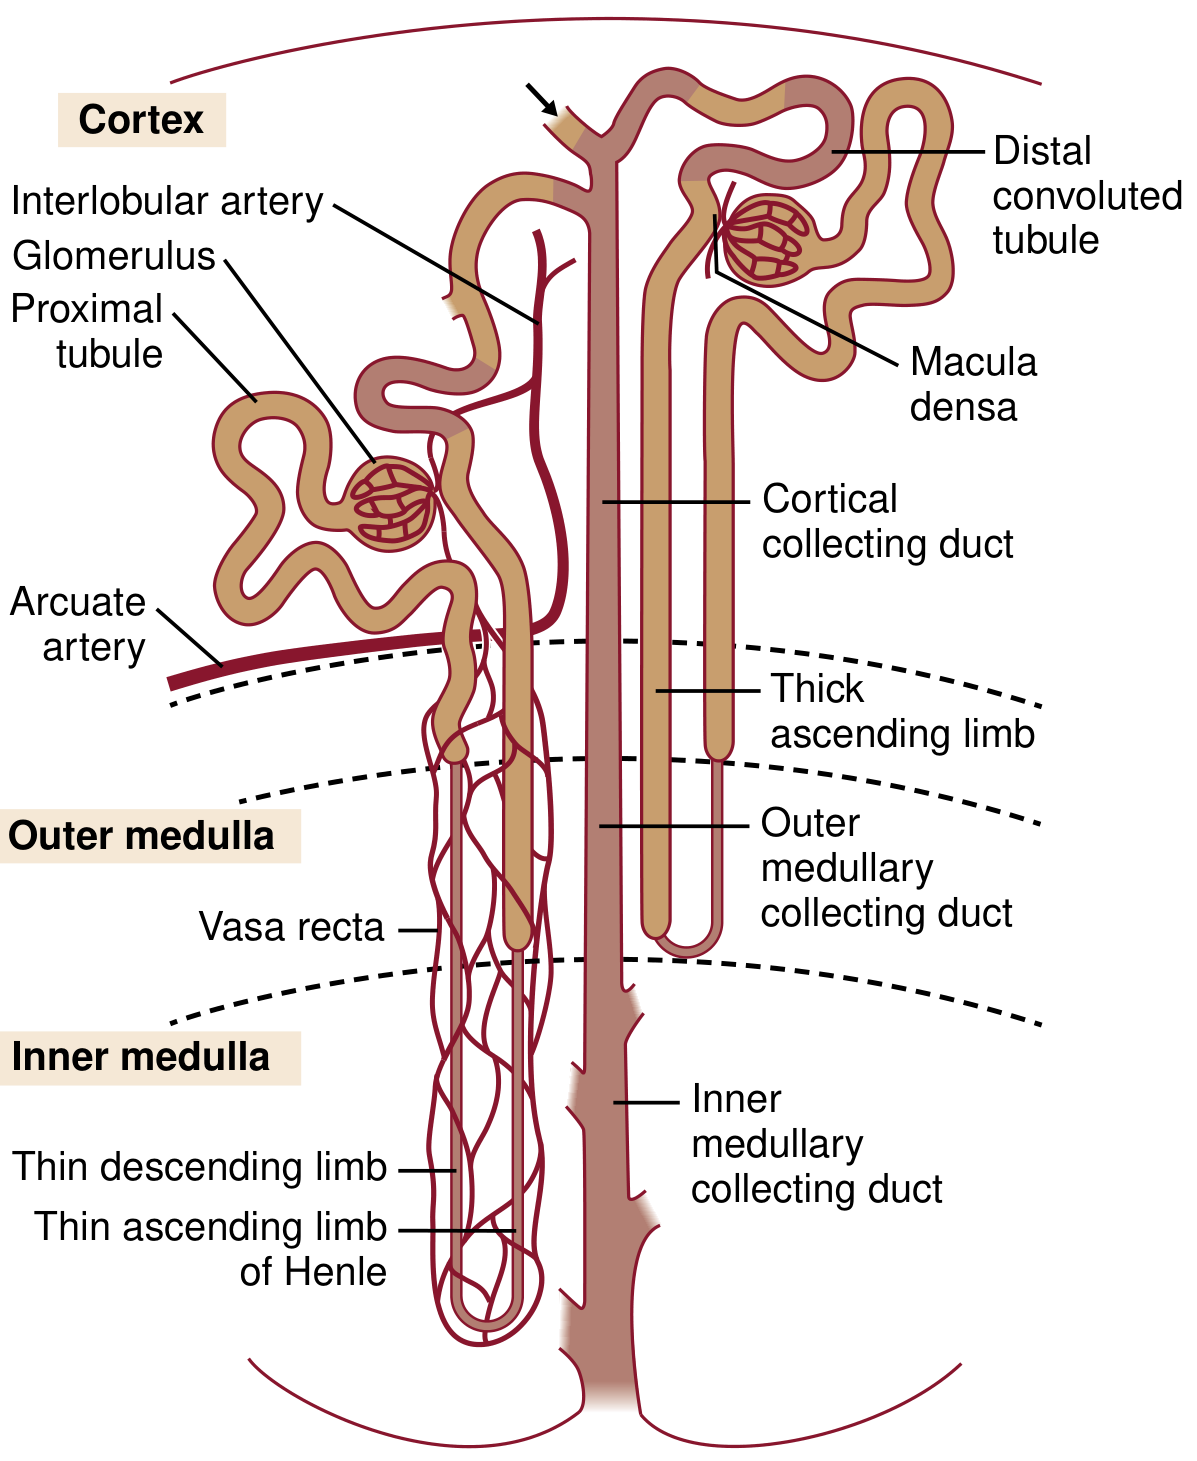
First capillary bed: Glomerular capillaries
- The afferent arteriole breaks up into the glomerular capillary tuft, enclosed within Bowman's capsule
- Glomerular capillary pressure is ~60 mm Hg - much higher than other capillary beds - driving ultrafiltration
- Blood then exits through the efferent arteriole, not a venule
Second capillary bed: Peritubular capillaries
- Efferent arterioles divide into peritubular capillaries, which closely surround proximal and distal tubules in the cortex
- Pressure here is low (~18 mm Hg), favouring reabsorption of fluid from the tubules
- This anatomical pairing of tubules with capillaries enables glomerulotubular balance: when filtration increases, reabsorption also increases proportionally
3. Medullary Blood Supply - The Vasa Recta
- Run in parallel with the loops of Henle, descending into the medulla and making a hairpin turn before returning to the cortex
- This countercurrent arrangement is essential for maintaining the hypertonic medullary gradient that allows urinary concentration
- Low flow in the vasa recta prevents washout of the osmotic gradient
- RBCs passing through face very low O₂ tension and hyperosmotic stress; they carry urea transporters to allow rapid urea entry, maintaining cell volume - Kidney Foundation Primer, p. 20
4. Pressure Profile Across the Renal Vasculature
| Vessel | Pressure (start → end) | % of Total Resistance |
|---|---|---|
| Renal artery | 100 → 100 mmHg | ~0% |
| Interlobar/arcuate/interlobular arteries | ~100 → 85 mmHg | ~16% |
| Afferent arteriole | 85 → 60 mmHg | ~26% |
| Glomerular capillaries | 60 → 59 mmHg | ~1% |
| Efferent arteriole | 59 → 18 mmHg | ~43% |
| Peritubular capillaries | 18 → 8 mmHg | ~10% |
| Renal veins | 8 → 4 mmHg | ~4% |
5. Oxygen Consumption
6. Regulation of Renal Blood Flow
A. Autoregulation (80-170 mmHg)
-
Myogenic mechanism: When arterial pressure rises, the afferent arteriole smooth muscle stretches and reflexively contracts, increasing resistance and keeping flow constant. This responds in seconds.
-
Tubuloglomerular Feedback (TGF): Mediated by the juxtaglomerular apparatus (JGA). When GFR rises, more NaCl is delivered to the macula densa cells, which activates Na⁺-K⁺-2Cl⁻ cotransporters → ATP release → conversion to adenosine → afferent arteriole constriction → GFR returns to normal. When GFR falls, the opposite occurs: decreased NaCl at the macula densa → afferent arteriole dilation + renin release → angiotensin II → efferent arteriole constriction → glomerular pressure maintained. Together, these two mechanisms limit GFR changes to only a few percent even with large pressure fluctuations. - Guyton and Hall, p. 343-344
B. Sympathetic Nervous System
- Renal vessels are richly innervated by sympathetic adrenergic fibers
- Mild-to-moderate sympathetic activation causes predominantly afferent arteriole constriction, reducing RBF and GFR
- During severe stress (hemorrhage, severe exercise), intense sympathetic activation causes marked renal vasoconstriction, diverting blood to vital organs
C. Hormonal and Autacoid Control
| Hormone / Autacoid | Effect on RBF | Effect on GFR | Mechanism |
|---|---|---|---|
| Norepinephrine / Epinephrine | ↓ | ↓ | Vasoconstricts afferent and efferent arterioles |
| Angiotensin II | ↓ | ↔ (prevents ↓) | Preferentially constricts efferent arterioles, maintains GFR |
| Endothelin | ↓ | ↓ | Released by damaged endothelium; potent vasoconstrictor |
| Nitric oxide (endothelial) | ↑ | ↑ | Vasodilates afferent arteriole; counteracts Ang II |
| Prostaglandins (PGE₂, PGI₂) | ↑ | ↑ | Vasodilatory; buffer Ang II effects, especially under stress |
7. Clinical Relevance
| Situation | Circulatory Effect |
|---|---|
| ACE inhibitors / ARBs | Block efferent Ang II constriction → ↓ GFR (especially in RAS, volume depletion) |
| NSAIDs | Block prostaglandin vasodilation → ↑ renal vasoconstriction, ↓ RBF/GFR |
| Hemorrhagic shock | Massive sympathetic activation → renal vasoconstriction → acute kidney injury risk |
| Renal artery stenosis | Reduced perfusion pressure → Ang II sustains GFR; ACE inhibitors remove this compensatory mechanism |
| Diabetic nephropathy | Afferent arteriole dilation (early) → ↑ glomerular pressure → hyperfiltration → glomerulosclerosis |