
Ventricular Muscle Action Potential, Conducting System of Heart, Type 216 Heart Block, List the factors affecting venous return.
ventricular muscle action potential phases cardiac
conducting system of the heart SA node AV node bundle of His Purkinje fibers
heart block ECG first degree second degree third degree AV block
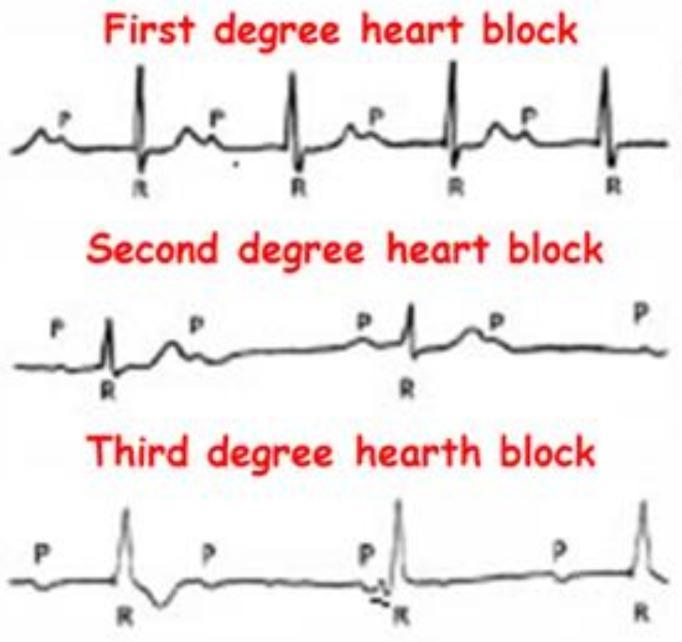
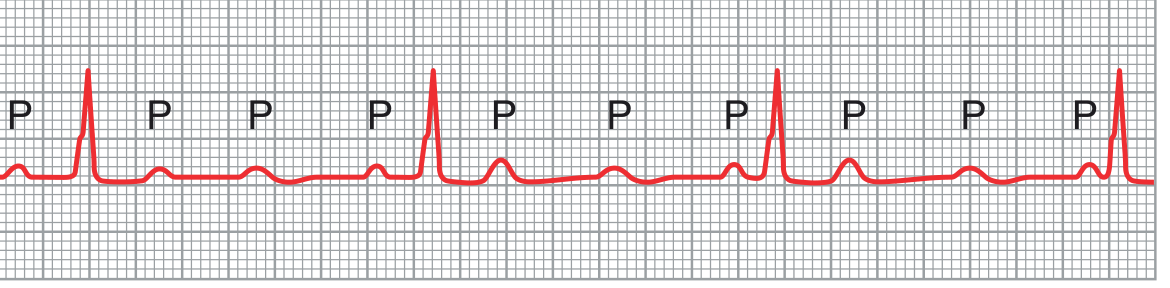
This Comparison Chart illustrates the electrocardiographic (ECG) characteristics of Atrioventricular (AV) blocks. It features three stacked rhythm strips categorized as First, Second, and Third-degree heart blocks, emphasizing the relationship between P waves (atrial depolarization) and QRS complexes (ventricular depolarization). The 'First degree heart block' panel demonstrates a consistent 1:1 P-to-QRS ratio with a fixed, prolonged PR interval. The 'Second degree heart block' panel shows intermittent conduction failure, where specific P waves are not followed by a QRS complex. The 'Third degree heart block' panel depicts complete AV dissociation, where P waves and QRS complexes occur independently and at different rates, indicating a total interruption of impulse transmission and the presence of a ventricular escape rhythm. This diagnostic illustration is designed for cardiovascular education to help students and clinicians distinguish between different stages of cardiac conduction system disease and their associated clinical significance.
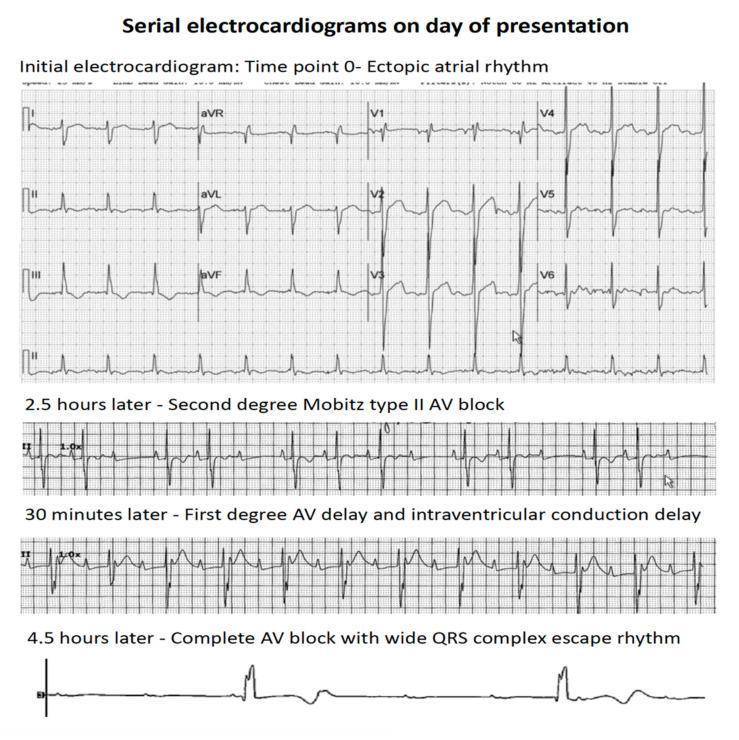
This diagnostic image consists of a series of four electrocardiogram (ECG) rhythm strips demonstrating the rapid clinical progression of atrioventricular (AV) conduction abnormalities over a period of 4.5 hours. The top panel, labeled 'Time point 0', shows an ectopic atrial rhythm with organized P-wave activity and narrow QRS complexes. The second strip, recorded 2.5 hours later, displays a second-degree Mobitz type II AV block, characterized by intermittently dropped QRS complexes without preceding PR interval lengthening. The third strip, 30 minutes later, indicates a first-degree AV delay (prolonged PR interval) and intraventricular conduction delay (widened QRS). The final rhythm strip at 4.5 hours shows third-degree (complete) AV block, characterized by complete AV dissociation and a slow, wide QRS complex ventricular escape rhythm. This progression illustrates acute cardiac conduction system failure, typically associated with myocardial infiltration or severe injury, as seen in patients with leukemic infiltration of the heart.
1. Ventricular Muscle Action Potential
Phases of the Ventricular Action Potential
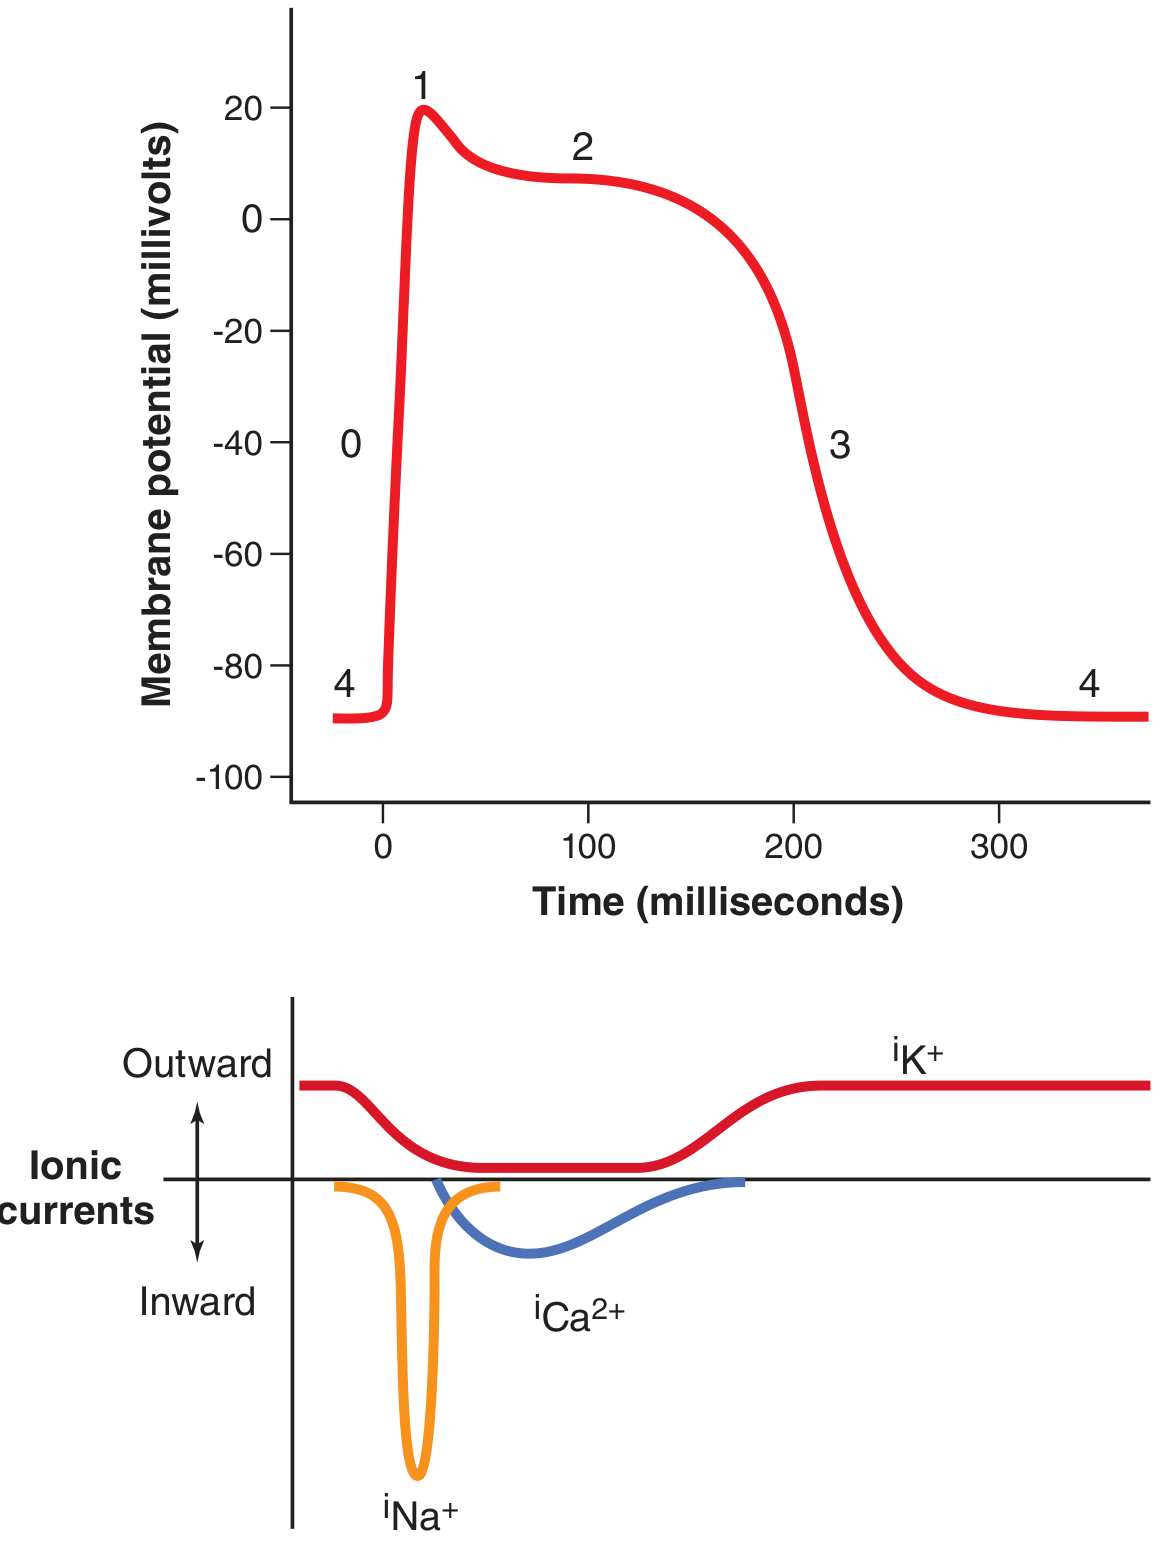
| Phase | Name | Key Ion Events |
|---|---|---|
| Phase 0 | Rapid Depolarization | Voltage-gated fast Na+ channels open → rapid Na+ influx → membrane potential rises to +20 mV |
| Phase 1 | Initial Repolarization | Fast Na+ channels close; K+ leaves through open K+ channels |
| Phase 2 | Plateau | L-type Ca2+ channels (slow Ca2+ channels) open → Ca2+ and Na2+ influx; K+ channels close → prolonged depolarization |
| Phase 3 | Rapid Repolarization | Ca2+ channels close; slow K+ channels open → rapid K+ efflux → return to resting potential |
| Phase 4 | Resting Membrane Potential | Stable at -80 to -90 mV; no spontaneous depolarization (unlike SA/AV nodal cells) |
Why is There a Plateau? (Two Key Mechanisms)
-
L-type Ca2+ channels (slow channels): In cardiac muscle, the AP is sustained by both fast Na+ channels AND slow Ca2+ channels. The slow Ca2+ channels remain open for several tenths of a second, maintaining depolarization.
-
Decreased K+ permeability: Immediately after AP onset, K+ permeability drops ~5-fold (unlike skeletal muscle). This prevents early K+ efflux, sustaining the plateau.
Note: Healthy ventricular muscle has no If current (funny current) and therefore shows no pacemaker activity. The resting potential is stable at -80 mV between beats.
2. Conducting System of the Heart
Components (in Sequence of Impulse Transmission)
| Structure | Location | Rate (impulses/min) | Notes |
|---|---|---|---|
| Sinoatrial (SA) Node (Keith-Flack node) | Posterior wall of right atrium, near SVC opening, in sulcus terminalis cordis | 60-80 | Primary pacemaker; spindle-shaped, ~10 mm long; lies beneath the epicardium |
| Atrioventricular (AV) Node (Aschoff-Tawara node) | Atrioventricular septum, interatrial septum; between coronary sinus opening and septal cusp of tricuspid valve | 50-60 | ~5 mm long; only normal electrical bridge from atria to ventricles; introduces physiological conduction delay |
| Bundle of His (AV bundle) | Penetrates cardiac skeleton toward ventricles; reaches superior margin of muscular interventricular septum | - | Trunk divides into right and left bundle branches |
| Right Bundle Branch | Curves down; enters septomarginal trabecula; reaches anterior papillary muscle | - | Ends in subendocardial plexus at apex |
| Left Bundle Branch | Fans out in flat bundles along interventricular septum; usually divides into two major fascicles | - | Reaches base of papillary muscles; subendocardial networks |
| Purkinje Fibers | Subendocardial networks throughout ventricles | 25-45 | Fastest conduction (up to 4 m/sec); distribute impulse to working myocardium |
Key Functional Principles
- Hierarchy of pacemakers: The SA node fires fastest so it drives the others. If SA fails, AV node takes over; if AV node fails, the ventricles (Purkinje system) take over at 25-45/min.
- AV delay: The AV node introduces a conduction delay (~0.12 s) to allow atrial contraction to complete before ventricular systole begins.
- One-way conduction: The AV node is the only normal electrical pathway from atria to ventricles. There is no other route.
- ECG correlation: SA node activity → P wave; AV delay → PR interval; Bundle branch/ventricular activation → QRS complex.
3. Heart Block (Type 2:1 / "Type 216" context)
Classification of AV Block
First-Degree AV Block
- Every atrial impulse is conducted to the ventricles (1:1 relationship preserved).
- PR interval > 0.20 second (normal ≤ 0.20 s). Prolongation up to 1.0 second has been recorded.
- No dropped beats; regular ventricular rate.
- PR interval seldom exceeds 0.35-0.45 s (beyond that, conduction ceases entirely).
- Usually caused by AV node delay; QRS is typically normal.
- ECG finding: Prolonged PR interval with normal QRS.
- Clinical: Often benign; used to gauge severity in rheumatic carditis.
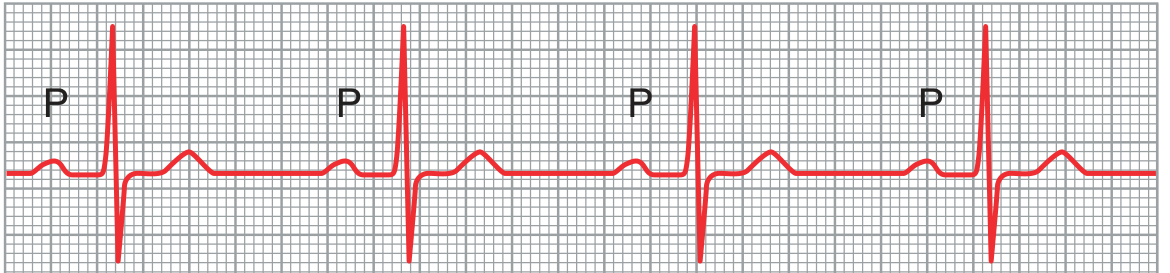
Second-Degree AV Block (with 2:1 Block = "Type 216")
- Progressive lengthening of PR interval until one P wave is not conducted (dropped beat), then the cycle resets.
- Almost always caused by abnormality in the AV node.
- Generally benign; usually no pacemaker required.
- Sudden block of conduction without prior PR prolongation - the PR interval is fixed before the dropped beat.
- Typically caused by abnormality of the His-Purkinje system.
- May show 2:1, 3:1, or 3:2 ratios (e.g., 2:1 = two P waves for every one QRS complex - the "Type 216" pattern).
- More dangerous - risk of progression to complete heart block; pacemaker implantation often required.
Third-Degree (Complete) AV Block
- Complete dissociation between atrial and ventricular activity.
- P waves and QRS-T complexes are totally independent of one another.
- Atrial rate: ~100 beats/min; Ventricular (escape) rate: < 40 beats/min.
- Ventricles "escape" and beat at their own intrinsic rate from a subsidiary pacemaker (usually distal AV node or His bundle).
Causes of AV Block (Guyton & Hall)
- Ischemia of AV node or AV bundle fibers (coronary insufficiency)
- Compression of the AV bundle by scar tissue or calcification
- Inflammation (endocarditis/myocarditis from diphtheria, rheumatic fever)
- Excessive vagal stimulation (e.g., carotid sinus syndrome - rare)
- Degeneration of the AV conduction system (elderly patients)
- Medications: Digitalis, beta-adrenergic antagonists
Stokes-Adams Syndrome
4. Factors Affecting Venous Return
VR = (Psf - PRA) / RVRWhere: VR = venous return, Psf = mean systemic filling pressure, PRA = right atrial pressure, RVR = resistance to venous returnNormal values: VR = 5 L/min, Psf = 7 mm Hg, PRA = 0 mm Hg, RVR = 1.4 mm Hg/L/min
1. Right Atrial Pressure (Back-Pressure Effect)
- Right atrial pressure (PRA) impedes the flow of blood from veins into the right atrium.
- As PRA rises, venous return falls (backward force dams blood in the systemic circulation).
- Venous return falls to zero when PRA rises to equal Psf (~7 mm Hg).
- When PRA falls below atmospheric pressure (~-2 mm Hg), veins entering the chest collapse - creating a plateau (venous return cannot increase further even with more negative PRA).
2. Mean Systemic Filling Pressure (Psf) - "Driving Force"
- This is the pressure throughout the systemic circulation when all blood flow stops - it represents the degree of filling of the systemic circulation.
- Normal Psf = 7 mm Hg.
- Psf is the force that pushes blood toward the heart.
- Increased Psf (e.g., from increased blood volume, sympathetic vasoconstriction) shifts the venous return curve to the right → increases venous return.
- Decreased Psf (e.g., hemorrhage, vasodilation) shifts the curve left → decreases venous return.
3. Resistance to Venous Return (RVR)
- Most RVR occurs in the veins (~2/3), with the remainder in arterioles and small arteries (~1/3).
- When venous resistance increases, blood dams in veins; but since veins are highly distensible, venous pressure rises very little - so resistance is poorly overcome.
- When arteriolar resistance increases, blood dams in arteries (low capacitance = 1/30th that of veins), arterial pressure rises sharply, and this pressure overcomes resistance more effectively.
- A decrease in RVR to half-normal doubles venous return (rotates the venous return curve upward).
- An increase in RVR to twice normal halves venous return.
Additional / Secondary Factors Affecting Venous Return
| Factor | Effect on Venous Return |
|---|---|
| Blood volume (increased) | Increases Psf → increases venous return |
| Skeletal muscle pump | Muscle contractions compress veins → propels blood toward heart |
| Respiratory pump | Inspiration → negative intrathoracic pressure → expands right atrium/great veins → increases venous return |
| Sympathetic venoconstriction | Compresses capacitance vessels → raises Psf → increases venous return |
| Gravity/Posture | Standing: venous pooling in legs → decreases venous return; Supine: increases venous return |
| Valves in peripheral veins | Prevent retrograde flow; essential for effectiveness of muscle pump |
| Cardiac pumping ability | More vigorous pumping lowers PRA → enhances venous return gradient |
- Guyton and Hall Textbook of Medical Physiology - Chapters 9, 10, 13, 20
- Braunwald's Heart Disease: A Textbook of Cardiovascular Medicine - Chapter 68
- Color Atlas of Human Anatomy, Vol. 2: Internal Organs