
PSM
Asking for Preferences
What aspect of PSM are you asking about?
Asking for Preferences
What area of PSM would you like help with?
Asking for Preferences
Which specific topic in Epidemiology & Biostatistics?
The user skipped, so I'll provide a comprehensive overview of Epidemiology & Biostatistics for PSM, pulling from the medical library textbooks.
Reading File
Finding Sources
Finding Sources
Good - Park's Textbook of PSM is available. Let me search within it for key epidemiology and biostatistics topics.
Finding Sources
Finding Sources
Finding Sources
Reading File
Reading File
Reading File
Reading File
Reading File
Reading File
Reading File
Reading File
Reading File
Finding Sources
Finding Sources
Reading File
Finding Sources
Finding Sources
Reading File
I now have comprehensive content from Park's Textbook. Let me compile the full structured answer.
PSM - Epidemiology & Biostatistics
Based on Park's Textbook of Preventive and Social Medicine
1. DEFINITION & AIMS OF EPIDEMIOLOGY
Epidemiology is the study of the distribution and determinants of health-related states or events in specified populations, and the application of this study to the control of health problems.
Three main aims (IEA):
- Describe the distribution and magnitude of health/disease problems in populations
- Identify aetiological factors (risk factors) in disease pathogenesis
- Provide data for planning, implementing, and evaluating health services
Key distinction from clinical medicine: Epidemiology studies populations; clinical medicine studies individuals. The epidemiologist is interested in the relationship between cases and the population - expressed as a rate.
2. TYPES OF EPIDEMIOLOGICAL STUDIES
A. Descriptive Epidemiology
Describes distribution of disease by:
- When - time distribution
- Where - place distribution
- Who - person distribution
Descriptive studies are usually the first phase of investigation. They formulate hypotheses rather than test them.
B. Analytical Epidemiology
Tests hypotheses. Studies individuals within a population. Two main types:
1. Case-Control Study ("Retrospective")
- Both exposure and outcome have already occurred before study starts
- Proceeds backwards from effect to cause
- Starts with cases (with disease) and controls (without disease), then looks back at exposure
- Measure of association: Odds Ratio (OR) = ad/bc
- OR approximates Relative Risk when the disease is rare
Advantages: Rapid, cheap, few subjects needed, good for rare diseases, can study multiple aetiological factors, no follow-up needed
Disadvantages: Recall bias, selection of control group difficult, cannot calculate incidence directly, one outcome at a time
Biases specific to case-control:
- Recall/Memory bias - cases remember past exposure better than controls
- Selection bias - cases/controls may not represent the general population
- Berkesonian bias - different hospital admission rates for different diseases
- Interviewer bias - knowing who is a case leads to more thorough questioning (eliminated by double-blinding)
- Confounding bias - controlled by matching
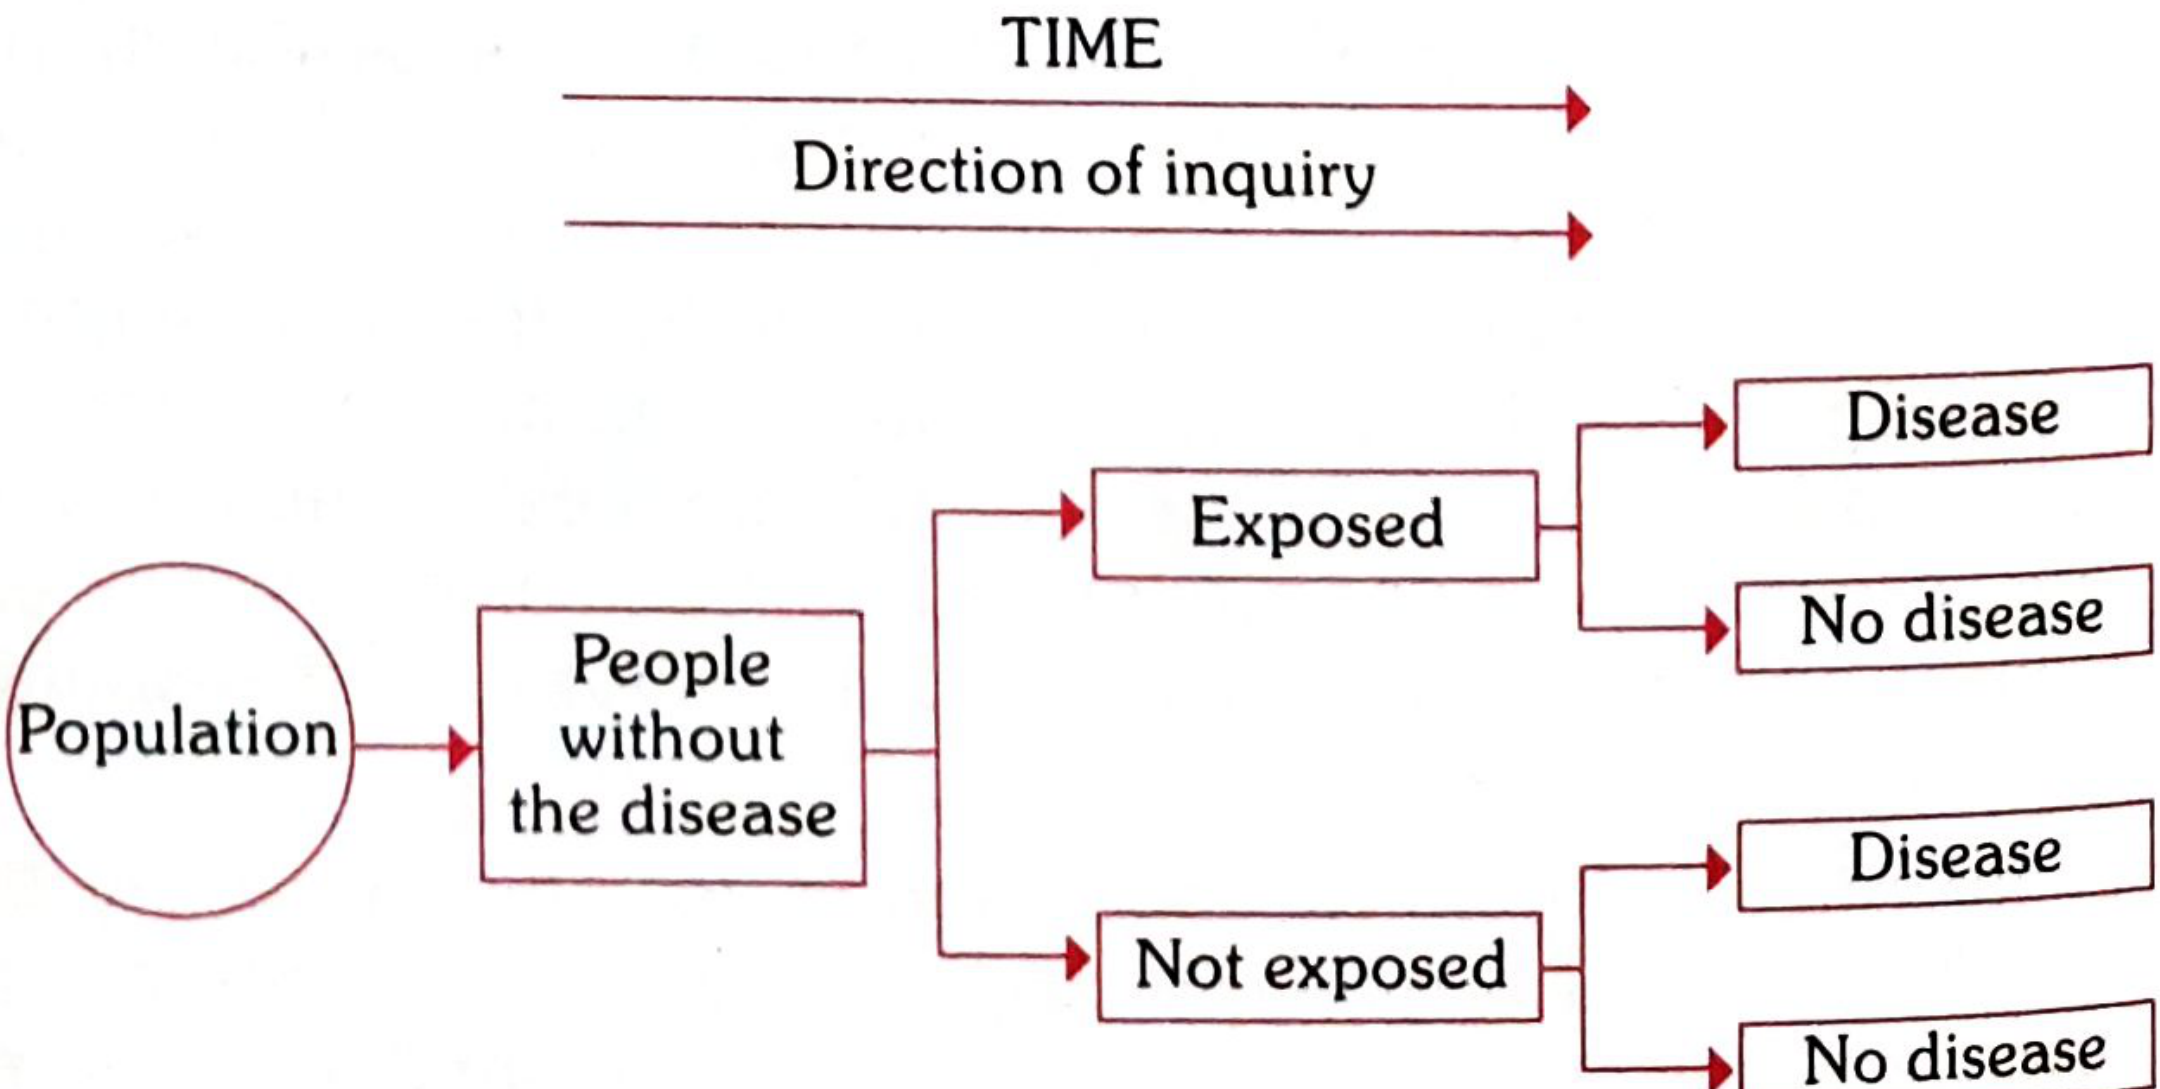
2. Cohort Study ("Prospective")
- Starts with exposed and non-exposed people (all disease-free)
- Follows forward in time to see who develops disease
- Directly calculates Relative Risk (RR)
- RR = Incidence among exposed / Incidence among non-exposed
- RR > 1 = positive association; RR = 1 = no association; RR < 1 = protective
Advantages: Direct RR calculation, temporal relationship clear, dose-response can be calculated, can study multiple outcomes
Disadvantages: Expensive, time-consuming, attrition (loss to follow-up), inefficient for rare diseases
C. Experimental Epidemiology
- Investigator controls conditions - applies/withdraws the intervention
- Gold standard: Randomised Controlled Trial (RCT)
- Experimental group vs. control group; outcome compared
- Can be in animals or humans
- Advantages: strongest causal evidence
- Disadvantages: costly, ethical issues, feasibility
3. MEASURES OF DISEASE FREQUENCY
Incidence Rate
"The number of new cases occurring in a defined population during a specified period of time"
Formula:
$$\text{Incidence Rate} = \frac{\text{Number of new cases in a given period}}{\text{Population at risk during that period}} \times 1000$$
- Restricted to acute conditions
- Must always state the unit of time (e.g., per 1000 per year)
Special incidence rates:
| Rate | Formula | Use |
|---|---|---|
| Attack Rate | New cases / Population at risk × 100 | During epidemics |
| Secondary Attack Rate | New cases among contacts / Total susceptible contacts × 100 | Household spread |
Prevalence Rate
"All current cases (old and new) existing at a given point in time or over a period"
- More accurately a ratio, not a rate
Types:
- Point prevalence - all cases at a single point in time (most common use)
- Period prevalence - all cases during a defined period
Formula (point prevalence):
$$\text{Point Prevalence} = \frac{\text{All current cases at a given point in time}}{\text{Estimated population at same point}} \times 100$$
Prevalence-Incidence Relationship
$$\boxed{P = I \times D}$$
- P = Prevalence, I = Incidence, D = Mean duration of disease
- Long duration disease → high prevalence (e.g., tuberculosis)
- Short/rapidly fatal disease → prevalence ≈ incidence (e.g., food poisoning)
- Analogy: Prevalence = photograph (snapshot); Incidence = film (continuous record)
4. MEASURES OF ASSOCIATION
| Measure | Used In | Formula | Interpretation |
|---|---|---|---|
| Relative Risk (RR) | Cohort study | Incidence (exposed) / Incidence (unexposed) | Strength of association |
| Odds Ratio (OR) | Case-control study | ad/bc | Approximates RR for rare diseases |
| Attributable Risk (AR) | Cohort | Incidence (exposed) - Incidence (unexposed) | Excess risk due to exposure |
| Population Attributable Risk | Cohort | AR × Prevalence of exposure | Impact at population level |
5. SCREENING & DIAGNOSTIC TESTS
2x2 Contingency Table
| Disease + | Disease - | |
|---|---|---|
| Test + | a (True Positive) | b (False Positive) |
| Test - | c (False Negative) | d (True Negative) |
Key Formulae
| Parameter | Formula | Meaning |
|---|---|---|
| Sensitivity | a/(a+c) × 100 | Ability to detect true positives - "does the test pick up disease?" |
| Specificity | d/(b+d) × 100 | Ability to detect true negatives - "does the test exclude disease?" |
| PPV (Positive Predictive Value) | a/(a+b) × 100 | If test is +ve, probability truly has disease |
| NPV (Negative Predictive Value) | d/(c+d) × 100 | If test is -ve, probability truly disease-free |
| False-negative rate | c/(a+c) × 100 | = 1 - Sensitivity |
| False-positive rate | b/(b+d) × 100 | = 1 - Specificity |
Example from Park's (hypothetical figures):
- a=40, b=20, c=100, d=9840, Total=10,000
- Sensitivity = 40/140 × 100 = 28.57%
- Specificity = 9840/9860 × 100 = 99.79%
- PPV = 40/60 × 100 = 66.66%
- NPV = 9840/9940 × 100 = 98.9%
Key Points About Screening
- Sensitivity and specificity are properties of the test itself - they do not change with disease prevalence
- PPV increases with increasing prevalence of disease in the population - the same test has higher PPV in a high-risk group
- High sensitivity = good for ruling OUT disease (SNOUT: Sensitive test, Negative result, rules OUT)
- High specificity = good for ruling IN disease (SPIN: Specific test, Positive result, rules IN)
Difference: Screening vs. Case-finding vs. Diagnosis
- Screening - testing asymptomatic people NOT seeking care (e.g., neonatal screening)
- Case-finding - testing people seeking care for OTHER reasons (e.g., VDRL in antenatal clinic)
- Diagnosis - confirming disease in people with signs/symptoms
6. BIAS & CONFOUNDING
Bias = any systematic error in determining the association between exposure and disease.
Types of Bias
| Type | Description | Control |
|---|---|---|
| Recall/Memory bias | Cases recall past exposures better than controls | Objective records |
| Selection bias | Cases/controls not representative of general population | Careful selection criteria |
| Berkesonian bias | Different hospital admission rates for different diseases | Population-based studies |
| Interviewer bias | Interviewer probes cases more thoroughly knowing the hypothesis | Double-blinding |
| Confounding | Third variable associated with both exposure and outcome | Matching, stratification, multivariate analysis |
Confounding is a key concept: A confounder is a variable that is associated with both the exposure and the disease but is not on the causal pathway. For example, in studying alcohol and lung cancer, smoking is a confounder.
7. QUICK REVISION TABLE - Study Designs at a Glance
| Feature | Cross-sectional | Case-Control | Cohort | RCT |
|---|---|---|---|---|
| Direction | Snapshot | Backward | Forward | Forward |
| Measure | Prevalence | OR | RR, AR | RR |
| Cost | Cheap | Moderate | Expensive | Very expensive |
| Time | Short | Short | Long | Varies |
| Rare disease | Poor | Good | Poor | Poor |
| Rare exposure | Poor | Poor | Good | Good |
| Causality proof | Weakest | Moderate | Strong | Strongest |
| Bias risk | Moderate | High | Moderate | Lowest |
Source: Park's Textbook of Preventive and Social Medicine, 9789382219163
Enumerate the waterborne disease. Write down the principle of chlorination of drinking water. Define breakpoint chlorination in PSM. The long question is answer choice. Hmm.
Searching Park's for waterborne diseases and chlorination content now.
Finding Sources
Finding Sources
Finding Sources
Reading File
Reading File
Finding Sources
Reading File
Reading File
All the content needed is retrieved. Here is the full structured answer:
PSM - Water Hygiene: Waterborne Diseases & Chlorination
Park's Textbook of Preventive and Social Medicine
1. WATERBORNE DISEASES (Enumeration)
Water-related diseases are classified as follows:
A. Biological (Water-borne) Diseases
1. Those caused by the presence of an infective agent:
| Category | Diseases |
|---|---|
| (a) Viral | Viral hepatitis A, Hepatitis E, Poliomyelitis, Rotavirus diarrhoea (infants) |
| (b) Bacterial | Typhoid fever, Paratyphoid fever, Bacillary dysentery (Shigella), E. coli diarrhoea, Cholera |
| (c) Protozoal | Amoebiasis, Giardiasis |
| (d) Helminthic | Roundworm (Ascaris), Threadworm (Enterobius), Hydatid disease |
| (e) Leptospiral | Weil's disease (Leptospirosis) |
2. Those due to the presence of an aquatic host:
| Aquatic Host | Disease |
|---|---|
| Snail | Schistosomiasis |
| Cyclops | Guinea worm (Dracunculiasis), Fish tapeworm |
B. Chemical Water-related Diseases
- Fluoride excess → Dental fluorosis (mottling of enamel)
- Fluoride deficiency (< 0.5 mg/L) → Dental caries
- High nitrates → Methaemoglobinaemia (cyanosis in infants)
- Industrial/agricultural pollutants (heavy metals, cyanides, organic acids, dyes)
2. PRINCIPLES OF CHLORINATION OF DRINKING WATER
"The mere addition of chlorine to water is not chlorination. There are certain rules which should be obeyed in order to ensure proper chlorination."
- Park's Textbook
The 5 Principles:
Principle 1 - Clarity of Water
The water to be chlorinated must be clear and free from turbidity. Turbidity impedes efficient chlorination because suspended particles protect bacteria from the action of chlorine.
Principle 2 - Chlorine Demand Must Be Met
The "chlorine demand" of water must first be estimated and satisfied.
"The chlorine demand of water is the difference between the amount of chlorine added to the water and the amount of residual chlorine remaining at the end of a specific contact period (usually 60 minutes) at a given temperature and pH."
In simple terms: it is the amount of chlorine needed to destroy bacteria AND oxidize all organic matter and ammoniacal substances present in the water. The point at which the chlorine demand is fully met is the "break-point" (see below).
Principle 3 - Adequate Contact Period
The presence of free residual chlorine for a contact period of at least ONE HOUR is essential to kill bacteria and viruses.
- Note: Chlorine has no effect on spores, protozoal cysts, and helminthic ova except in higher doses.
Principle 4 - Minimum Free Residual Chlorine
The minimum recommended concentration of free residual chlorine = 0.5 mg/L for one hour.
- Free residual chlorine provides a margin of safety against subsequent microbial contamination during storage and distribution.
Principle 5 - Correct Dosage Formula
$$\boxed{\text{Correct dose} = \text{Chlorine demand of water} + \text{Free residual chlorine (0.5 mg/L)}}$$
Additional Key Points on Action of Chlorine:
When chlorine is added to water, the chemical reactions are:
$$\text{H}_2\text{O} + \text{Cl}_2 \rightarrow \text{HCl} + \text{HOCl}$$
$$\text{HOCl} \rightarrow \text{H}^+ + \text{OCl}^-$$
- The HCl is neutralized by the alkalinity of the water
- Disinfecting action is mainly due to HOCl (hypochlorous acid) - the most effective form
- HOCl is 70-80 times more effective than the hypochlorite ion (OCl⁻)
- Chlorine acts best when pH is around 7 (predominance of HOCl)
- When pH exceeds 8.5, it becomes unreliable because ~90% of HOCl gets ionized to OCl⁻
3. BREAKPOINT CHLORINATION (Definition)
(Exam-favourite long question topic)
Step-by-step Explanation:
When chlorine is added to water containing ammonia, it forms chloramines (combined chlorine). Chloramines do not have the same efficiency as free chlorine.
What happens as chlorine dose is progressively increased:
| Stage | What Happens |
|---|---|
| 1 | Chlorine added → reacts with ammonia → forms chloramines (combined residual chlorine rises) |
| 2 | More chlorine added → chloramines are destroyed by the added chlorine → residual chlorine falls |
| 3 | Further increase in dose → residual keeps falling → end products carry no residual chlorine |
| 4 | A minimum (the "breakpoint") is reached → all combined chlorines are completely destroyed |
| 5 | Beyond this point → residual chlorine begins to rise again in direct proportion to chlorine added = free chlorine |
Definition (Park's):
"The point at which the residual chlorine appears and when all combined chlorines have been completely destroyed is the breakpoint, and the corresponding dosage is the breakpoint dosage."
Significance:
- Breakpoint chlorination achieves the same results as superchlorination but in a rational, controlled manner
- It can therefore be construed as "controlled superchlorination"
- Beyond the breakpoint, any additional chlorine added remains as free available chlorine (the most effective germicidal form)
- It removes all taste and odour caused by chloramines
- It ensures true disinfection by free HOCl rather than the less efficient chloramines
Graphical Concept:
Residual Cl
    ↑
    |  /‾‾‾‾‾‾
    | /  Combined Cl (chloramines)
    |/
    |   ↘          /‾‾‾‾ Free Cl begins
    |    ↘        /
    |     [BREAKPOINT]
    |________________________→ Chlorine dose added
At the breakpoint, all ammonia-nitrogen is oxidised, chloramines are destroyed, and every additional unit of chlorine now appears as free residual chlorine.
Methods of Chlorination (for completeness)
| Agent | Notes |
|---|---|
| Chlorine gas | First choice - cheap, quick, efficient, easy to apply; needs special equipment (Paterson's chloronome) |
| Chloramine | Slower action, less chlorinous taste, more persistent residual; less commonly used |
| Perchloron / HTH (High Test Hypochlorite) | Calcium compound with 60-70% available chlorine; used as solution for disinfection |
Source: Park's Textbook of Preventive and Social Medicine, Chapter on Water Hygiene
This is a shared conversation. Sign in to Orris to start your own chat.