
Antihistaminic drug
antihistamine drug classification H1 H2 receptor pharmacology
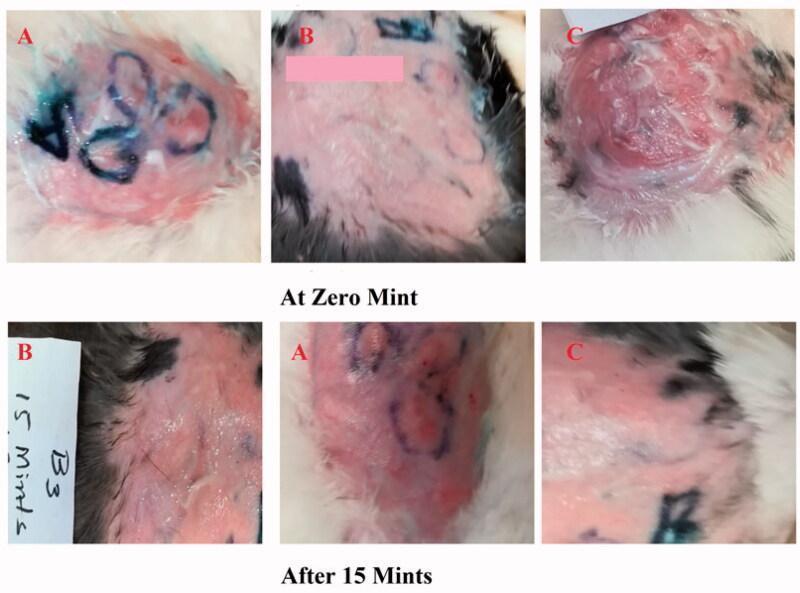
This comparison clinical photograph depicts the efficacy of topical antihistamine formulations on induced skin reactions in a rabbit model. The visual is organized into two rows representing time points: 'At Zero Mint' and 'After 15 Mints', subdivided into three experimental groups (A, B, and C). Group A evaluates a novel Ebastine emulgel, Group B serves as a positive control using a standard antihistamine (Benadryl), and Group C acts as the untreated negative control. At 0 minutes, all groups show histamine-induced erythema and wheal formation, with Group C exhibiting the most severe, raised, and inflamed lesion. Surface markings in blue and pink demarcate treatment zones. At 15 minutes, Group A and Group B demonstrate a visible reduction in the intensity and area of erythema, indicating effective drug absorption and inhibition of the H1-receptor-mediated allergic response. In contrast, Group C maintains significant, persistent inflammation and redness. The images illustrate the clinical progression of allergic skin lesions and the therapeutic effect of topical emulgel formulations on inflammatory symptoms like redness and swelling.
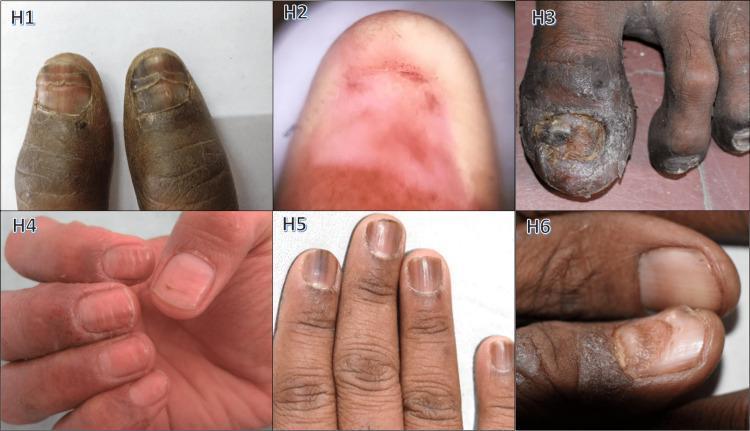
A clinical compilation of six photographs (H1-H6) demonstrating various drug-induced nail pathologies. H1 shows doxorubicin-induced chromonychia with longitudinal pigmented bands and nail plate discoloration. H2 illustrates drug-induced anonychia, showing complete absence of the nail plate with residual erythematous nail bed. H3 displays severe carboplatin-induced onychodystrophy of the great toenail, characterized by marked thickening (pachyonychia), brownish-gray discoloration, and surface irregularity. H4 depicts cisplatin-induced Beau's lines, visible as horizontal grooves or transverse depressions across multiple fingernails. H5 shows zidovudine-induced longitudinal melanonychia, presenting as dark vertical bands extending from the proximal nail fold. H6 demonstrates gemcitabine-induced onychomadesis, showing proximal separation of the nail plate from the nail bed. These images serve as educational examples of chemotherapy and anticonvulsant-associated dermatological side effects, illustrating diverse morphological changes in the nail unit including alterations in color (chromonychia), structure (dystrophy), and attachment (onychomadesis).
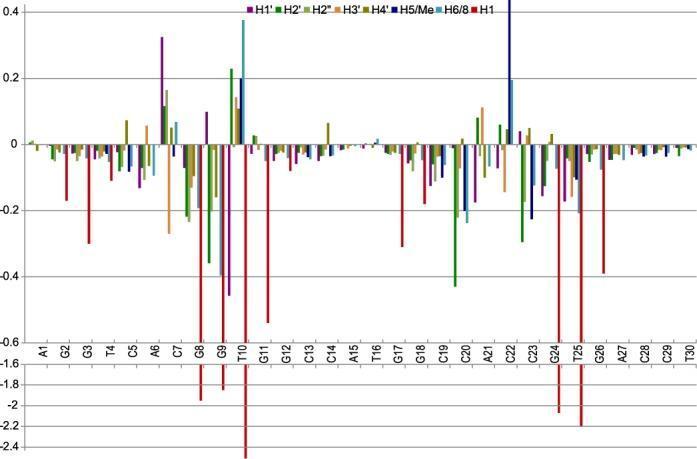
This Comparison Chart illustrates the chemical shift differences (Δδ, ppm) of DNA protons upon the binding of the anticancer bis-intercalator XR5944 to the TFF1-ERE (Estrogen Response Element) DNA duplex. The chart is a multi-series bar graph comparing various proton types (H1', H2', H2'', H3', H4', H5/Me, H6/8, and H1) across 30 residues of the DNA sequence (A1 through T30). The y-axis represents the magnitude and direction of the chemical shift difference, with negative values indicating upfield shifts due to ring-current effects from the intercalating drug. The H1 imino protons (represented by red bars) show the most significant negative shifts, particularly at residues G8, G9, T10, G24, T25, and G26, with some reaching as low as -2.4 ppm. These large shifts identify the primary drug intercalation sites within the TFF1-ERE sequence. Other sugar and base protons (H1' through H6/8) show smaller, variable shifts. This diagnostic data is used in structural biology and pharmacology to characterize drug-DNA binding modes and the influence of ERE spacer sequences on transcriptional inhibition in breast cancer research.
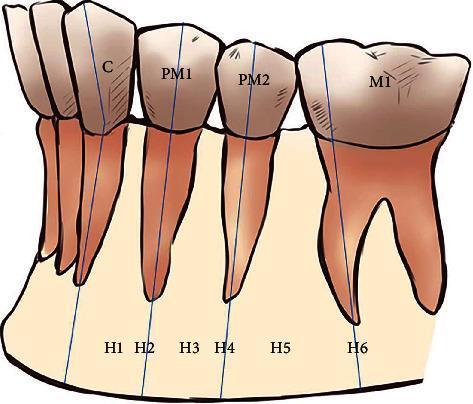
This anatomical diagram provides a schematic representation of the horizontal classification of the mental foramen (MF) position relative to the mandibular teeth, commonly used in maxillofacial radiology and surgical planning. The illustration depicts the left mandibular segment from the canine to the first molar. Six specific horizontal positions (H1–H6) are categorized based on their anterior-posterior relationship to the tooth axes: H1 is located between the canine (C) and first premolar (PM1); H2 aligns with the long axis of the PM1; H3 is positioned between the first and second premolars (PM2); H4 aligns with the long axis of the PM2; H5 is located between the PM2 and the first molar (M1); and H6 aligns with the mesial root of the M1. Blue vertical lines illustrate the long axes of the teeth to define these anatomical landmarks. This diagram serves as an educational tool for dental students and clinicians to understand the common anatomical variations of the mental nerve exit point, which is critical for local anesthesia and avoiding neurovascular injury during dental implantation or mandibular surgery.
Antihistaminic Drugs
Overview
Technically, all current H1 "antagonists" are inverse agonists - they reduce the constitutive (basal) activity of the H1 receptor and compete with histamine for binding, rather than being simple neutral antagonists.
- Goodman & Gilman's Pharmacological Basis of Therapeutics
Histamine Receptors at a Glance
| Receptor | Coupling | Key Effects |
|---|---|---|
| H1 | Gq → Phospholipase C | Smooth muscle contraction, vasodilation, increased capillary permeability, itch, bronchoconstriction |
| H2 | Gs → Adenylyl cyclase | Gastric acid secretion (principal effect), cardiac stimulation |
| H3 | Gi | Presynaptic autoreceptor; modulates neurotransmitter release in CNS |
| H4 | Gi | Immunomodulation, eosinophil chemotaxis |
Chemistry - General Structure
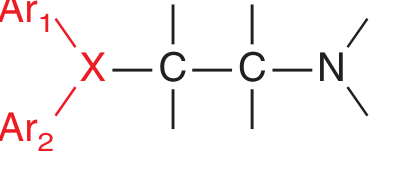
Classification
First-Generation H1 Antihistamines (Classical / Sedating)
Chemical Subclasses
| Subclass | Prototype Drug | Key Features |
|---|---|---|
| Ethanolamines | Diphenhydramine (Benadryl) | Most sedating; significant anticholinergic; used for motion sickness, anaphylaxis adjunct |
| Ethylenediamines | Pyrilamine (Mepyramine) | Relatively specific H1 action; low CNS effects but common GI side effects |
| Alkylamines | Chlorpheniramine | Among most potent H1 blockers; least sedating in this generation; more CNS stimulation |
| Piperazines | Hydroxyzine, Cyclizine, Meclizine | Hydroxyzine: long-acting, used for pruritus, anxiety, sedation; Meclizine/Cyclizine: anti-motion sickness |
| Phenothiazines | Promethazine | Prominent sedative and anticholinergic; most potent antiemetic; risk of fatal respiratory depression in children <2 years |
| Piperidines | Cyproheptadine | Unique: also antagonizes 5-HT2A (antiserotonin); stimulates appetite; used in migraine prophylaxis, carcinoid syndrome |
| Tricyclics | Doxepin | Primarily a tricyclic antidepressant; very potent H1 blocker; used topically for pruritus |
Second-Generation H1 Antihistamines (Non-Sedating / Selective)
| Drug | Subclass | Notes |
|---|---|---|
| Loratadine | Tricyclic piperidine | Minimal sedation; first truly non-sedating OTC agent |
| Desloratadine | Active metabolite of loratadine | Greater potency; once-daily dosing |
| Cetirizine | Piperazine (2nd gen) | Slightly more sedating than others in this group; mast cell-stabilizing and anti-inflammatory properties |
| Levocetirizine | Active enantiomer of cetirizine | Used at half the dose; less sedation |
| Fexofenadine | Piperidine | Active metabolite of terfenadine; no cardiac toxicity; least sedating |
| Azelastine | Intranasal/topical | Available as nasal spray and eye drops; some systemic sedation possible |
| Rupatadine | Piperidine | Also antagonizes PAF (platelet activating factor) |
| Bilastine | - | No CYP450 interactions; no QT prolongation |
Note on withdrawn drugs: Terfenadine and astemizole were removed from the market because they caused torsade de pointes (life-threatening ventricular arrhythmia) due to hERG K+ channel blockade - especially when combined with CYP3A4 inhibitors (e.g., ketoconazole, erythromycin).
H2 Receptor Antagonists
| Drug | Notes |
|---|---|
| Cimetidine | First H2 blocker; inhibits CYP450 - multiple drug interactions; anti-androgenic effects |
| Ranitidine | More potent than cimetidine; fewer drug interactions; withdrawn due to NDMA contamination concerns |
| Famotidine | Most potent; no CYP450 inhibition; no anti-androgenic effects |
| Nizatidine | Similar to ranitidine |
Pharmacological Effects of H1 Antagonists
- Smooth Muscle: Inhibit histamine-induced bronchoconstriction and intestinal muscle spasm; block vasodilation at higher histamine doses
- Capillary Permeability: Strongly block increased permeability, edema, and wheal formation
- Flare and Itch: Suppress the flare component of the triple response and itching from intradermal histamine
- Exocrine Glands: Do NOT suppress gastric secretion; antimuscarinic effects may reduce secretions in respiratory tract
- CNS (1st generation): Sedation, drowsiness, diminished alertness, impaired coordination; some cause CNS stimulation (alkylamines)
- Local Anesthesia: Some (e.g., promethazine, diphenhydramine) have local anesthetic activity by blocking Na+ channels
Therapeutic Uses
| Indication | Preferred Drug(s) |
|---|---|
| Allergic rhinitis | 2nd-gen: cetirizine, loratadine, fexofenadine |
| Urticaria / Pruritus | Hydroxyzine (1st gen); cetirizine, desloratadine |
| Anaphylaxis (adjunct) | Diphenhydramine or chlorpheniramine + epinephrine |
| Motion sickness | Diphenhydramine, meclizine, promethazine, scopolamine |
| Nausea / vomiting | Promethazine, cyclizine |
| Insomnia (OTC) | Diphenhydramine, doxylamine |
| Anxiety / sedation | Hydroxyzine |
| Appetite stimulation | Cyproheptadine |
| Allergic conjunctivitis | Azelastine (topical), alcaftadine |
| Peptic ulcer disease | H2 blockers (famotidine, cimetidine) |
| Common cold (symptomatic) | Chlorpheniramine in combination products |
Side Effects
First-Generation H1 Blockers
- CNS: Sedation, drowsiness, impaired cognitive function, paradoxical excitation (especially in children)
- Anticholinergic: Dry mouth, urinary retention, blurred vision, constipation, tachycardia
- GI: Nausea, vomiting, epigastric distress
- CVS: QT prolongation (terfenadine, astemizole - now withdrawn)
- Other: Promethazine - fatal respiratory depression in children <2 years; false-positive immunoassay screens for amphetamines, TCAs
Second-Generation H1 Blockers
- Minimal CNS and anticholinergic effects
- Cetirizine: slightly more sedating than other second-generation drugs
- Generally well-tolerated
Toxicity / Overdose
- CNS depression or stimulation (especially in children)
- Anticholinergic toxidrome: Hyperthermia, flushing, dry skin/mucosae, urinary retention, tachycardia, ileus
- Seizures
- Management: Supportive; physostigmine for severe anticholinergic syndrome (reversal agent)
Key Drug Interactions
- Cimetidine + many drugs: Inhibits CYP1A2, CYP2C9, CYP2D6, CYP3A4
- Old 2nd-gen antihistamines (terfenadine) + CYP3A4 inhibitors: Torsade de pointes
- 1st-gen antihistamines + CNS depressants (alcohol, opioids, benzodiazepines): Additive sedation
Sources
- Goodman & Gilman's The Pharmacological Basis of Therapeutics - Chapter 43 (Histamine, Bradykinin, and Their Antagonists)
- Tietz Textbook of Laboratory Medicine, 7th Edition - Antihistamines section
- Harrison's Principles of Internal Medicine 22E - Urticaria and Angioedema
Antiemetic drugs
vomiting center chemoreceptor trigger zone CTZ neurological pathway diagram antiemetic
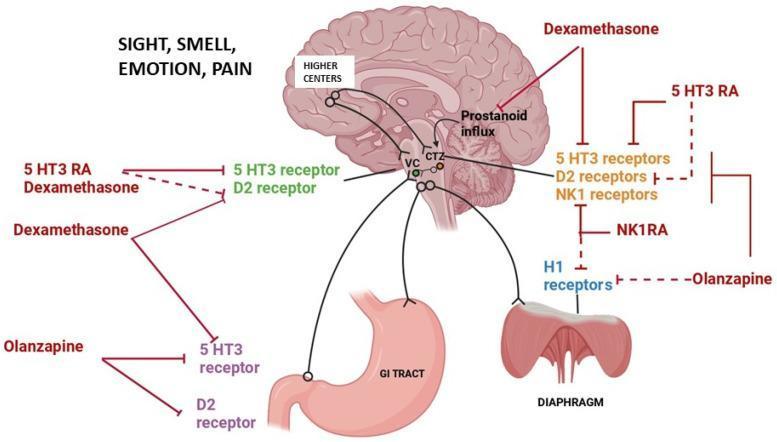
A pathophysiology diagram and pharmacological algorithm illustrating the mechanisms of chemotherapy-induced nausea and vomiting (CINV) and the corresponding sites of action for anti-emetic agents. The central anatomical figure is a sagittal section of the human brain, highlighting the Higher Centers (processing sensory/emotional stimuli), the Vomiting Center (VC) in the medulla, and the Chemoreceptor Trigger Zone (CTZ). Neural pathways connect these central regions to peripheral effectors including the GI tract and the diaphragm. The diagram maps specific drug classes to their molecular targets: 5-HT3 Receptor Antagonists (5-HT3 RA), NK1 Receptor Antagonists (NK1RA), Dexamethasone, and Olanzapine. These agents are shown inhibiting various receptors including 5-HT3, D2 (dopamine), NK1 (neurokinin-1), and H1 (histamine) receptors within the CTZ and peripheral pathways. Dexamethasone is specifically noted for its role in inhibiting prostanoid influx. Solid red lines represent predominant mechanisms of action, while dashed lines indicate minor pathways. This educational visual summarizes multi-receptor antagonism strategies used in clinical oncology to manage nausea and vomiting reflexes.
A pathophysiology diagram illustrating four biochemical pathways (a-d) for coelenterazine (CTZ)-dependent bioluminescence, commonly used as reporters in biomedical research. (a) Classic luciferase (Luc) pathway: CTZ reacts with O2 and Luc to produce coelenteramide (CTM), CO2, and blue light. (b) Photoprotein (PhP) pathway: apophotoprotein (apoPhP) and O2 form a stable 2-hydroperoxycoelenterazine complex (PhP), which triggers upon binding Calcium (Ca2+) to release CTM, CO2, and blue light. (c) Coelenterazine-binding protein (CBP) pathway: CTZ binds to apoCBP; in the presence of Ca2+ and Luc, it undergoes oxidation to yield light. (d) ROS-sensitive pathway: apo-Pholasin and dehydro-CTZ form a complex that reacts with Reactive Oxygen Species (ROS) to produce blue light. The diagram also indicates that blue light emission can interact with Green Fluorescent Protein (GFP) via Bioluminescence Resonance Energy Transfer (BRET) to produce green light. These systems serve as essential tools in molecular imaging for monitoring intracellular calcium, gene expression, and protein-protein interactions.
This medical illustration features a T1-weighted sagittal MRI of the human brain overlaid with a diagram of the central regulation of respiratory function. The graphic outlines two primary suprapontine pathways: the 'Volitional control' pathway (originating from the motor cortex, SMA, and thalamus/hypothalamus) and the 'Cortico-limbic pathway' (originating from the insula, amygdala, and hippocampus), both descending toward the brainstem. Within the pons, the Pontine Respiratory Group (PRG) is highlighted, comprising the Pneumotaxic center (responsible for respiratory phase transition) and the Apneustic center (a stimulator promoting inspiration). These centers exert fine-tuning over the medullary respiratory groups. In the medulla, the illustration identifies the Dorsal Respiratory Group (DRG), which integrates peripheral chemoreceptor information, and the Ventral Respiratory Group (VRG), specifically noting the PreBötzinger complex as the central pattern generator. The diagram effectively illustrates the hierarchical neuroanatomical structure of breathing regulation, from cortical modulation to autonomic brainstem control.
Examples