Comprehensive Review of Pulse oximetry and its role in Anaesthesia & critical care
Reading File
Finding Sources
Finding Sources
Searching PubMed
pulse oximetry anaesthesia critical care
Reading File
Reading File
Reading File
Reading File
Finding Sources
Finding Sources
Reading File
Finding Sources
Finding Sources
Searching Images
pulse oximetry principle Beer Lambert law hemoglobin absorption wavelength
Reading File
Loading Image
Loading Image
Reading File
Finding Sources
Reading File
Finding Sources
Searching PubMed
pulse oximetry accuracy racial disparity hidden hypoxemia
Reading File
Searching PubMed
pulse oximetry hidden hypoxemia skin pigmentation
Reading File
Loading Image
This comprehensive review covers all major aspects of pulse oximetry relevant to anaesthesia and critical care practice, synthesised from leading textbooks and current literature. Here's what was covered:
Structure of the review:
- Historical Background — ASA 1986 mandate, WHO/WFSA standards, closed-claims evidence
- Physiologic Fundamentals — O₂ content equation, haemoglobin species, the oxydissociation curve
- Principles of Operation — Lambert-Beer law, AC/DC signal processing, the R-ratio and calibration curve (with diagrams), transmittance vs. reflectance modes
- Anaesthesia Applications — Mandatory monitoring, MAC sedation, endobronchial intubation detection, SpO₂ targets
- Photoplethysmography — PVI for fluid responsiveness, Perfusion Index, goal-directed fluid therapy
- Limitations & Errors — Full error table, dysfunctional haemoglobins in depth (COHb, MetHb, SHb), perfusion-dependent failure, accuracy at low saturations, racial bias/skin pigmentation (emerging evidence)
- Critical Care Role — ICU monitoring, oxygenation targets, SvO₂/ScvO₂, remote monitoring (post-COVID)
- Multi-wavelength Co-oximetry — SpCO, SpMet, SpHb; pulse spectroscopy
- Cerebral NIRS — Cardiac surgery, carotid endarterectomy
- Probe Selection — Site-specific advantages; forehead preference in vasoconstriction
- Clinical Pearls — 10 high-yield practice points
Act like a professor in Anesthesia & critical care - nowTeach me pulse oximetry topic with More details
Checking Date & Time
Finding Sources
Finding Sources
Finding Sources
Reading File
Reading File
Finding Sources
Loading Image
Finding Sources
Finding Sources
Reading File
Loading Image
Loading Image
Loading Image
Loading Image
Excellent. All the key diagrams are in. Now I'll deliver the full professor-style lecture.
🎓 LECTURE: Pulse Oximetry — A Complete Professor-Level Teaching Session
Department of Anaesthesia & Critical Care
Welcome. Today we are going to master pulse oximetry — not just as a gadget you clip onto a finger, but as a physiological instrument with deep physics, well-defined failure modes, and advanced hemodynamic applications. By the end of this session you will be able to explain every number and waveform it generates, predict exactly when it will lie to you, and use it at an expert level in theatre and intensive care.
PART 1 — WHY THIS MONITOR MATTERS: A HISTORICAL PERSPECTIVE
Before pulse oximetry became routine in the mid-1980s, unrecognised hypoxaemia during anaesthesia was a major cause of preventable death and brain injury. The ASA closed-claims database repeatedly showed that respiratory events were the single largest source of adverse anaesthetic outcomes. Cyanosis — the clinical sign of hypoxia — is not detectable until SpO₂ drops below roughly 80%, meaning the patient is already critically hypoxic by the time you see it.
Takuo Aoyagi, a Japanese engineer, developed the concept of pulse oximetry in 1972, exploiting the fact that pulsatile arterial blood could be distinguished from static tissue optically. The first commercial devices appeared in the early 1980s. By 1986, the ASA mandated it for all anaesthetics. The WHO and WFSA subsequently adopted it as a global minimum monitoring standard.
Think about that: this single monitor, costing less than $200 today, transformed anaesthetic safety in a way that no drug ever has.
PART 2 — THE ESSENTIAL PHYSIOLOGY YOU MUST OWN
2.1 Oxygen Delivery — Why SaO₂ Is Everything
Oxygen delivery to tissues (DO₂) is:
DO₂ = CO × CaO₂
And CaO₂ (arterial oxygen content) is:
CaO₂ = (1.34 × Hb × SaO₂) + (0.0031 × PaO₂)
- The Hüfner constant (1.34 mL/g) is the O₂-carrying capacity of haemoglobin per gram. Theoretically 1.39, but experimentally 1.31–1.37 because of small amounts of non-functional Hb species in real blood.
- The dissolved O₂ term (0.0031 × PaO₂) is negligible under normal conditions — roughly 0.3 mL/dL at a PaO₂ of 100 mmHg. It becomes relevant only during hyperbaric oxygen therapy.
The critical teaching point: You can have a normal SpO₂ and still have catastrophically low oxygen delivery if:
- The patient is severely anaemic (low Hb — the multiplier)
- Cardiac output is critically low
- Dysfunctional Hb species are present (COHb, MetHb — which are "counted" by the oximeter but cannot carry O₂)
SpO₂ tells you the saturation fraction — it says nothing about the denominator (Hb) or the multiplier (CO).
2.2 Haemoglobin Species — Know All Five
| Species | Can Carry O₂? | Normal % | Clinical Relevance |
|---|---|---|---|
| Oxyhaemoglobin (O₂Hb) | ✅ | ~97% | The functional molecule |
| Deoxyhaemoglobin (deO₂Hb) | ✅ (unloaded) | ~2–3% | Increases in hypoxia |
| Carboxyhaemoglobin (COHb) | ❌ | 1–3% (smokers up to 10%) | CO poisoning — falsely elevates SpO₂ |
| Methaemoglobin (MetHb) | ❌ (very high affinity, won't release) | < 1% | Drug-induced — pulls SpO₂ toward 85% |
| Sulphaemoglobin (SHb) | ❌ | < 1% | Irreversible; pulls SpO₂ toward 85% |
Functional SaO₂ (what pulse oximetry measures):
= O₂Hb ÷ (O₂Hb + deO₂Hb) × 100
Fractional SaO₂ (what a lab co-oximeter measures — the gold standard):
= O₂Hb ÷ (O₂Hb + deO₂Hb + COHb + MetHb + SHb) × 100
A smoker with COHb of 10%: lab fractional SaO₂ might be 89%, but the pulse oximeter reports 99% — because it ignores the COHb. This is a life-threatening false negative.
2.3 The Oxyhaemoglobin Dissociation Curve — Master This
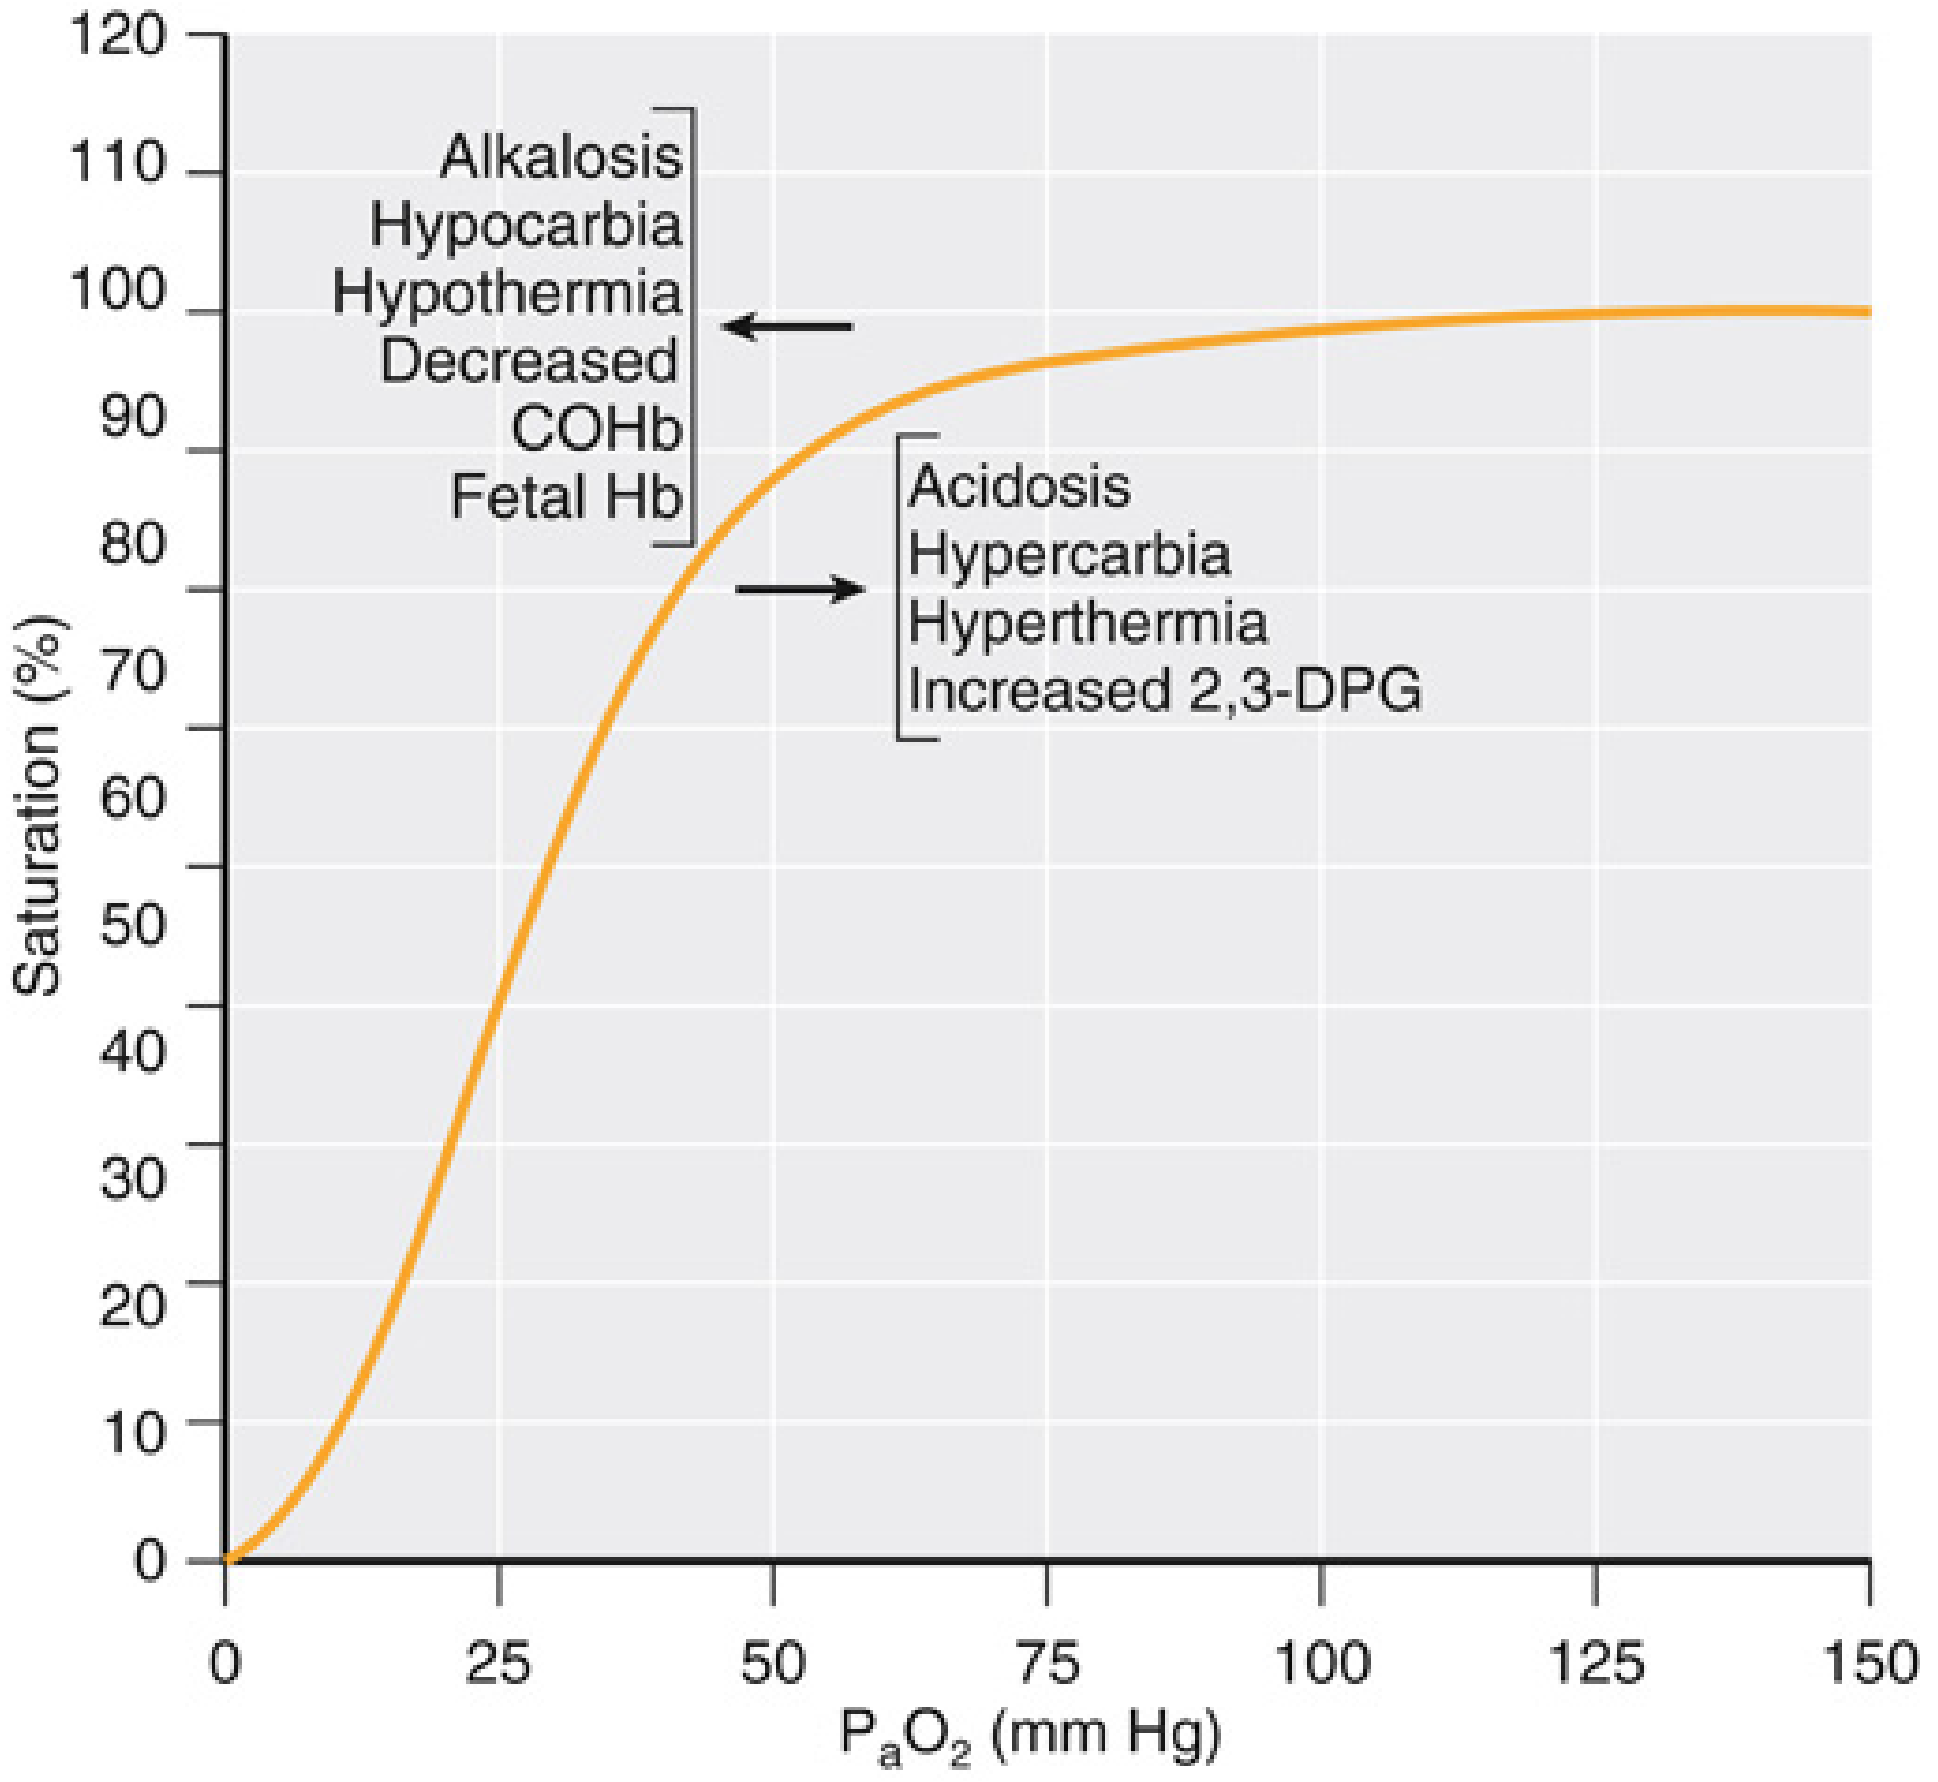
Fig 37.2 — Miller's Anesthesia 10e: The oxyhaemoglobin dissociation curve and its shifting factors
The curve is sigmoid (S-shaped) for good physiological reasons:
The flat upper portion (PaO₂ > 70 mmHg):
- A large fall in PaO₂ (e.g., 150 → 100 → 70 mmHg) causes only a tiny fall in SpO₂
- This protects against minor ventilation impairment
- Clinical trap: SpO₂ cannot detect hyperoxia. On 100% FiO₂, a patient might have PaO₂ of 500 mmHg — you cannot see this on the pulse oximeter. In neonates and premature infants, this is how retinopathy of prematurity develops
- The pulse oximeter will not warn you when PaO₂ rises dangerously high on supplemental oxygen
The steep portion (PaO₂ < 60 mmHg):
- Small falls in PaO₂ cause large falls in SaO₂ — the "cliff edge"
- At the inflection point around PaO₂ 60 mmHg → SpO₂ ≈ 90% — this is the critical threshold
- Below this, the patient falls off the cliff rapidly
P50 = PaO₂ at which haemoglobin is 50% saturated. Normal = 26 mmHg. This is the standard measure of curve position.
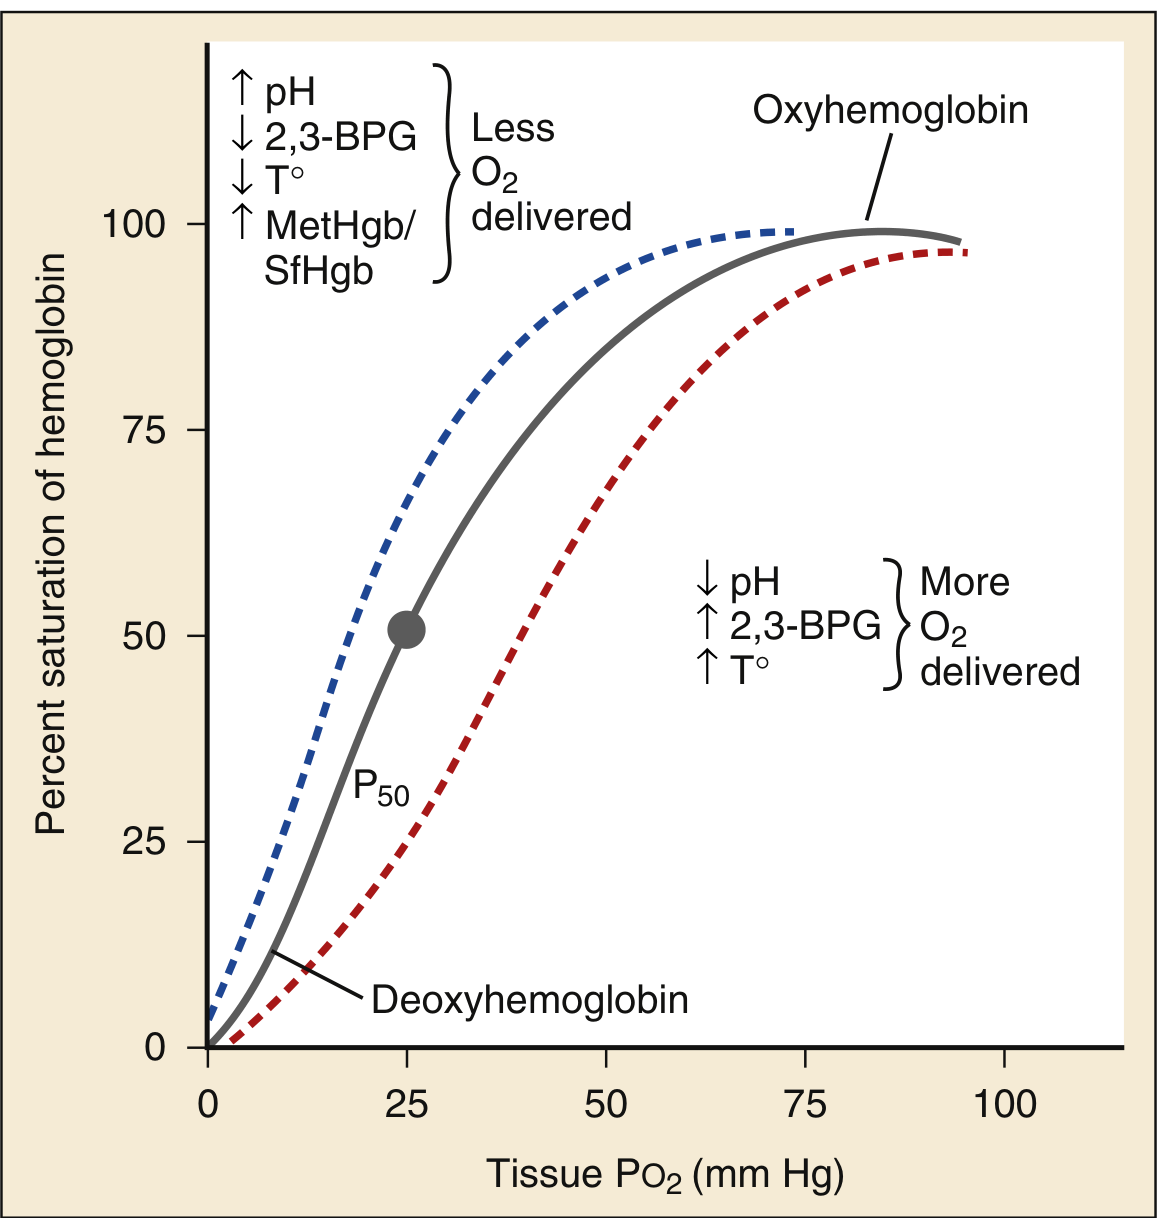
Hb-O₂ dissociation curve with physiological shifting factors — Rosen's Emergency Medicine
Right shift (↑P50 — more O₂ released to tissues):
- ↓pH (acidosis), ↑PaCO₂ (hypercarbia), ↑temperature, ↑2,3-DPG
- This is the Bohr effect — exercising muscle creates an acid environment that promotes O₂ unloading. Elegant physiology.
Left shift (↓P50 — less O₂ released to tissues):
- ↑pH (alkalosis), ↓PaCO₂, ↓temperature, ↓2,3-DPG, fetal Hb, COHb
- During hypothermic bypass: the curve shifts left — haemoglobin clings to oxygen and doesn't release it to tissues easily. Metabolic rate is also reduced, so this is less of a problem — but it matters when interpreting SvO₂
MetHb and SHb shift the curve left — they have extremely high O₂ affinity and won't release O₂ to tissues. This is why methaemoglobinaemia causes tissue hypoxia even when "SpO₂" looks acceptable.
PART 3 — THE PHYSICS: HOW THE MACHINE ACTUALLY WORKS
3.1 The Beer–Lambert Law
The physical foundation is the Beer–Lambert Law:
I_trans = I_in × e^(−ε × C × D)
Where:
- I_trans = transmitted light intensity
- I_in = incident light intensity
- ε = extinction coefficient (how strongly the solute absorbs light at that wavelength — unique for each molecule)
- C = concentration of solute
- D = path length through the solution
If you know ε (from published absorption spectra), D (path length through the tissue), and measure I_trans/I_in, you can calculate C (concentration of the solute).
For multiple solutes, you need measurements at multiple wavelengths — at least as many wavelengths as solutes you want to measure. A standard two-wavelength pulse oximeter can only distinguish two Hb species. A lab co-oximeter uses 4–7 wavelengths. Rainbow multi-wavelength oximeters use up to 12.
3.2 The Two Wavelengths — Why 660 nm and 940 nm?
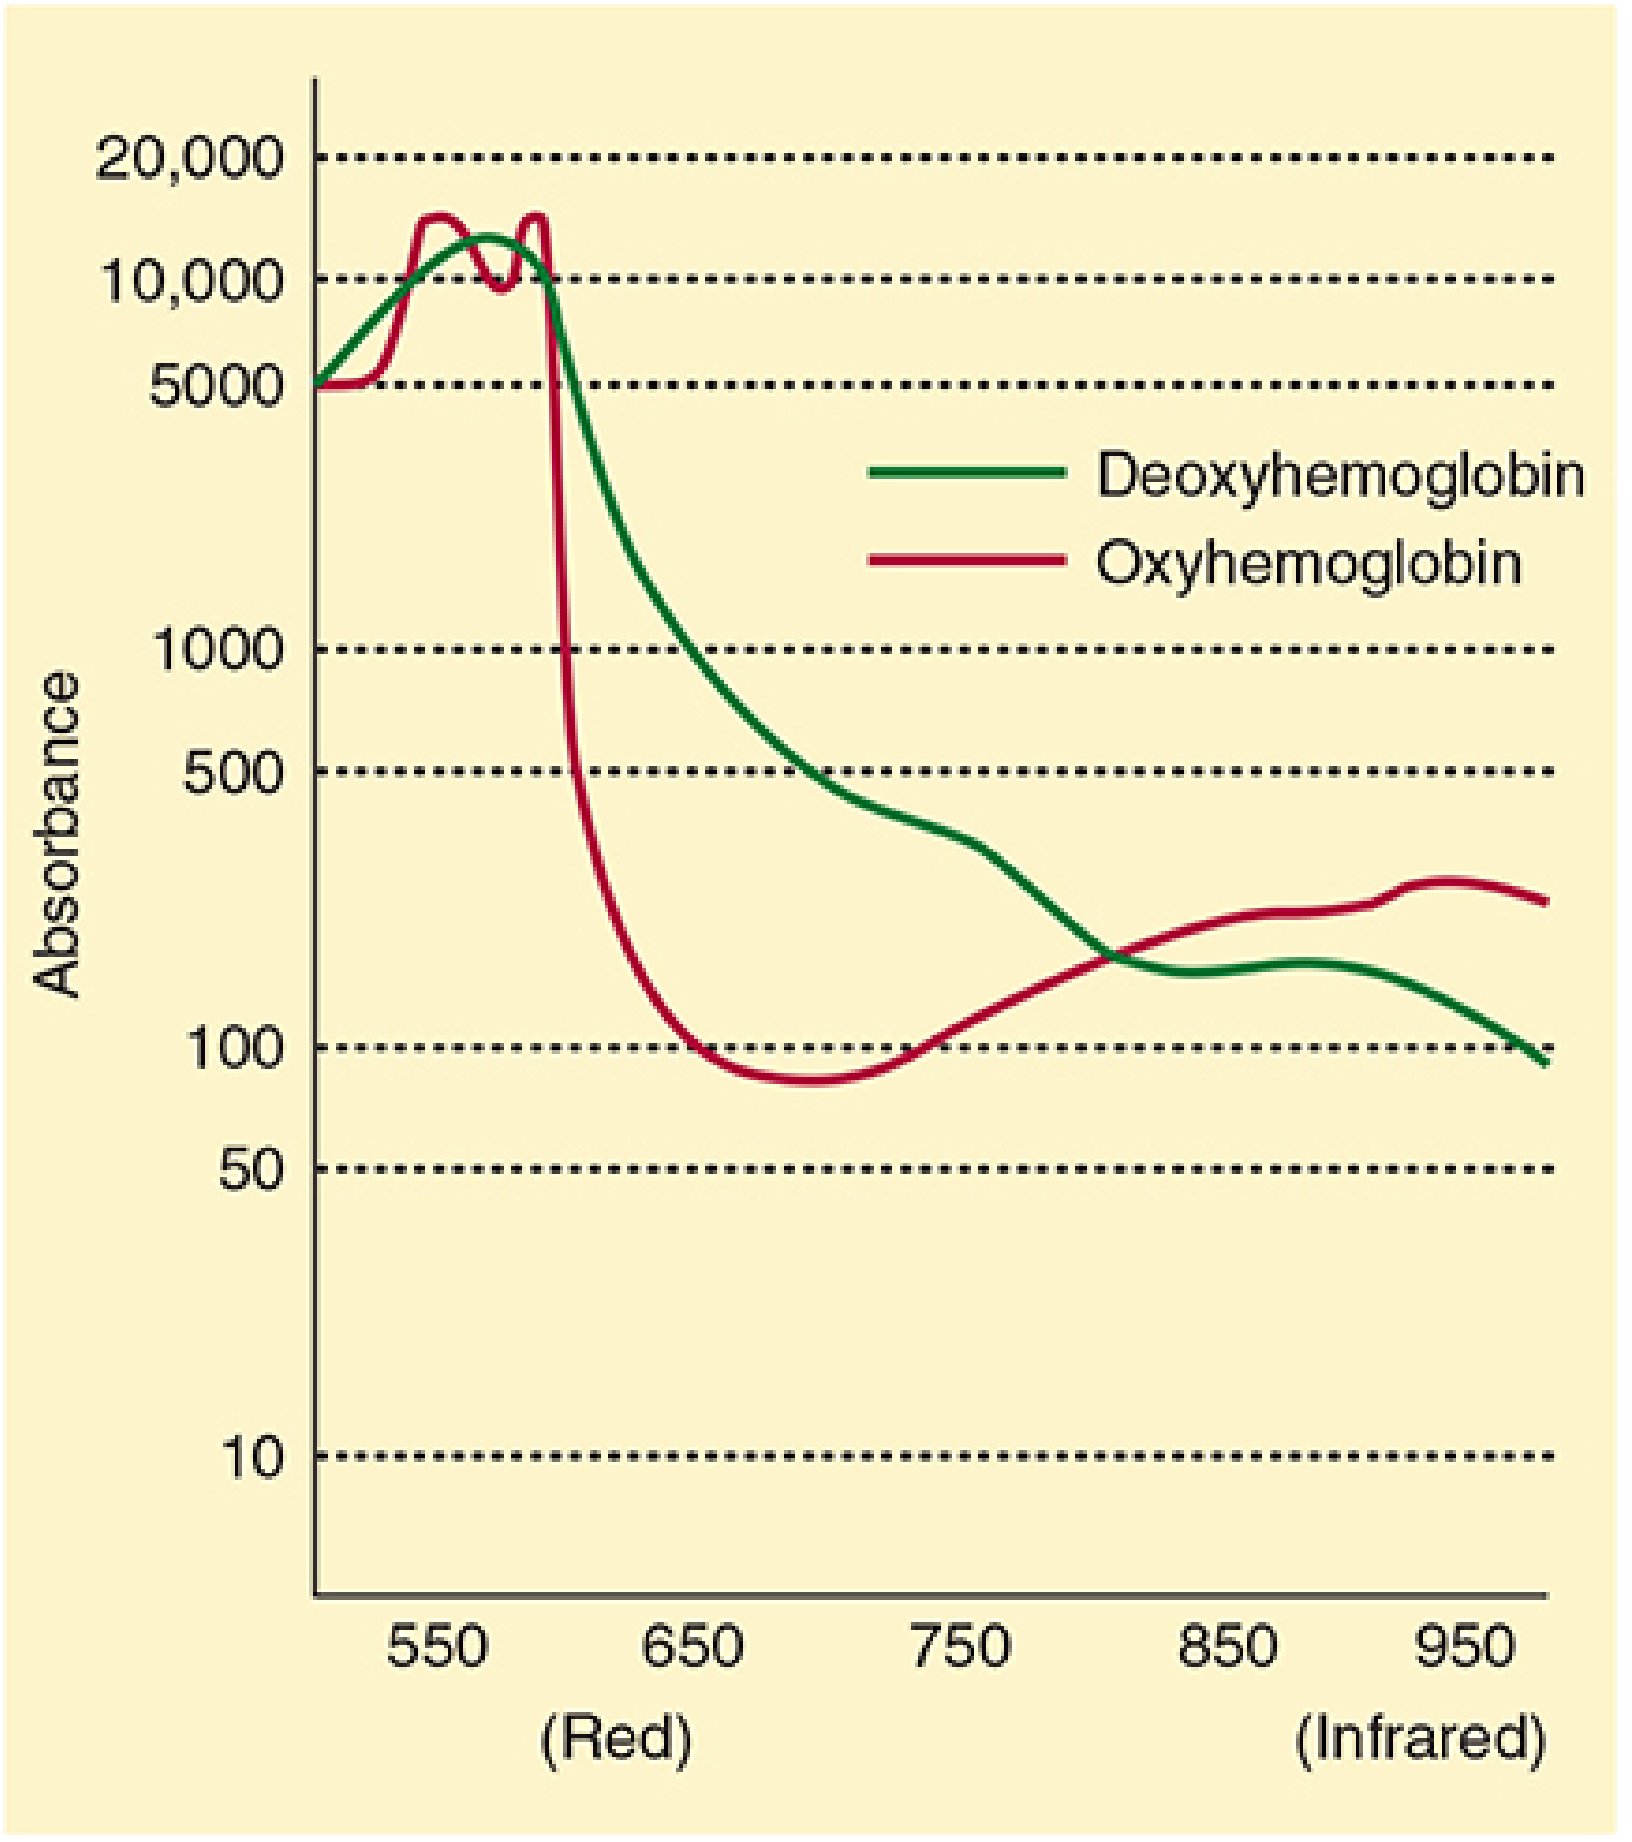
Differential absorption of OxyHb vs DeoxyHb — Morgan & Mikhail 7e, Fig 6–2
Look at this absorption spectrum carefully:
- At 660 nm (red): DeO₂Hb absorbs far more than O₂Hb → deoxygenated blood absorbs red light heavily → appears blue/cyanotic to the naked eye
- At 940 nm (infrared): O₂Hb absorbs more than deO₂Hb → oxygenated blood absorbs more infrared
- There is an isosbestic point around 805 nm where both species absorb equally — at this wavelength, absorption is independent of oxygen saturation
The wavelengths 660 nm and 940 nm are chosen because the difference in extinction coefficients between O₂Hb and deO₂Hb is maximal at these points — maximising the signal-to-noise ratio of the measurement.
Now look at the full five-species absorption spectra:
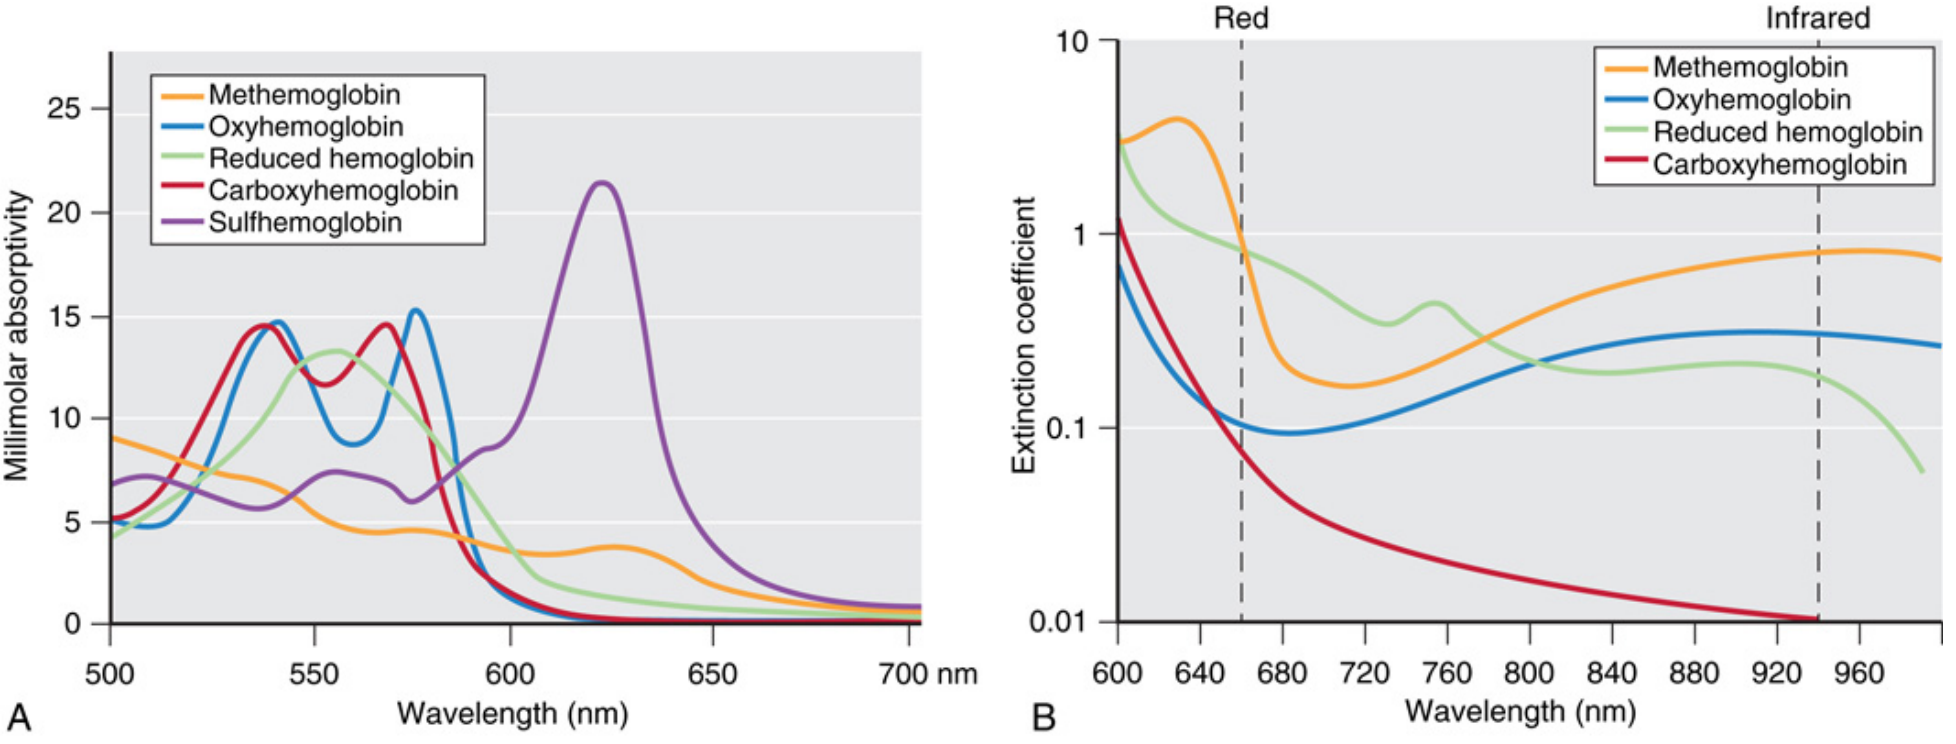
Fig 37.3A/B — Miller's Anesthesia 10e: Full absorption spectra of all five Hb species. Panel B shows the two operating wavelengths (dashed lines) where COHb and MetHb interference becomes evident
Panel B is the clinically critical one. Look at the 660 nm line:
- COHb (red) and O₂Hb (blue) have very similar extinction coefficients → the oximeter cannot tell them apart → CO poisoning is invisible to a standard pulse oximeter
- MetHb (orange) has significant absorption at both 660 nm and 940 nm → it corrupts both channels equally → R approaches 1.0 → SpO₂ reads 85% regardless of true saturation
3.3 The AC/DC Trick — How It Isolates Arterial Blood
This is the most elegant part of the physics. The probe emits light through perfused tissue. What does that light pass through?
- Skin, fat, bone, muscle (constant, non-pulsatile)
- Venous blood (constant, non-pulsatile under normal conditions)
- Capillary blood (largely constant)
- Arterial blood (pulsatile with every heartbeat)
The oximeter divides the light absorption signal into:
- DC component = the constant background (all non-arterial tissue + venous blood)
- AC component = the pulsatile change caused by each arterial pulse
By taking the ratio of AC to DC at each wavelength, the DC background cancels out. What remains is a signal representing only the arterial blood.
The R ratio is then calculated:
R = (AC₆₆₀ / DC₆₆₀) ÷ (AC₉₄₀ / DC₉₄₀)
This ratio is then converted to SpO₂ using the manufacturer's internal empirical calibration curve:
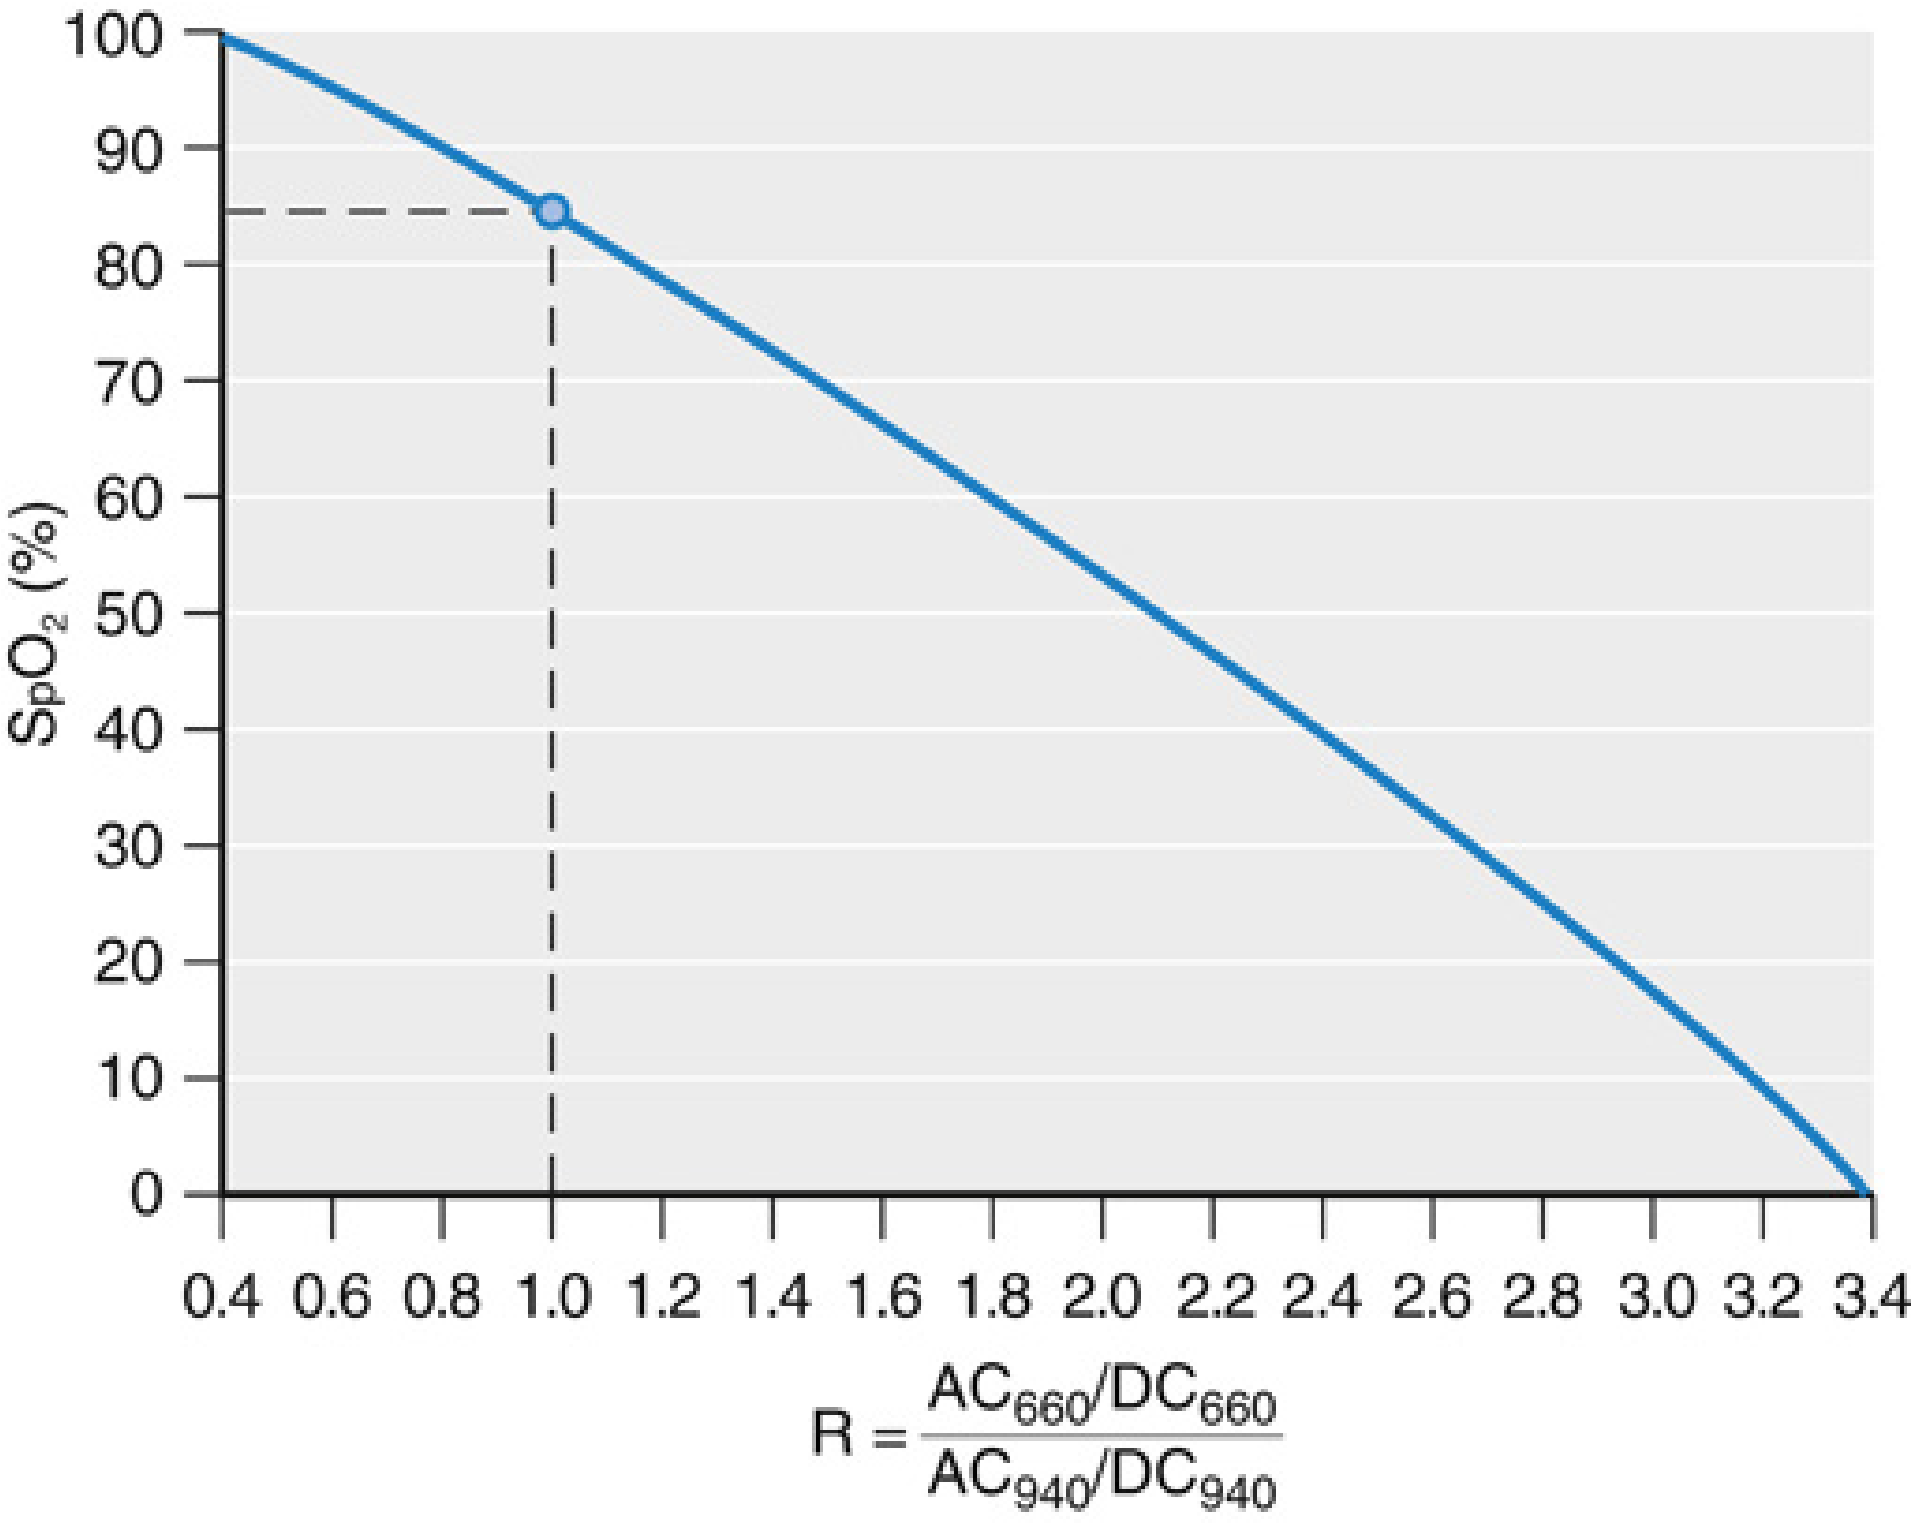
Fig 37.5 — Miller's Anesthesia 10e: Calibration curve. The critical point — when R = 1 (equal absorption at both wavelengths), SpO₂ reads exactly 85%
How the calibration curve is built: Volunteers breathe progressively hypoxic gas mixtures while simultaneous SpO₂ (pulse oximeter) and SaO₂ (arterial blood gas co-oximetry) are measured. The R:SaO₂ relationship is mapped across the range 70–100% and stored in the device. The FDA requires root mean square accuracy ≤ 3.0% over this range.
Critical implication: Below 70%, the device is extrapolating outside its calibration range. Accuracy is completely unreliable below 70% SaO₂. This is also why the machine was never calibrated to detect hyperoxia — nobody made volunteers breathe 100% O₂ to map that range.
3.4 Hardware: What the Probe Contains
A standard finger probe contains:
- Two LEDs (Light Emitting Diodes) at 660 nm and 940 nm
- One photodiode (photodetector) on the opposite side of the finger
- A microprocessor cycles each LED on and off in sequence. When both are off, ambient light is measured and subtracted — this is how the oximeter rejects overhead lighting artefact
Transmittance mode (standard): LEDs and detector are on opposite sides of the tissue (finger, toe, earlobe). Light passes through the tissue.
Reflectance mode (forehead probe): LEDs and detector are on the same side. The detector captures backscattered light. Used when transmittance sites are inaccessible or vasoconstricted.
PART 4 — THE OUTPUT: WHAT THE MONITOR DISPLAYS AND WHAT IT REALLY MEANS
4.1 The SpO₂ Number
SpO₂ = peripheral oxygen saturation estimated by pulse oximetry. It estimates functional SaO₂.
Accuracy under normal conditions: ±2–3% (FDA-mandated RMSE ≤ 3.0%)
What this means in practice: An SpO₂ of 95% means the true SaO₂ is somewhere between 92% and 98% with 95% confidence. When you are treating the patient at the borderline, this uncertainty matters.
Important SpO₂ landmarks to memorise:
| SpO₂ | Approximate PaO₂ | Clinical Meaning |
|---|---|---|
| 100% | > 150 mmHg | Hyperoxia possible — cannot detect |
| 97–98% | ~100 mmHg | Normal |
| 95% | ~80 mmHg | Acceptable minimum most adults |
| 93% | ~70 mmHg | Low — action warranted |
| 90% | ~60 mmHg | Critical threshold — "cliff edge" |
| 85% | ~50 mmHg | Severe hypoxaemia — OR — MetHb/SHb artefact |
| 80% | ~45 mmHg | Cyanosis clinically visible |
| < 70% | < 40 mmHg | Device accuracy collapses |
The relationship between SpO₂ and PaO₂ is not fixed — it depends on where the patient sits on their own dissociation curve, which is shifted by pH, temperature, PaCO₂, and 2,3-DPG.
4.2 The Plethysmographic Waveform — Your Second Data Stream
The photoplethysmograph (PPG) waveform is the pulse oximeter's second output and is underused by most clinicians.
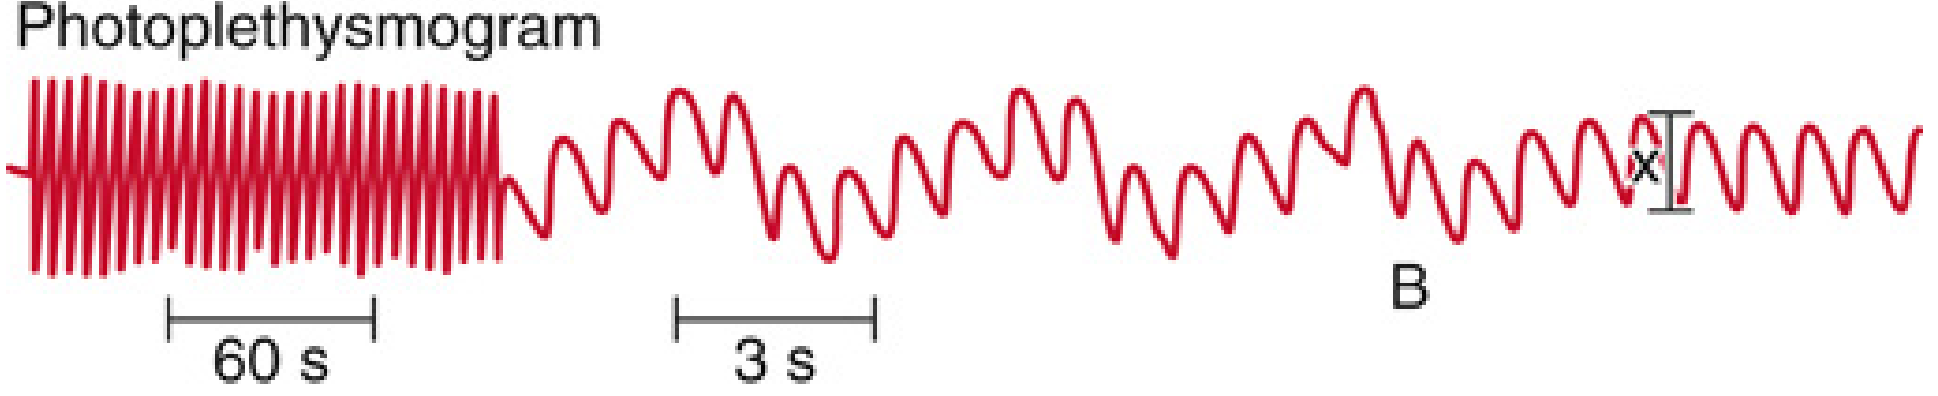
Fig 37.6 — Miller's Anesthesia 10e: Photoplethysmogram demonstrating respiratory waveform variation. At time B, ventilation stops — the variation disappears. This is the physiological basis of PVI and fluid responsiveness prediction
What the waveform shows:
- Amplitude = pulse pressure / peripheral vascular tone. Tall waves = good perfusion. Low amplitude = vasoconstriction or low stroke volume
- Regularity = rhythm. Irregular waveform → arrhythmia
- Respiratory variation (ΔPOP) = the amplitude varies with each breath during mechanical ventilation because of cyclical changes in venous return and stroke volume. This is the plethysmography variability index (PVI).
4.3 PVI and Fluid Responsiveness — Advanced Application
The physiological mechanism:
During positive pressure inspiration, intrathoracic pressure rises → venous return falls → right ventricular preload falls → after a lag of 2–3 heartbeats → left ventricular stroke volume falls → pulse pressure falls → PPG amplitude falls.
During expiration, the reverse happens.
If the patient's ventricle is preload-dependent (on the steep part of the Frank-Starling curve), this respiratory swing in stroke volume is large — high PVI → fluid responsive.
If the ventricle is preload-independent (on the plateau), the respiratory swing is small — low PVI → not fluid responsive.
PVI formula:
PVI (%) = [(PPG_max − PPG_min) ÷ PPG_max] × 100
Threshold: PVI > 13–15% generally predicts fluid responsiveness in mechanically ventilated patients
Prerequisites for valid PVI measurement:
- Controlled mechanical ventilation (not spontaneous breathing — patient effort overrides the signal)
- Sinus rhythm (arrhythmias corrupt the respiratory vs. cardiac signal separation)
- Tidal volume ≥ 8 mL/kg (smaller tidal volumes generate smaller respiratory swings — false negatives)
- No severe vasodilation (septic shock can produce venous pulsations that corrupt the DC component)
Goal-directed therapy using PVI in major abdominal surgery has been shown to improve outcomes — reduced postoperative complications, shorter hospital stay. — Miller's Anesthesia 10e, p. 5461
4.4 Perfusion Index (PI)
PI = AC amplitude ÷ DC component × 100 (%)
It is a continuous, non-invasive estimate of peripheral vascular tone.
- Normal PI: 1–10%
- Low PI (< 1%): peripheral vasoconstriction — shock, hypothermia, high-dose vasopressors, patient cold and clammy
- High PI (> 4%): peripheral vasodilation — warm sepsis, epidural, sympatholysis, high ambient temperature
Clinical uses:
- Predicting hypotension after spinal anaesthesia: a PI that rises after spinal block onset indicates vasodilation before blood pressure falls — gives a 1–2 minute warning
- Monitoring vasopressor effect: PI should rise as vasopressors take effect and redirect blood to periphery (actually reflects reversal of peripheral shutdown)
- Identifying poor probe signal: PI < 0.3% → SpO₂ reading unreliable
PART 5 — LIMITS OF THE TECHNOLOGY: WHERE IT FAILS YOU
5.1 The "85% Trap" — Two Scenarios Where You Must Think
When SpO₂ reads exactly or near 85%, think of three things:
- True SaO₂ of 85% (the patient is severely hypoxaemic)
- Methaemoglobinaemia — MetHb absorbs equally at 660 and 940 nm → R = 1 → machine reads 85%
- Optical shunt — probe is misplaced and direct LED light reaches the photodetector without passing through tissue → also reads 85%
How to distinguish: Apply 100% O₂. If SpO₂ rises toward 100%, it was true hypoxaemia. If SpO₂ stays stubbornly at 85% despite high FiO₂, suspect MetHb or probe fault. Check ABG with co-oximetry.
5.2 Carbon Monoxide Poisoning — The Invisible Killer
COHb absorbs 660 nm light almost identically to O₂Hb. At 940 nm, COHb absorbs virtually nothing.
Result: The oximeter sees COHb as O₂Hb → SpO₂ appears near normal.
Example: Patient with 40% COHb → fractional SaO₂ is ~57%, but the oximeter reads ~97%.
You must never use pulse oximetry alone to rule out CO poisoning. Always use ABG with co-oximetry (or bedside multi-wavelength oximetry with Rainbow technology) in:
- House fires
- Enclosed space events
- Unexplained altered consciousness
- Any patient with headache, nausea and flu-like symptoms
5.3 Venous Pulsations — An Underappreciated Error
The AC/DC separation works because veins are assumed non-pulsatile. This breaks down in:
- Severe tricuspid regurgitation — the right atrial backpressure transmits to peripheral veins, making them pulsatile
- Tight probe placement — occludes venous outflow, creating pulsatile venous pressure
- Trendelenburg position with forehead probe — dependent venous congestion produces venous pulsation
- Distributive shock — extreme vasodilation produces arteriovenous shunting where venous blood becomes pulsatile
Effect: The device includes venous (desaturated) blood in its "arterial" signal → falsely low SpO₂ reading
5.4 Motion Artefact
Motion creates unpredictable changes in the light path through tissue, generating AC signals unrelated to arterial pulsation. The oximeter's algorithm interprets this as a low-perfusion or low-saturation state.
Modern devices use advanced signal processing (e.g., Masimo SET — Signal Extraction Technology) that employs adaptive filtering to separate genuine arterial pulsation from motion noise. Masimo's algorithm builds a reference signal from motion using a third detector and subtracts it. This is why "Masimo" oximeters perform significantly better in patients who are moving, shivering, or being transported.
During shivering in PACU, a standard oximeter may alarm continuously and give false SpO₂ values. This is clinically important because it leads to alarm fatigue.
5.5 Low Perfusion States
At systolic BP < 80 mmHg, the AC component of the pulse oximetry signal diminishes critically — the device cannot identify a reliable pulse → absent or inaccurate readings.
Solutions:
- Move to a central site: earlobe or forehead probe — the arterial supply to these areas is less catecholamine-responsive than fingers
- Earlobe: superficial temporal artery territory — relatively vasodilation-resistant
- Forehead (reflectance probe): supratrochlear and supraorbital arteries — similarly preserved in shock
- In patients on high-dose vasopressors (noradrenaline, vasopressin), finger probes often fail — switch to earlobe or forehead
5.6 Complete Summary of Artefacts
| Source | Mechanism | Effect on SpO₂ |
|---|---|---|
| CO poisoning | COHb absorbs 660 nm like O₂Hb | Falsely ↑↑ (near normal) |
| Methaemoglobinaemia | Equal absorption both channels → R→1 | Pulled toward 85% |
| Sulphaemoglobinaemia | Similar to MetHb | Pulled toward 85% |
| Optical shunt | Direct LED-to-detector light | Reads 85% |
| Methylene blue | Peak absorption 668 nm (near HHb) | Marked transient ↓ to ~65% |
| Indocyanine green (ICG) | Mild 660 nm absorption | Mild ↓ |
| Hypotension / low flow | AC signal lost | Absent reading or ↓ |
| Motion | Corrupted AC signal | Variable, usually ↓ |
| Venous pulsations | Venous blood enters AC signal | ↓ |
| Black/dark nail polish | Absorbs 660 nm | ↓ (usually <2%) |
| Dark skin (SaO₂ < 80%) | Melanin alters optical path | Falsely ↑ (hidden hypoxaemia) |
| IABP (balloon pump) | Extra mechanical pulsations | ↑ (falsely elevated) |
| Sickle cell disease | Elevated COHb from haem turnover | May ↑ during vaso-occlusive crisis |
| Severe anaemia | Reduced AC signal | ↓ in hypoxia |
| Infrared navigation (neurosurgery) | External IR source corrupts 940 nm | ↓ or signal loss; shield with foil |
| Continuous-flow LVAD | No pulsatility → no AC signal | Device fails entirely |
| Fetal Hb | Not a significant error — accuracy preserved | Minimal effect |
5.7 The Racial Bias Issue — Modern Critical Awareness
This is a recently spotlighted clinical problem with major ethical implications.
The mechanism: At SaO₂ > 80%, skin melanin does not significantly affect SpO₂ accuracy. At SaO₂ < 80%, melanin alters the optical properties of the tissue in a way that makes the oximeter overestimate true saturation. The calibration curves were developed using predominantly light-skinned volunteers.
The consequence: Black patients with respiratory failure have a significantly higher prevalence of occult (hidden) hypoxaemia — meaning they are genuinely hypoxaemic (true SaO₂ below threshold) but their SpO₂ reads acceptably. This leads to delayed recognition, delayed treatment, and worse outcomes.
Studies during the COVID-19 pandemic quantified this: Black patients were more likely to receive delayed eligibility determination for supplemental oxygen therapy based on SpO₂ targets.
What to do: In any patient with darker skin pigmentation who has unexplained deterioration or in whom clinical findings don't match the SpO₂ reading — check an ABG with co-oximetry. Do not rely on SpO₂ alone.
PART 6 — PULSE OXIMETRY IN SPECIFIC CLINICAL SETTINGS
6.1 Intraoperative Anaesthesia
Standard of care for every anaesthetic, including MAC sedation. No contraindications.
During MAC/sedation — the critical concept:
- Pulse oximetry detects only 50% of apnoea episodes detected by capnography
- SpO₂ drops an average of 45.6 seconds after apnoea begins (because of oxygen reserve from pre-oxygenation and supplemental O₂)
- This delay is dangerous — by the time SpO₂ falls, significant hypercapnia has already occurred
- Lesson: In sedation cases, always use capnography alongside pulse oximetry. SpO₂ is a late indicator of respiratory depression when supplemental O₂ is being given
Endobronchial intubation:
- Pulse oximetry frequently fails to detect right mainstem intubation if the patient is pre-oxygenated on 100% FiO₂
- The non-ventilated left lung still has O₂ from pre-oxygenation — SpO₂ stays normal for several minutes
- Capnography is more sensitive (waveform unchanged in endobronchial intubation but auscultation and asymmetric chest rise are key)
Intraoperative oxygen targets:
- Most adult patients: SpO₂ 95–100% (avoid hyperoxia in COPD, neonates)
- Premature neonates: 91–95% (above 95% risks retinopathy of prematurity)
- Single-lung ventilation: SpO₂ ≥ 92% generally acceptable; tolerate lower if unavoidable
6.2 Post-Anaesthesia Care Unit (PACU)
The PACU is where residual anaesthesia + opioid analgesia + positioning combine to produce insidious hypoxaemia.
- Continuous SpO₂ monitoring is mandatory
- Shivering commonly causes motion artefact — use Masimo-technology device or earlobe probe
- Aim SpO₂ ≥ 95% before discharge to ward (or ≥ 92% in COPD)
- A persistently low SpO₂ in PACU — think: airway obstruction, residual neuromuscular block, opioid-induced respiratory depression, pneumothorax, PE, atelectasis
6.3 ICU
Continuous monitoring: Pulse oximetry provides real-time SpO₂ trend — alerts clinicians to acute deterioration, tube displacement, mucus plugging, pneumothorax.
Oxygenation targets in critical care:
| Condition | Target SpO₂ |
|---|---|
| General critically ill | 94–98% |
| COPD / chronic type II respiratory failure | 88–92% |
| ARDS (conservative oxygenation) | 88–95% |
| Post-cardiac arrest (avoid hyperoxia) | 94–98% — hyperoxia worsens neurological outcome |
| Premature neonate | 91–95% |
| Carbon monoxide poisoning | 100% (100% FiO₂ mandatory — SpO₂ unreliable, but maximise O₂ to displace CO) |
AVOID liberal oxygenation in the ICU — multiple RCTs (including the ICU-ROX and OXYGEN-ICU trials) have shown that hyperoxaemia is associated with increased mortality. SpO₂ > 98% on supplemental O₂ may indicate dangerous PaO₂ levels. If in doubt, check an ABG.
The SvO₂ connection:
Mixed venous oxygen saturation (SvO₂) from the pulmonary artery catheter, or ScvO₂ from the CVC, represents the balance between O₂ delivery and consumption:
SvO₂ = SaO₂ − VO₂ / (1.34 × Hb × CO)
Normal: 65–80%
- SvO₂ < 65% → extraction increased → shock (hypovolemic, cardiogenic, distributive) or ↑ VO₂ (sepsis, pain, shivering)
- SvO₂ > 80% → either excess delivery OR failure to extract (distributive shock with mitochondrial dysfunction, cytotoxic hypoxia, left-to-right shunt)
The relationship between SpO₂ (arterial) and SvO₂ (venous) frames the entire oxygen delivery-consumption physiology picture.
6.4 Prehospital and Transport
In transport, motion artefact is a constant problem. Use of Masimo or Nellcor devices with advanced signal processing is preferred. The earlobe probe is more robust in transit than finger probes.
In air ambulance (altitude), PaO₂ at cabin altitude (typically 1500–2400 metres) is reduced — SpO₂ may be 3–5% lower than at ground level. Plan supplemental O₂ accordingly.
6.5 Neonatal Screening — Critical Congenital Heart Disease (CCHD)
The US Secretary of Health and Human Services has mandated universal newborn pulse oximetry screening for critical congenital heart disease before discharge.
Protocol: SpO₂ measured in the right hand (pre-ductal) and either foot (post-ductal). Positive screen if:
- SpO₂ < 95% in either limb, OR
-
3% difference between right hand and foot (indicates right-to-left ductal shunting)
Sensitivity for CCHD: ~75% for suspected lesions, ~58% for unsuspected. When combined with antenatal ultrasound and newborn examination, up to 92% of critical CHD lesions are identified.
PART 7 — ADVANCED AND EMERGING TECHNOLOGIES
7.1 Multi-Wavelength Pulse CO-Oximetry (Masimo Rainbow)
Using up to 12 wavelengths, this technology non-invasively measures:
| Parameter | What It Measures | Limitation |
|---|---|---|
| SpO₂ | Standard arterial oxygen saturation | Standard accuracy |
| SpCO | Carboxyhaemoglobin | Not precise enough to replace lab co-oximetry; useful for screening |
| SpMet | Methaemoglobin | Accurate even during hypoxia (newer devices) |
| SpHb | Total haemoglobin | Reasonable bias ±1 g/dL; unreliable in low perfusion; limited data in Hb 6–10 g/dL range |
Clinical role of SpHb: Continuous intraoperative haemoglobin monitoring to reduce unnecessary transfusion — or to catch hidden major haemorrhage in real time. In major trauma, vascular, and liver surgery it has genuine utility, but SpHb should trigger further ABG sampling rather than be used as a standalone transfusion trigger.
7.2 Cerebral Near-Infrared Spectroscopy (NIRS / rSO₂)
This uses reflectance-mode NIRS at the forehead to measure regional cerebral oxygen saturation (rSO₂). It measures a weighted average (~75% venous, ~25% arterial) of tissue oxygenation in the frontal cerebral cortex.
Normal rSO₂: 60–75%
Key uses:
- Cardiac surgery on CPB: detect cerebral desaturation during aortic cross-clamping, hypotension, or embolism. Intervention guided by rSO₂ ≥ 50% or not < 20% of baseline
- Carotid endarterectomy: detect cerebral ischaemia during carotid cross-clamping — guides need for shunting
- Detection of malpositioning/malfunction in ECMO
- Patients with continuous-flow ventricular assist devices (where conventional SpO₂ is impossible)
7.3 Pulse Spectroscopy (Emerging)
Uses hundreds of wavelengths across the visible and near-infrared spectrum. Early results show:
- Accurate SaO₂ determination
- Reliable COHb and MetHb assessment during both normoxia and hypoxia
- Potential to fully replace ABG co-oximetry for saturation measurements in future
PART 8 — WHAT PULSE OXIMETRY CANNOT TELL YOU
Never forget these gaps — this is where clinical disaster occurs:
| What You Want to Know | Can SpO₂ Tell You? | What You Need Instead |
|---|---|---|
| Is ventilation adequate? | ❌ | Capnography, ABG PaCO₂ |
| Is there hyperoxia? | ❌ | ABG PaO₂ |
| Is oxygen delivery adequate? | ❌ | SpO₂ + Hb + cardiac output |
| Is there CO poisoning? | ❌ | ABG co-oximetry |
| Is MetHb present? | Partially (fixed at 85%) | ABG co-oximetry |
| Is tissue using oxygen? | ❌ | SvO₂/ScvO₂, lactate |
| Acid-base status | ❌ | ABG |
| Are the lungs ventilated bilaterally? | Often ❌ | Auscultation, ETCO₂, CXR |
PART 9 — THE PROFESSOR'S CLINICAL SCENARIOS
Scenario 1. A patient in the ICU post-liver transplant on noradrenaline 0.3 mcg/kg/min. SpO₂ probe on the left index finger reads 88% and is alarming. Nurse is about to increase FiO₂ further. What do you do?
The answer: The patient is on a vasopressor — fingers are vasoconstricted. This is likely a perfusion artefact. First, check the waveform — is there a good plethysmographic trace with a recognisable peak? If the trace is poor, the number is meaningless. Move the probe to the earlobe or forehead. If the SpO₂ is still low on a good waveform trace, then take an ABG. Do not blindly increase FiO₂ based on a noisy signal.
Scenario 2. A fire rescue patient is brought in with suspected smoke inhalation. SpO₂ reads 98%. He is confused and has a headache. Do you reassure him?
The answer: Absolutely not. His SpO₂ reading is almost certainly falsely elevated due to COHb. CO causes confusion and headache. Send ABG with co-oximetry immediately. Start 100% high-flow O₂ now. Do not wait for ABG results to start treatment.
Scenario 3. During laparotomy, your patient's SpO₂ drops from 99% to 85% suddenly and does not respond to increasing FiO₂. The surgeon has just injected methylene blue to test for anastomotic leak. What is happening?
The answer: Methylene blue has a peak light absorption at 668 nm — very close to the deoxy channel (660 nm). The oximeter interprets this as massive deoxygenation and SpO₂ crashes to ~65–85%. This is a well-known, transient artefact lasting 1–2 minutes until methylene blue distributes and is cleared. The patient is almost certainly not hypoxic. Check the surgical field, ventilate normally, and wait. Inform the team.
Scenario 4. A 25-year-old fitness instructor with known G6PD deficiency was given prilocaine topical cream before a procedure. Now SpO₂ reads 85% and is fixed there. 100% O₂ makes no difference. Diagnosis?
The answer: Prilocaine (and benzocaine, dapsone) causes acquired methaemoglobinaemia — the SpO₂ is being pulled toward 85% regardless of true saturation. Confirm with ABG co-oximetry (will show MetHb%). Treat with methylene blue 1–2 mg/kg IV — this activates the NADPH pathway and rapidly reduces MetHb to Hb. Note the paradox: methylene blue (which itself transiently drops SpO₂) is the treatment for methaemoglobinaemia. Use ABG, not pulse oximetry, to guide treatment.
SUMMARY FRAMEWORK — THE PROFESSOR'S ONE-PAGE MENTAL MODEL
PULSE OXIMETRY: LAYERED MENTAL MODEL

LAYER 1 — PHYSICS
  Beer-Lambert Law → Lambert-Beer extinction at 660 nm & 940 nm
  AC (pulsatile) / DC (static) separation → isolates arterial signal
  R = (AC660/DC660) ÷ (AC940/DC940) → calibration curve → SpO₂

LAYER 2 — PHYSIOLOGY
  SpO₂ estimates SaO₂ (functional, not fractional)
  CaO₂ = 1.34 × Hb × SaO₂ + 0.0031 × PaO₂
  SaO₂ is shaped by the oxyHb dissociation curve
  Curve shifts: CADET for right shift (↑CO₂, Acidosis, ↑2,3-DPG, Exercise/Temp)

LAYER 3 — WHAT IT GIVES YOU
  SpO₂ → oxygenation (not ventilation, not delivery, not tissue use)
  PPG waveform → perfusion, rhythm, PVI
  PI → vascular tone
  Heart rate → from pulsatile signal

LAYER 4 — WHEN IT LIES
  COHb → falsely HIGH (reads normal in CO poisoning)
  MetHb / SHb → locked at 85%
  Optical shunt → locked at 85%
  Methylene blue → acutely drops to ~65%
  Low perfusion → absent/low reading
  Dark skin < 80% SaO₂ → falsely HIGH (hidden hypoxaemia)
  Venous pulsation → falsely LOW

LAYER 5 — WHAT IT CANNOT DO
  Ventilation ✗    Hyperoxia ✗    Hb concentration ✗
  Tissue oxygenation ✗    CO poisoning ✗    Acid-base ✗
Sources:
- Miller's Anesthesia, 2-Volume Set, 10e — Chapter 37, pp. 5449–5473 (definitive reference)
- Morgan & Mikhail's Clinical Anaesthesiology, 7e — Chapter 6, pp. 222–225
- Barash, Cullen & Stoelting's Clinical Anaesthesia, 9e — Chapter 30, pp. 2491–2492
- Rosen's Emergency Medicine, 10e — Chapter 10 (methaemoglobinaemia)
- Gallagher JJ & Adamski JL — Accuracy of Pulse Oximetry in Non-white Patients, Crit Care Nurs Clin North Am 2025 [PMID: 40849175]
- Coutrot M et al. — Perfusion Index in Anaesthesia & Critical Care, Anaesth Crit Care Pain Med 2021 [PMID: 34687923]
We've covered everything from the Beer-Lambert law to racial equity in oximetry. Do you want to go even deeper on any specific layer — waveform interpretation, fluid responsiveness protocols, the advanced haemoglobin disorders, or how to approach a specific clinical scenario?
Spinal Anesthesia and epidural Anesthesia - standard procedure - act like professor and teach me as resident
Reading File
Finding Sources
Finding Sources
Reading File
Reading File
Reading File
Reading File
Reading File
Reading File
Reading File
Loading Image
Finding Sources
Finding Sources
Reading File
Finding Sources
Searching Images
spinal anesthesia anatomy needle layers subarachnoid space lumbar puncture cross section
Loading Image
Reading File
Finding Sources
Reading File
Reading File
Excellent — I have rich, authoritative content from all the major anaesthesia textbooks. Now let me deliver the full professor-level lecture.
🎓 PROFESSOR'S LECTURE: Spinal & Epidural Anaesthesia
Residency Teaching Session — Anaesthesia & Critical Care
Good morning, resident. Today we cover the two pillars of neuraxial anaesthesia — spinal and epidural. I want you to leave this session knowing not just how to perform these techniques, but why every step exists and what happens when something goes wrong. Let's begin from the ground up.
MODULE 1 — ANATOMY: THE FOUNDATION OF EVERYTHING
1.1 The Vertebral Column and Spinal Levels
Before you touch a needle, you must know the anatomy cold. Look at this diagram:
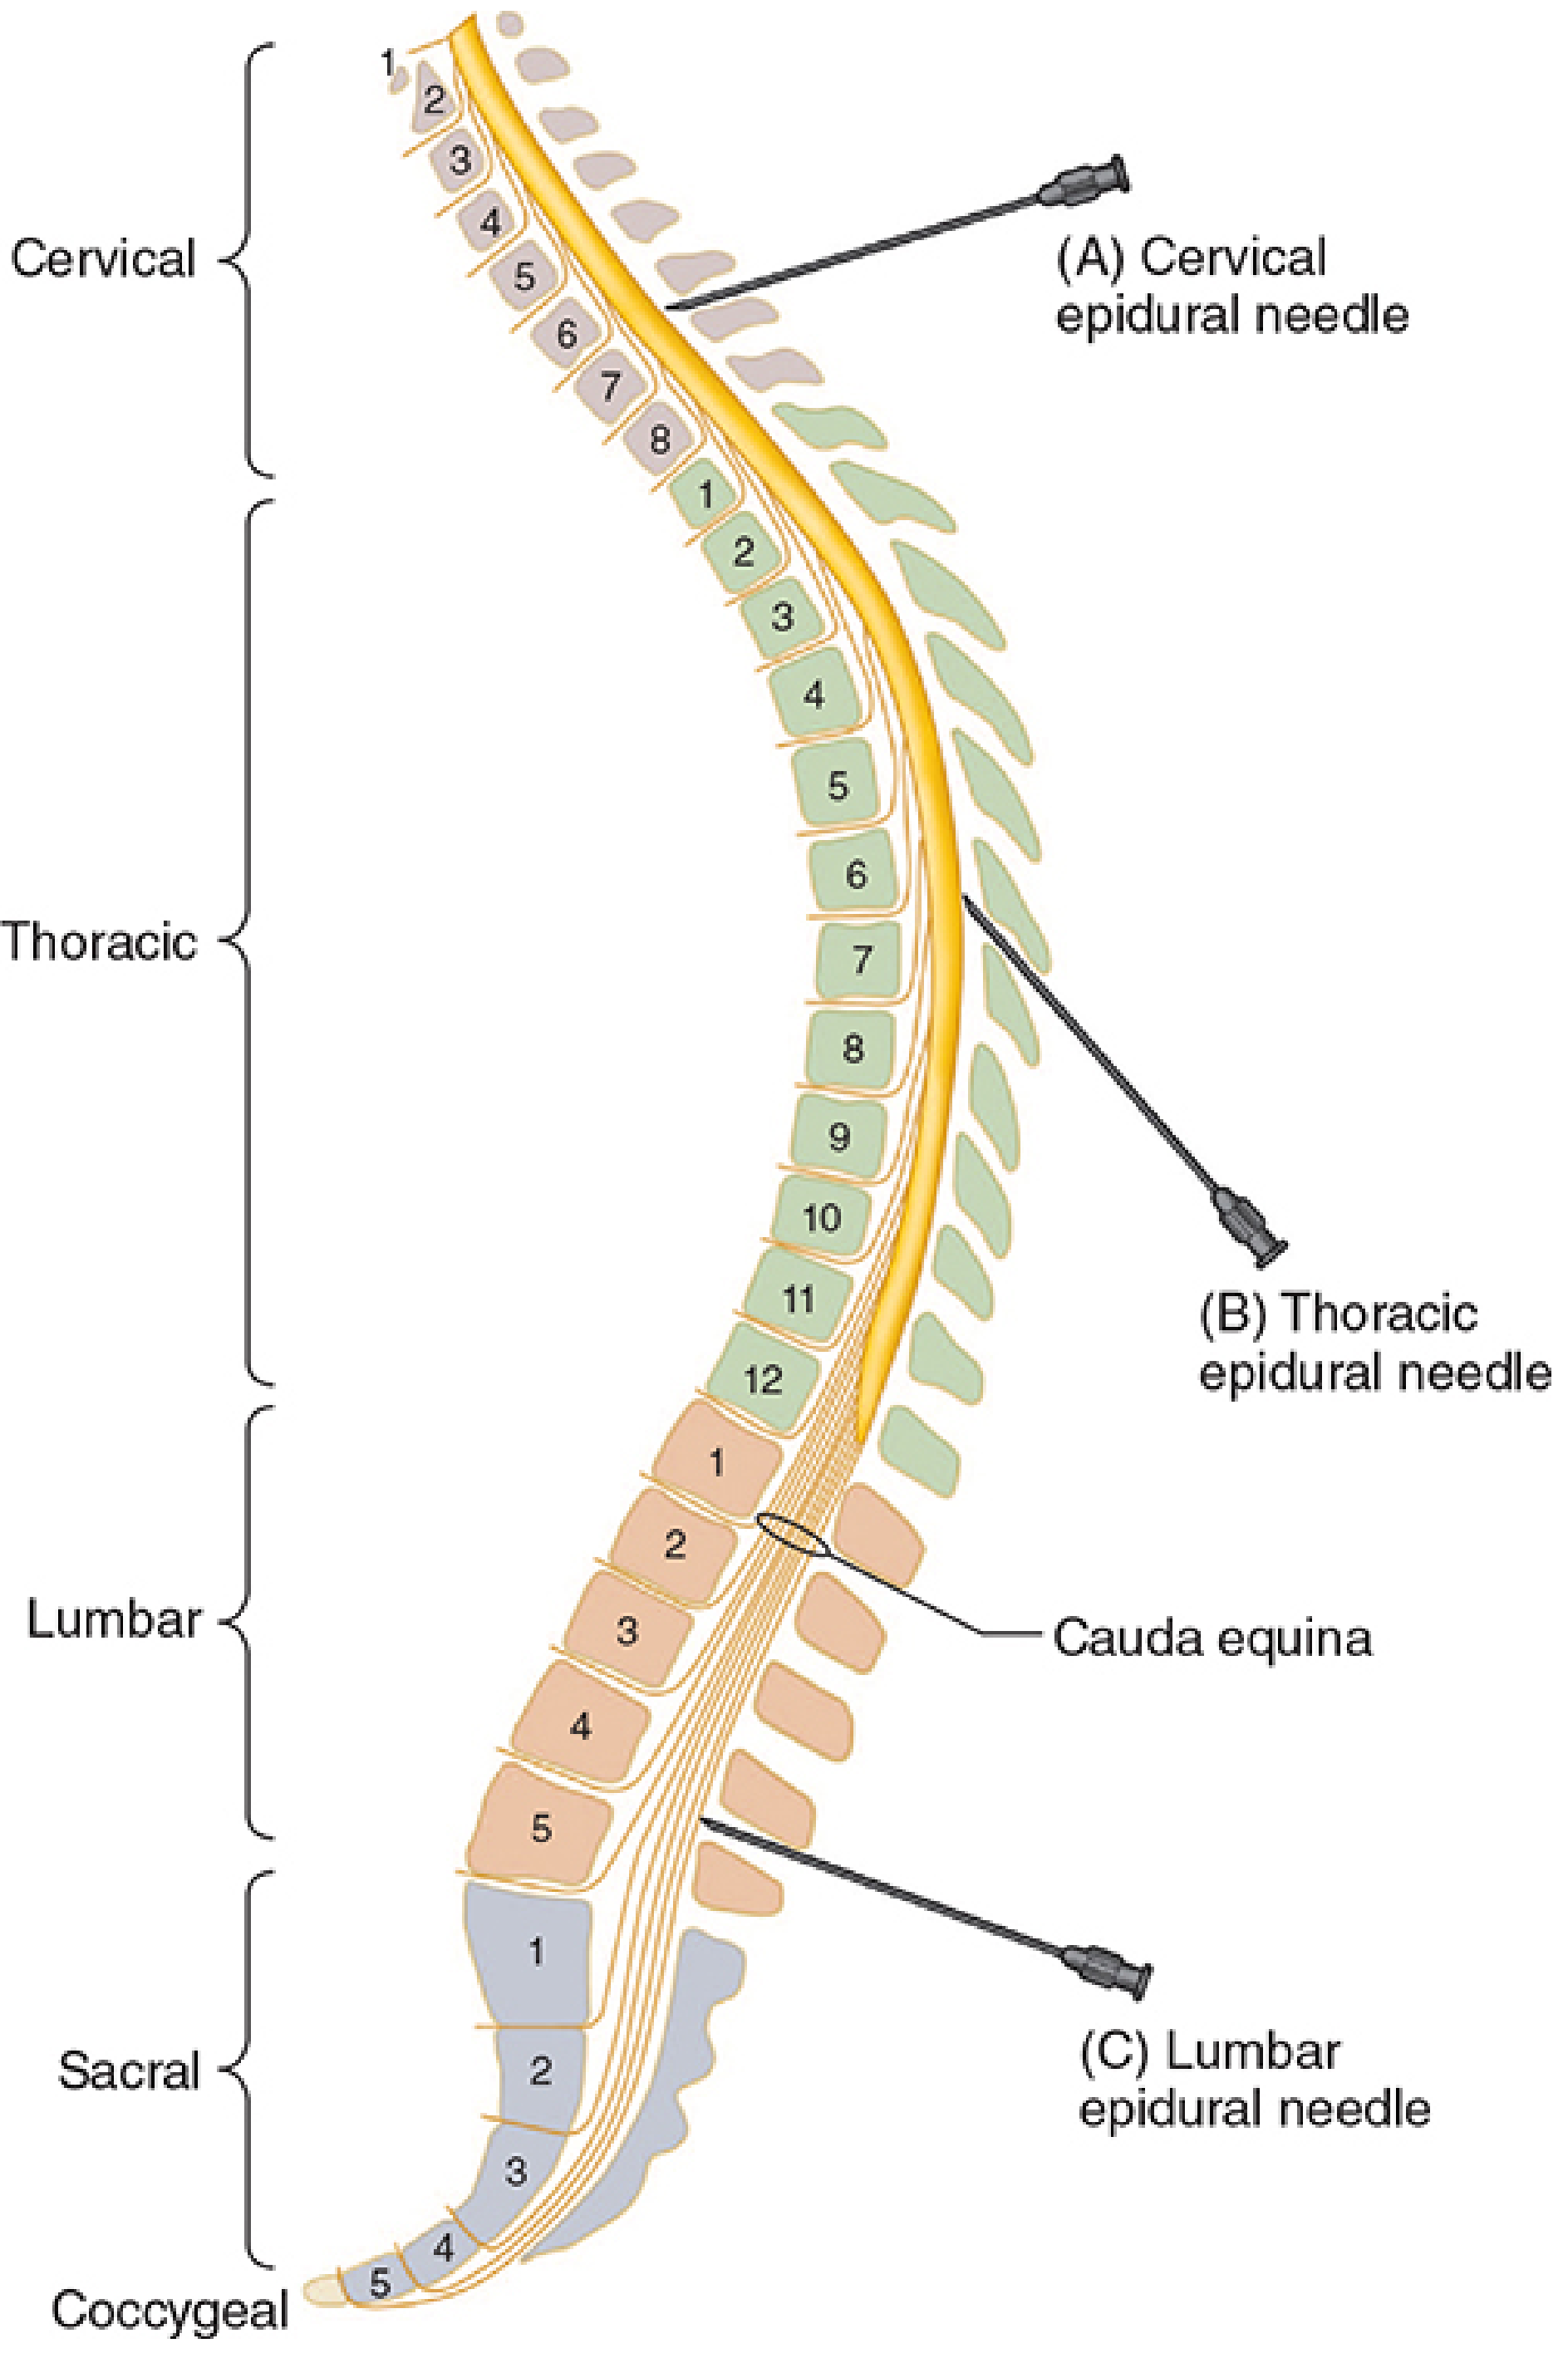
Fig 45–21 — Morgan & Mikhail, 7e: Needle angulation at different vertebral levels. Notice how dramatically the angle changes from lumbar to thoracic — this is a major source of technical difficulty
Critical anatomical landmarks:
| Level | Structure | Clinical Significance |
|---|---|---|
| L1–L2 | Conus medullaris (cord end) | Never do spinal above L2 — cord injury risk |
| L3–L4 | Most common spinal entry | Below conus, safe zone |
| L4–L5 | Intercristal line (Tuffier's line) | Line between iliac crests = L4 vertebral body or L4–L5 space |
| S2 | Lower limit of dural sac | Below this = sacral canal, caudal block territory |
| C7–T1 | Cervical-thoracic junction | Cervical epidurals done here |
Tuffier's line (intercristal line): Draw a horizontal line connecting the top of both posterior iliac crests. This crosses the L4 spinous process or the L4–L5 interspace in adults. However, ultrasound studies show this is unreliable in up to 50% of patients — especially obese patients where it may be at L3–L4 or even higher. Never rely on this landmark alone without confirmation.
In children: The line crosses at L5–S1 (in infants < 1 year) — the cord and dural sac extend lower in children. This is why you must recalibrate mentally when doing paediatric neuraxial blocks.
1.2 Layers the Needle Passes Through — From Skin to CSF
This is your mental GPS for every neuraxial needle insertion. Memorise this sequence:
For both spinal and epidural (midline approach):
SKIN
  ↓
Subcutaneous fat
  ↓
Supraspinous ligament  (connects spinous process tips — runs vertically)
  ↓
Interspinous ligament  (between spinous processes — softer, less resistance)
  ↓
Ligamentum flavum  ← STOP HERE for EPIDURAL (firm, gritty, elastic — loss of resistance)
  ↓
Epidural space  (potential space, contains fat, vessels, lymphatics)
  ↓
Dura mater  ← DANGER ZONE — perforation = PDPH
  ↓
Arachnoid mater
  ↓
Subarachnoid space (CSF)  ← ENDPOINT for SPINAL
  ↓
Pia mater (adherent to cord)
The feel of the needle as you advance:
- Supraspinous ligament → firm, like penetrating dense rubber
- Interspinous ligament → softer, less distinct
- Ligamentum flavum → firm, gritty, "springy" — classic feel; when using LOR syringe, the plunger bounces back here
- Entry into epidural space → sudden loss of resistance — plunger collapses
- Entry through dura into CSF (spinal) → distinct "pop" or "give" — then free flow of CSF confirms correct placement
1.3 Contents of the Epidural Space
The epidural space is a potential space (not a true anatomical space filled with air in life). It contains:
- Loose fatty connective tissue — more abundant in lumbar region; absent at thoracic level (dura is closer to ligamentum flavum)
- Batson's venous plexus — an extensive network of valveless epidural veins. These are the vessels that produce bloody taps and intravascular catheter placement. They are engorged in pregnancy (by the gravid uterus compressing the IVC → blood diverts to Batson's plexus), increasing the risk of intravascular catheter placement in obstetric patients
- Lymphatics
- Spinal nerve roots in dural sleeves, exiting through the intervertebral foramina
The epidural space communicates freely with the paravertebral spaces through the foramina — this is why an epidural injection can spread laterally and also explains the rare occurrence of incomplete (unilateral) blocks.
Depth of epidural space from skin:
- Lumbar: typically 4–6 cm in average adults
- Rule of thumb: 1 mm/kg body weight in children
- Ultrasound can measure this preoperatively and is increasingly used
MODULE 2 — SPINAL ANAESTHESIA
2.1 What It Is
Spinal anaesthesia (subarachnoid block, SAB, intrathecal block) involves injecting local anaesthetic directly into the cerebrospinal fluid in the subarachnoid space, producing rapid, dense, predictable blockade of the spinal nerve roots bathed in CSF.
Key characteristics vs. epidural:
| Feature | Spinal | Epidural |
|---|---|---|
| Onset | Fast (3–5 min) | Slow (10–20 min) |
| Block density | Dense, predictable | Variable, can be patchy |
| Duration | Fixed (single shot) | Extendable via catheter |
| Drug dose | Small (mg) | Large (mL, 10× dose) |
| Hypotension | Rapid, pronounced | Slower, more controllable |
| PDPH risk | Yes (needle size dependent) | Yes if dura punctured inadvertently |
| Motor block | Complete (surgical dose) | Titrable (can spare motor) |
2.2 Indications
Spinal anaesthesia is the technique of choice for:
| Procedure | Required Level |
|---|---|
| Caesarean section | T4 |
| Upper abdominal surgery | T4 |
| Lower abdominal surgery (hernia, appendectomy) | T6–T8 |
| TURP / cystoscopy / bladder | T10 |
| Hip fracture / hip replacement | T10 |
| Knee replacement | T12 |
| Foot and ankle surgery | L2 |
| Perineal / rectal / saddle | S2–S4 |
Remember: The level of the skin incision is not the same as the level of visceral innervation. The bladder and uterus both have visceral pain fibres ascending to T10. The peritoneum is innervated up to T4. If you only block to T10 for a TURP and the surgeon stretches the bladder neck, the patient will feel it. Always consider the operation's visceral requirements, not just the skin incision level.
2.3 Contraindications
Absolute:
- Patient refusal
- Infection at injection site (local sepsis)
- Raised intracranial pressure (herniation risk from CSF pressure shift)
- Severe hypovolaemia (relative, but can precipitate catastrophic cardiovascular collapse)
- True allergy to local anaesthetic (rare but must ask)
- Coagulopathy / full anticoagulation (spinal haematoma risk)
Relative / Situation-Dependent:
- Anticoagulant therapy (follow ASRA timing guidelines — see later)
- Sepsis / bacteraemia (risk of haematogenous seeding of meninges)
- Fixed cardiac output states (severe aortic stenosis, hypertrophic cardiomyopathy) — cannot compensate for vasodilation
- Severe spinal deformity (scoliosis, prior spinal surgery)
- Pre-existing neurological disease (medicolegal — document carefully)
- Thrombocytopenia (platelet count < 70–80 × 10⁹/L — use judgement)
- Patient inability to cooperate
2.4 Equipment for Spinal Anaesthesia
Sterile field essential. Prepare:
- Antiseptic solution (chlorhexidine or povidone iodine)
- Sterile drapes and gloves
- Introducer needle (18–19G, 2.5 cm)
- Spinal needle (see below)
- Syringe (5 mL) for local anaesthetic
- Drug, diluent
- Monitoring equipment running before you start
The Spinal Needle — The Most Important Equipment Decision:
| Needle Type | Gauge | Tip Design | PDPH Risk |
|---|---|---|---|
| Quincke (cutting) | 22–25G | Bevelled, sharp-cutting | Higher — cuts dural fibres |
| Whitacre (pencil-point) | 25–27G | Conical tip, side port | Lower — spreads fibres, doesn't cut |
| Sprotte (pencil-point) | 24–27G | Large side opening | Lowest — atraumatic |
| Gertie Marx | 22–26G | Pencil-point variant | Low |
The resident must know:
- Always use pencil-point (non-cutting) needles — Whitacre 25G or Sprotte 25–27G — as first choice to minimise PDPH
- A 25G Whitacre has PDPH rate < 1%; a 20G Quincke has PDPH rate 30–40%
- The bevel of a Quincke needle should be inserted parallel to dural fibres (dural fibres run longitudinally) — this minimises the hole size and PDPH risk
- An introducer (19G, 2.5 cm needle) is used to guide the fine spinal needle through skin and superficial tissues, preventing it from bending or carrying skin plugs into the subarachnoid space
2.5 Positioning the Patient — Step-by-Step
Three positions are used:
Lateral Decubitus (most common):
- Patient on the edge of the operating table, back parallel to you
- Knees drawn up to chest ("fetal position")
- Neck flexed (chin to chest)
- Assistant helps the patient curl and maintain position
- Advantages: Patient comfort, easy to administer sedation, useful for unilateral spinal (hyperbaric solution + keep operative side down for 10 minutes)
- Note: In females, the hips are wider than the shoulders — the spine may slope downward toward the head; compensate by adjusting table tilt
Sitting Position:
- Patient sitting upright on the table edge, feet on footstool
- Arms over a pillow in the lap or around an assistant's neck
- Head down, chin to chest, shoulders relaxed, lower back "pushed out"
- Advantages: Midline is easier to identify (especially in obese or scoliotic patients); CSF flows back readily due to gravity
- Disadvantage: Vasovagal syncope; hypotension can occur before the block is even complete; needs a good assistant
- Ideal for: Saddle block (perineal/anal procedures) — inject hyperbaric solution and keep patient sitting for 5 minutes to pool block in the saddle area
Prone (Jack-knife):
- Rarely used; reserved for when surgery is performed in this position (rectal, perineal, lumbar procedures)
- Hypobaric local anaesthetic used (spreads to non-dependent = posterior structures)
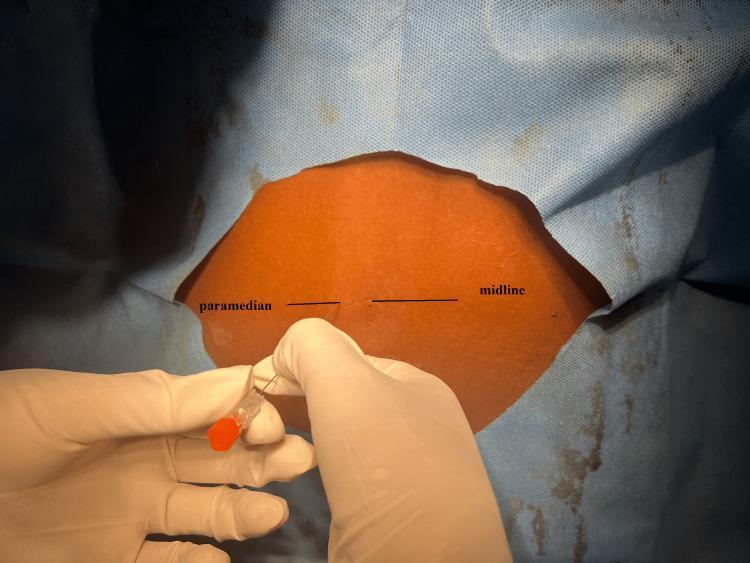
Paramedian approach entry point vs. midline marked on the sterile field — the paramedian approach bypasses the supraspinous and interspinous ligaments entirely
2.6 The Midline Technique — Step by Step
This is what you will be doing. Every step has a reason.
Step 1 — Preparation
- Establish IV access (large bore)
- Attach monitors: SpO₂, NIBP, ECG
- Pre-load or co-load with IV crystalloid (500–1000 mL)
- Position patient as above
- Open sterile trolley, don sterile gloves, clean skin with chlorhexidine (allow to dry fully — at least 30 seconds — chlorhexidine is neurotoxic if injected intrathecally while wet)
Step 2 — Identify the Space
- Palpate Tuffier's line (L4–L5)
- Choose L3–L4 or L4–L5 interspace (below the spinal cord)
- Mark with your thumbnail or a pen cap
- If you cannot identify by palpation (obesity, scoliosis, oedema) → use ultrasound pre-procedure to identify midline and interspace depth
Step 3 — Skin Infiltration
- Raise a skin wheal with 1–2 mL lidocaine 1–2% at the insertion point
- Infiltrate deeper into the interspinous ligament — this reduces procedural pain
Step 4 — Insert the Introducer
- 19G introducer needle inserted through skin and subcutaneous tissue at slight cephalad angle (10–15°) until it engages the interspinous ligament
- The introducer acts as a guide rail for the fine spinal needle
Step 5 — Advance the Spinal Needle
- Insert the 25–27G pencil-point needle through the introducer
- Advance slowly, bevel oriented parallel to dural fibres (longitudinal)
- You will feel distinct changes in tissue resistance:
- Interspinous ligament: moderate resistance
- Ligamentum flavum: firm resistance
- A distinct "pop" or "click" as the needle penetrates the dura-arachnoid complex
- Remove the stylet → free flow of clear CSF confirms correct placement
Step 6 — Confirm and Aspirate
- Look for clear, free-flowing CSF — it should drip steadily
- If no CSF: rotate the needle 90° (bevel may be against a nerve root), advance 1–2 mm, or try the contralateral side
- Aspirate gently 0.2–0.3 mL to confirm — then replace aspirated CSF is optional
Step 7 — Inject Slowly
- Attach the drug syringe
- Re-aspirate gently to confirm position maintained (see blood-tinged → abort)
- Inject slowly over 15–30 seconds
- Do NOT inject rapidly — rapid injection increases turbulence, unpredictable spread, and increases the risk of TNS (transient neurological symptoms)
- Some operators aspirate a small amount midway through injection ("barbotage") — not proven to be beneficial, not recommended routinely
Step 8 — Withdraw and Position
- Remove the needle and introducer together
- Immediately position the patient for the desired block distribution
- Apply a small sterile dressing
- Reassess block height with ice or cold spray/pinprick at 3–5 minutes
2.7 The Paramedian Approach
Used when:
- Cannot access midline (severe arthritis, calcified interspinous ligaments, prior spinal surgery, obesity)
- Thoracic level spinal (where spinous processes overlap steeply)
Technique:
- Entry point is 1–1.5 cm lateral to the midline at the cephalad edge of the lower spinous process
- Needle aimed medially and cephalad at approximately 10–15°
- Bypasses supraspinous and interspinous ligaments entirely — goes directly into ligamentum flavum, then directly to dura and subarachnoid space
- Resistance feels different: less firm than midline approach since you avoid the tough interspinous ligament; ligamentum flavum still gives the characteristic resistance
2.8 Factors Determining Block Height — Master These
This is the most testable area in spinal anaesthesia. The mnemonic is "BADVP+C" — Baricity, Amount (dose), Density (CSF), Volume, Position + patient Characteristics.
A. Baricity — The Most Controllable Factor
Baricity = density of local anaesthetic solution ÷ density of CSF (at 37°C)
CSF density = 1.00059 g/mL
| Type | Baricity | Achieved By | Behavior |
|---|---|---|---|
| Hyperbaric | > 1.00059 | Add dextrose 8% | Sinks with gravity to dependent areas |
| Isobaric | ≈ 1.00059 | Plain solution | Minimal gravity effect |
| Hypobaric | < 1.00059 | Add sterile water | Rises against gravity to non-dependent areas |
Clinical uses of baricity:
| Situation | Use | Logic |
|---|---|---|
| Unilateral spinal (hip fracture) | Hyperbaric + lateral decubitus (operative side down) | Solution pools in dependent (operative) side |
| Saddle block (perineal) | Hyperbaric + sitting position | Solution pools in the sacral curve |
| Prone jack-knife (rectal) | Hypobaric | Rises to non-dependent = posterior structures |
| Standard bilateral block | Hyperbaric + supine | Pools in thoracic kyphosis and lumbar lordosis valleys |
The thoracic kyphosis effect with hyperbaric solutions: In the supine patient, the thoracic kyphosis creates a natural dependent point at T4–T5. Hyperbaric local anaesthetic injected at L3–L4 will flow cephalad to the kyphotic dip, potentially spreading to T4 unexpectedly. The lumbar lordosis conversely creates a "ridge" at L3–L4 that acts as a partial barrier to spread.
B. Dose (Amount of Drug)
For isobaric and hypobaric solutions, dose is the most reliable determinant of block height. Greater dose → higher block.
For hyperbaric solutions, baricity (position) is more important than dose for determining spread direction, but dose determines the duration and density of the block at that level.
C. Volume and Concentration
Volume × Concentration = Dose — all three are linked. For the same dose, higher volume produces slightly more cephalad spread with isobaric solutions. However, the clinical difference is modest.
D. Patient Factors
| Factor | Effect | Mechanism |
|---|---|---|
| Age (↑) | ↑ block height | ↓CSF volume, ↑CSF specific gravity, narrowed intervertebral foramina |
| Pregnancy | ↑ block height (significantly) | ↓CSF volume (engorgement of Batson's plexus from IVC compression), ↓CSF density, heightened sensitivity of nerve roots |
| Obesity | ↑ block height (variable) | ↑Epidural fat → ↓CSF volume |
| Height | Minimal effect (normal range) | Leg bone length > spinal column length |
| Sex | Females: slightly higher blocks | Lower CSF density in premenopausal females |
| Position after injection | Major effect | Determines spread of hyperbaric solutions |
2.9 Local Anaesthetics Used in Spinal Anaesthesia
| Drug | Type | Onset | Duration | Notes |
|---|---|---|---|---|
| Bupivacaine (0.5% heavy) | Amide | 5 min | 2–4 hours | Gold standard for spinal; 10–15 mg for CSx, 7.5–10 mg for lower limb |
| Levobupivacaine | Amide | 5 min | Similar | S-enantiomer; less cardiotoxic, similar clinical profile |
| Ropivacaine | Amide | 5 min | Slightly shorter | 60% potency of bupivacaine; less motor block |
| Lidocaine 5% hyperbaric | Amide | 3 min | 1–1.5 hours | Very fast; but high TNS risk — largely abandoned |
| Prilocaine 2% (Citanest) | Amide | 3–5 min | 1–2 hours | Ambulatory spinal; low TNS; MetHb risk at high doses |
| Chloroprocaine 1% | Ester | 2–3 min | 30–60 min | Fastest offset; ambulatory; neurotoxicity risk with some preservatives |
| Tetracaine (Amethocaine) | Ester | 5–10 min | 2–4 hours | Used in saddle blocks; hyperbaric with 10% dextrose |
The bupivacaine 0.5% heavy (hyperbaric bupivacaine) is your workhorse. Know these doses:
- Caesarean section: 10–12.5 mg (some centres use 7.5–9 mg with intrathecal opioids)
- Hip fracture repair: 10–12 mg (isobaric preferred by some — more predictable for unilateral block)
- TURP / lower abdominal: 7.5–10 mg
- Knee arthroscopy: 5–7.5 mg (± unilateral technique)
2.10 Intrathecal Additives — Why and When
Additives are co-injected to enhance block quality, extend duration, reduce local anaesthetic dose, and provide postoperative analgesia.
Opioids
| Drug | Lipid Solubility | Onset | Duration | Key Side Effects |
|---|---|---|---|---|
| Fentanyl 12.5–25 mcg | High (lipophilic) | Fast (5 min) | 2–4 h | Pruritus, nausea, early respiratory depression |
| Sufentanil 2.5–5 mcg | Very high | Fast | 2–4 h | Pruritus most intense |
| Morphine 0.1–0.3 mg | Low (hydrophilic) | Slow (30–60 min) | 12–24 h | Late respiratory depression (up to 24h), pruritus, nausea, urinary retention |
The mechanism of lipophilicity on spread: Lipophilic drugs like fentanyl bind to neural tissue quickly near the injection site — segmental effect, limited cephalad spread in CSF. Hydrophilic morphine stays in CSF longer and spreads cephalad, reaching brainstem respiratory centres — hence the risk of delayed respiratory depression up to 24 hours later. Patients receiving intrathecal morphine must be monitored overnight with hourly respiratory rate assessments.
Why combine opioids with local anaesthetics?
- Allows dose reduction of local anaesthetic (less hypotension, less motor block)
- Synergistic analgesia at the dorsal horn
- Fentanyl 25 mcg IT dramatically improves quality and duration of caesarean section spinal without prolonging motor block
Clonidine
- α₂-agonist; intrathecal dose: 15–75 mcg
- Extends duration of both sensory and motor block
- Produces dose-dependent hypotension and sedation
- Prolongs analgesia postoperatively
- Used in ambulatory settings to extend block without prolonging discharge time (lower doses)
Epinephrine (Adrenaline)
- 0.1–0.2 mg intrathecally
- Prolongs spinal anaesthesia by causing local vasoconstriction (reduces local anaesthetic vascular uptake) and direct α₂ and β receptor-mediated spinal antinociception
- May cause TNS at higher doses
- Used less commonly now; largely superseded by intrathecal clonidine
Neostigmine
- Inhibits breakdown of acetylcholine at the spinal cord dorsal horn
- 25–100 mcg intrathecally
- Potent antinociception but significant nausea and vomiting limits routine use
2.11 Physiological Effects of Spinal Anaesthesia — Understanding the Block
Order of fibre blockade (thinnest → thickest):
B fibres (autonomic preganglionic, myelinated) → FIRST BLOCKED
  ↓
C fibres (pain, temperature, autonomic — unmyelinated)
  ↓
Aδ fibres (pain, temperature, touch)
  ↓
Aβ fibres (touch, pressure, vibration)
  ↓
Aα fibres (motor, proprioception) → LAST BLOCKED
Clinical consequence: The sympathetic block extends 2–6 dermatomes HIGHER than the sensory block, which in turn is 1–4 dermatomes higher than the motor block.
This is why:
- A patient with sensory block to T8 may have sympathetic block to T4–T6
- The full haemodynamic consequence (hypotension, bradycardia) may exceed what the sensory level predicts
- A patient with sensory block to T10 may still have motor function preserved in the lower limbs — don't mistake residual motor power for block failure
Cardiovascular Effects:
Sympathetic preganglionic fibres arise from T1–L2 (the thoracolumbar outflow). A high spinal blocking these fibres causes:
- Arterial vasodilation → ↓ SVR → ↓ MAP
- Venodilation → ↓ venous return → ↓ preload → ↓ cardiac output
- Cardiac accelerator fibres (T1–T4) blocked → bradycardia (in a high spinal)
- Bezold-Jarisch reflex → severe bradycardia when right ventricular filling suddenly drops (empty, distended right ventricle sends parasympathetic signals → extreme bradycardia → cardiac arrest)
Respiratory Effects:
- Low-to-mid thoracic spinals → minor reduction in FRC, no significant respiratory compromise
- Block to T4 → intercostal muscle paralysis; patient breathes diaphragmatically, VC may fall 20%
- Total spinal (C3–C5 blocked) → diaphragm paralysed → apnoea — airway management emergency
Gastrointestinal:
- Sympathetic block → unopposed vagal tone → increased bowel motility, contracted bowel (good for surgeons in some cases)
- Nausea during spinal (especially with hypotension) — partially vagally mediated
2.12 Complications of Spinal Anaesthesia
A. Hypotension (Most Common)
- Incidence: 15–33% generally; up to 80% in obstetric spinals without prophylaxis
- Mechanism: Sympathectomy → vasodilation + venodilation → ↓ preload + ↓ SVR
- Risk factors: High block level, hypovolaemia, elderly, sitting position at induction, aortic/mitral stenosis, pregnancy
- Treatment:
- Vasopressor first line: Phenylephrine (pure α₁) is preferred in obstetrics — maintains uteroplacental perfusion without increasing HR. Dose: 50–100 mcg IV bolus; infusion 25–50 mcg/min
- Ephedrine (α + β agonist): used if bradycardia accompanies hypotension — increases HR and BP; associated with more fetal acidosis in obstetrics
- Noradrenaline: Increasingly used as infusion in obstetric spinal (1 mcg/mL)
- IV fluid co-loading (not pre-loading) with crystalloid at time of spinal injection
- Left lateral uterine displacement in pregnancy (at least 15° tilt)
B. Bradycardia and Cardiac Arrest
- High spinal blocks cardiac accelerator fibres (T1–T4) → vagally unopposed → severe bradycardia
- Bezold-Jarisch reflex: sudden reduction in venous return → reflex bradycardia
- Treatment: Atropine 0.3–0.6 mg IV; Ephedrine IV; Adrenaline (epinephrine) if arrest
- Rule of 5s for spinal cardiac arrest: Give Adrenaline 1 mg every 5 minutes, perform CPR (Trendelenburg position to increase venous return)
C. High/Total Spinal
- Definition: Block extending to cervical levels → respiratory paralysis, hypotension, loss of consciousness
- Causes: Excessive dose, accidental intrathecal injection of epidural dose, patient positioning error with hyperbaric solution
- Signs: Rapidly ascending block, dyspnoea, inability to speak, bilateral arm weakness, then unconsciousness and apnoea
- Management:
- Call for help immediately
- 100% O₂ by face mask
- Prepare to intubate (RSI if necessary)
- Aggressive vasopressor therapy (ephedrine/epinephrine)
- IV fluid bolus
- Keep calm — this is a temporary, self-limiting situation as local anaesthetic redistributes
D. Post-Dural Puncture Headache (PDPH)
- Classic presentation: Positional headache — worse when upright, relieved when supine — onset 24–48 hours after dural puncture, lasting days to weeks
- Mechanism: Persistent CSF leak through dural hole → low CSF pressure → traction on pain-sensitive intracranial structures when upright
- Risk factors: Young age, female sex, pregnancy, large needle gauge, cutting (Quincke) needle, multiple attempts, perpendicular bevel orientation
- Prevention: Use 25–27G pencil-point (Whitacre/Sprotte) needles — the single most important intervention
Management of PDPH:
| Step | Intervention |
|---|---|
| Conservative | Supine positioning, oral hydration, simple analgesics (paracetamol, NSAIDs, codeine) |
| Caffeine | 300–500 mg oral/IV — constricts cerebral vessels, reduces pain; temporary relief |
| Sumatriptan | Evidence weak but used as bridge therapy |
| Epidural blood patch (EBP) | Gold standard definitive treatment — inject 15–20 mL patient's own blood into epidural space at same level; blood tamponades the dural hole and raises CSF pressure. Success rate 70–90% first attempt; repeat if needed |
E. Transient Neurological Symptoms (TNS)
- Description: Severe aching or shooting pain in buttocks and legs radiating to feet; onset 6–24 hours after resolution of spinal block
- Incidence: Lidocaine (highest — up to 40%), prilocaine (low), bupivacaine (very low < 1%)
- Risk factors: Lithotomy position, ambulatory patients, concentrated lidocaine (5%)
- Treatment: NSAIDs; self-limiting, resolves within days
- Lesson: This is why 5% hyperbaric lidocaine has been largely abandoned in favour of bupivacaine and prilocaine for spinal
F. Spinal Haematoma
- Rare but catastrophic — spinal cord compression → permanent paralysis
- Risk factors: Anticoagulation, thrombocytopenia, traumatic insertion
- Presentation: Back pain after resolution of block, followed by return of motor weakness (permanent, not the normal wearing off)
- Diagnosis: Urgent MRI
- Treatment: Immediate neurosurgical decompression within 6–12 hours (outcomes worsen dramatically with delay)
- ASRA Guidelines (key anticoagulant timings for neuraxial):
| Drug | Hold Before | Resume After |
|---|---|---|
| UFH subcutaneous | 4–6 hours | 1 hour after |
| LMWH prophylactic (enoxaparin 40 mg) | 12 hours | 6–8 hours after |
| LMWH therapeutic (enoxaparin 1 mg/kg bd) | 24 hours | 24 hours after |
| Warfarin | Until INR ≤ 1.4 | — |
| Clopidogrel | 7 days | — |
| Aspirin alone | No requirement | — |
| Rivaroxaban / Apixaban | 72 hours | 6 hours after |
| Dabigatran | 72–96 hours | 6 hours after |
G. Meningitis and Infection
- Septic meningitis: Haematogenous seeding or contamination — Streptococcus or Staphylococcus; strict aseptic technique prevents this
- Chemical (aseptic) meningitis: Contamination from antiseptics (chlorhexidine — must be dry before injection), detergents, preservatives in drugs
- Cauda equina syndrome: Neurotoxicity from maldistribution of concentrated local anaesthetic (continuous microcatheter spinals with concentrated lidocaine) — irreversible bowel/bladder dysfunction
MODULE 3 — EPIDURAL ANAESTHESIA
3.1 What It Is and Why It Differs from Spinal
Epidural anaesthesia deposits local anaesthetic in the epidural space (outside the dura), from where it diffuses through dural cuffs around nerve roots and into the subarachnoid space. It works primarily on nerve roots as they traverse the epidural space.
Key differences from spinal:
- Larger volume of drug needed (10–20 mL vs. 2–3 mL for spinal)
- Slower onset (10–20 minutes vs. 3–5 minutes)
- More controllable — catheter allows titration, top-ups, and prolonged use
- Can be segmental — a thoracic epidural blocks only thoracic levels, leaving cervical and lumbar roots intact
- Motor block is titrable — dilute solutions produce sensory-only (differential) block, useful for labour analgesia
- Septa in the epidural space can cause patchy or unilateral blocks (explains some failures)
3.2 Equipment
Tuohy Needle (17–18G, 8–9 cm): The standard epidural needle. Key features:
- Blunt, curved (Hustead) tip — does not cut the dura easily if it inadvertently touches it
- Huber point — the tip curves cephalad, directing the catheter cephalad when inserted
- Markings at 1 cm intervals from the tip to guide depth
Loss of Resistance Syringe (glass preferred, or low-friction plastic):
- 10 mL syringe filled with saline (or air) — used to detect loss of resistance as needle enters epidural space
- Glass syringes have lower friction and give better tactile feedback
Epidural Catheter (19–20G, soft, multi-orifice):
- Standard catheter is soft, radio-opaque, graduated in cm
- Multi-orifice (3 holes at tip) > single-orifice for drug distribution and less chance of complete vascular cannulation
- Inserted 3–5 cm into the epidural space — no more than 5 cm (risk of lateralisation, coiling, vascular/intrathecal migration)
3.3 Patient Positioning
Lateral decubitus (preferred for catheter placement):
- Spinal cord moves anteriorly in lateral position with flexion → away from the ligamentum flavum → larger epidural space at the posterior aspect
- Better patient cooperation
Sitting position:
- Better midline identification in obese patients
- Higher risk of vasovagal episode
3.4 Standard Lumbar Epidural Technique — Step by Step
Step 1 — Setup
- Large bore IV access established and running
- Monitoring in place (NIBP every 2–3 minutes, SpO₂, ECG)
- Vasopressors drawn up and ready (ephedrine 6 mg/mL, phenylephrine 100 mcg/mL)
- Resuscitation equipment immediately available (airway, drugs, defibrillator)
- Patient positioned (lateral decubitus or sitting)
- Sterile preparation and draping
Step 2 — Local Infiltration
- 3–5 mL lidocaine 1% into skin and subcutaneous tissue down to interspinous ligament
- Generous infiltration makes the procedure significantly more comfortable and reduces patient movement
Step 3 — Insert the Tuohy Needle
- Insert needle in midline at slight cephalad angle (10–15° at lumbar level)
- Advance through skin, subcutaneous tissue, supraspinous ligament
- Attach LOR syringe filled with 2–3 mL saline (with or without a small air bubble)
- Feel the firm, gritty resistance of the ligamentum flavum
- Advance millimetre by millimetre with continuous or intermittent thumb pressure on the syringe plunger
- At the ligamentum flavum, the plunger bounces back (resists injection)
Step 4 — Loss of Resistance
- As the needle tip exits the ligamentum flavum into the epidural space:
- Plunger suddenly collapses (with continuous pressure technique)
- Plunger freely compresses without bounce-back (intermittent technique)
- Stop advancing immediately — over-advancement perforates the dura
Important nuance — Air vs. Saline for LOR:
- Saline: More popular; does not compress into the space (no compressible bubble artifact on ultrasound if needed); associated with slightly fewer PDPHs in some studies
- Air: Simpler, makes accidental dural puncture immediately visible (bubbles in CSF return if dura punctured); but: > 2–3 mL of epidural air can cause incomplete blocks, pneumocephalus if intrathecal, and subcutaneous emphysema
The meta-analyses show no difference in clinical outcomes — use what your institution and consultant use, and be consistent.
Step 5 — Hanging Drop (Alternative for Thoracic)
- Place a drop of saline at the needle hub
- As the needle enters the thoracic epidural space, the negative intrapleural pressure is transmitted → drop is sucked in
- More reliable at thoracic level (where epidural pressure is more negative) than lumbar level
- Not a standalone technique — always confirm with LOR as well
Step 6 — Catheter Insertion
- Thread epidural catheter through the Tuohy needle
- Insert 3–5 cm beyond the needle tip (if needle is at 5 cm depth and catheter enters at 5 cm marker on catheter = tip is at the needle tip; advance to 8–10 cm on the catheter to leave 3–5 cm in the epidural space)
- Never withdraw the catheter through the needle — the Huber tip can shear off the catheter
- If catheter won't advance: rotate needle 90°, slightly withdraw the needle, try again
- Withdraw the needle over the catheter carefully
- Confirm no blood or CSF aspirates from catheter — if blood, withdraw 1 cm and recheck; if CSF aspirates throughout, you are intrathecal
Step 7 — Secure the Catheter
- Tape securely to the back (loop the catheter under the patient's arm around to the front)
- Place a yellow epidural label on the catheter and connection
- Never connect to IV tubing (wrong route error prevention)
3.5 Identifying the Epidural Space — The LOR in Detail
Tissue characteristics as you advance:
| Tissue | Tactile Feel | LOR Syringe |
|---|---|---|
| Subcutaneous fat | Soft, no resistance | Plunger goes easily |
| Supraspinous ligament | Firm | Some resistance to plunger |
| Interspinous ligament | Moderate, slightly spongy | Moderate resistance |
| Ligamentum flavum | Firm, gritty, elastic | Plunger bounces back firmly |
| Epidural space | Sudden reduction in tissue density | Plunger collapses / free injection |
| Dura mater | Resistance returns | — |
The key skill is recognising the ligamentum flavum. It runs from one lamina to the next, is thickest (5–6 mm) in the lumbar region, and has that characteristic gritty elastic resistance. When you feel this, you know you are close. Advance very slowly from this point — the epidural space is just millimetres ahead.
3.6 The Epidural Test Dose
Before injecting the full therapeutic dose, always give a test dose. This is non-negotiable.
Standard test dose: 3 mL of lignocaine (lidocaine) 1.5–2% with adrenaline 1:200,000 (5 mcg/mL)
This tests for two critical misplacements:
1. Intravascular injection (catheter in a vein):
- The adrenaline (15 mcg in 3 mL) causes an increase in heart rate of ≥ 20 bpm within 30–60 seconds if injected intravascularly
- Also: tinnitus, metallic taste, circumoral numbness from the lidocaine component
- Limitation: In laboring women under β-blockade, tachycardia may be blunted — use clinical judgment; watch for subjective symptoms too
2. Intrathecal injection (catheter through dura into CSF):
- 3 mL of 1.5% lidocaine = 45 mg lidocaine intrathecally → produces a dense motor block at the lower limbs within 3–5 minutes
- Ask the patient: "Can you feel/move your legs?" — sudden inability indicates inadvertent intrathecal placement
- If intrathecal: you have effectively performed a spinal — manage accordingly (convert to spinal technique or use as labour analgesia dose)
Aspiration first: Before test dose, aspirate the catheter. If blood aspirates → remove and resite. If CSF aspirates → you are intrathecal (see above). If negative → proceed with test dose.
Fractional dosing: Even after a negative test dose, always administer the full therapeutic dose in fractions (3–5 mL boluses, 3–5 minutes apart) while reassessing the patient after each bolus. This prevents the catastrophic consequences of accidentally injecting 20 mL of local anaesthetic into the intravascular compartment at once.
3.7 Thoracic Epidural — Special Considerations
Why thoracic is harder:
- Spinous processes at T5–T9 are steeply angled caudad → they overlap like roof tiles → the interlaminar window is much smaller and the needle must be angled 30–50° cephalad
- The epidural space is narrower at the thoracic level (< 3–4 mm)
- The dura is immediately behind the ligamentum flavum with minimal epidural fat → accidental dural puncture is easier
- The cord (not just cauda equina) is present at thoracic levels → dural puncture carries spinal cord injury risk
When to use thoracic epidural:
- Major thoracic surgery (thoracotomy, oesophagectomy)
- Major upper abdominal surgery (open hepatectomy, Whipple, aortic surgery)
- Rib fractures / chest trauma (superior to systemic opioids for respiratory function)
- Postoperative pain management where a high dermatomal band of analgesia is needed
Level selection:
- The catheter tip should be at the midpoint of the surgical incision's dermatomes
- For thoracotomy at T6–T7 incision → catheter at T6
- For upper laparotomy (T6–T10 incision) → catheter at T7–T8
- The paramedian approach is often preferred at the thoracic level — the steep spinous processes make midline access very difficult at T5–T9
3.8 Epidural Drugs and Dosing
Local Anaesthetics
| Drug | Concentration | Onset | Duration | Notes |
|---|---|---|---|---|
| Bupivacaine 0.5% | 5 mg/mL | 15–20 min | 2–3 hours | Surgical anaesthesia; max dose 2 mg/kg |
| Bupivacaine 0.1–0.25% | 1–2.5 mg/mL | 15–20 min | 1–2 hours | Labour analgesia — low motor block |
| Ropivacaine 0.75–1% | 7.5–10 mg/mL | 10–20 min | 2–3 hours | Less cardiotoxic than bupivacaine; more motor sparing |
| Ropivacaine 0.1–0.2% | 1–2 mg/mL | 15 min | 1–2 hours | Preferred for labour and postoperative epidural infusion |
| Lidocaine 2% | 20 mg/mL | 5–10 min | 1–1.5 hours | Fastest onset; rapid offset; useful for urgent epidural top-up |
| Chloroprocaine 3% | 30 mg/mL | 3–5 min | 30–45 min | Fastest epidural; used for urgent CS or rapid top-up |
| Levobupivacaine 0.5% | As bupivacaine | As bupivacaine | As bupivacaine | Less cardiotoxic; direct substitute for bupivacaine |
Standard epidural volumes:
- Lumbar (surgical): 15–25 mL of 0.5% bupivacaine or 0.75% ropivacaine
- Labour analgesia: 10–15 mL of 0.1% bupivacaine + fentanyl 2 mcg/mL
- Thoracic epidural infusion: 5–10 mL/h of 0.1–0.2% ropivacaine ± fentanyl
Epidural Opioids
Add to local anaesthetic to:
- Improve block quality
- Reduce local anaesthetic dose (reduce motor block and hypotension)
- Extend duration of postoperative analgesia
| Drug | Dose | Onset | Duration | Notes |
|---|---|---|---|---|
| Fentanyl | 50–100 mcg bolus; 2–5 mcg/mL in infusion | 5–10 min | 2–4 h | Lipophilic; minimal spread in CSF; mainly systemic absorption |
| Morphine | 2–4 mg epidural | 30–60 min | 12–24 h | Hydrophilic; rostral spread; delayed respiratory depression risk; monitor 24h |
| Sufentanil | 10–30 mcg | Fast | 4–6 h | More lipophilic than morphine; intermediate profile |
Additives to Epidural Solutions
- Adrenaline 1:200,000 (5 mcg/mL): Added to reduce vascular absorption, prolong block, and serve as a marker for intravascular injection. Improves block quality.
- Clonidine 1–2 mcg/mL: Prolongs epidural analgesia; may cause hypotension and sedation at higher doses
- Sodium bicarbonate: Alkalinises solution, ↑ proportion of un-ionised drug → faster onset (particularly useful with lidocaine)
3.9 Complications of Epidural Anaesthesia
A. Dural Puncture ("Wet Tap")
- Incidence with Tuohy needle: ~0.5–1.5% in experienced hands
- Recognition: CSF flowing freely from the needle hub; LOR syringe fills with clear fluid
- Consequence: Near-certain severe PDPH (Tuohy needle is 17–18G — very large hole in dura)
- Options:
- Re-site epidural at adjacent level and insert catheter carefully
- Deliberate intrathecal catheter placement — place the epidural catheter intrathecally as a continuous spinal catheter (use with very small doses, clearly label, intensive monitoring, manage PDPH with EBP when catheter removed)
- Prophylactic epidural blood patch (controversial; some evidence supports it)
B. Intravascular Injection / Catheter Migration
- Batson's venous plexus is rich — epidural catheters can enter vessels even after initially correct placement
- Prevention: Aspirate before every bolus, fractionate doses, use test dose
- Consequence of IV injection of epidural dose (15–20 mL of 0.5% bupivacaine):
- CNS: perioral tingling, tinnitus, metallic taste → confusion → seizures
- Cardiovascular: ventricular arrhythmias, bradycardia, cardiac arrest (bupivacaine "sodium channel lockout" — very difficult to resuscitate)
- Treatment of LA systemic toxicity (LAST): Lipid Emulsion Rescue — Intralipid 20% bolus 1.5 mL/kg IV, then infusion 0.25 mL/kg/min
C. Hypotension
- Slower and more predictable than spinal hypotension (can titrate)
- More easily prevented by co-loading and phenylephrine infusion in obstetrics
- Treatment: same as for spinal (phenylephrine, ephedrine, IV fluids)
D. High or Total Spinal from Accidental Intrathecal Injection
- If full epidural dose is given intrathecally → total spinal
- Risk: rapid deterioration, apnoea, cardiovascular collapse
- Management: Airway control (RSI), vasopressors, supportive care
E. Inadequate / Patchy Block
- One-sided block: Catheter lateralised; connective tissue septa in epidural space
- Window (missed segment): Septa preventing complete spread
- Solutions: Withdraw catheter 1 cm, reposition patient, top-up with larger volume, add different drug, re-site
F. Spinal Haematoma
- Same risk factors and management as for spinal haematoma
- Slightly higher risk with epidural catheter (more traumatic; catheter may damage vessels on manipulation)
- Monitor: unexpected return of motor deficit after resolution of block → urgent MRI
G. Epidural Abscess
- Rare but catastrophic
- Presents: back pain, fever, leukocytosis, then neurological deficit (days to weeks after catheter removal)
- Risk factors: immunosuppression, diabetes, prolonged catheter use, poor asepsis
- Diagnosis: MRI
- Treatment: urgent surgical drainage + antibiotics; outcome depends entirely on speed of diagnosis
MODULE 4 — COMPARISON TABLE: SPINAL vs. EPIDURAL AT A GLANCE
| Feature | Spinal | Epidural |
|---|---|---|
| Space entered | Subarachnoid (CSF) | Epidural (outside dura) |
| Needle used | 25–27G Whitacre/Sprotte | 17–18G Tuohy |
| Drug volume | 2–4 mL | 10–25 mL |
| Onset | 3–5 minutes | 10–20 minutes |
| Block quality | Dense, reliable | Variable, titrable |
| Duration | Fixed (single shot) | Unlimited (catheter) |
| Segmental block? | No | Yes (thoracic) |
| Motor block | Complete (standard) | Titrable (differential) |
| Cardiovascular effect | Rapid, pronounced | Slower, controllable |
| PDPH risk | Yes (needle gauge) | Yes (if wet tap) |
| Haematoma risk | Lower | Slightly higher |
| Main complication | Hypotension, PDPH | Dural puncture, IV injection |
| Best use | Lower limb, obstetrics, single-shot | Prolonged analgesia, thoracic |
MODULE 5 — COMBINED SPINAL-EPIDURAL (CSE)
The CSE technique combines the advantages of both:
- Spinal for immediate, dense onset
- Epidural catheter for prolonged use, titration, and rescue
Needle-through-needle technique:
- Identify epidural space with Tuohy needle (LOR as usual)
- Pass a long (120–130 mm) 25–27G pencil-point spinal needle through the Tuohy needle
- Advance until a "click" confirms dural puncture — free CSF flow
- Inject intrathecal dose (often reduced — 7.5–9 mg bupivacaine for CS + fentanyl 15–25 mcg)
- Remove spinal needle
- Thread epidural catheter as normal
- Use epidural for top-up if spinal wears off or block is inadequate
Applications: Caesarean section (most common), major lower limb surgery, hip replacement, prolonged urological surgery
Advantages: Faster onset than pure epidural + flexibility of catheter; lower LA dose for spinal = less hypotension
Disadvantages: Increased technical complexity; epidural top-up can cause high block if given while spinal still partial; epidural catheter reliability uncertain (no test of epidural space function until spinal wears off)
MODULE 6 — THE PROFESSOR'S CLINICAL SCENARIOS
Scenario 1. You perform a spinal for TURP using 10 mg hyperbaric bupivacaine. Five minutes later the patient's BP drops from 140/90 to 78/50, HR is 38 bpm. What has happened and what do you do?
Analysis: Block has reached T1–T4, blocking cardiac accelerator fibres. Combined effect: arterial vasodilation (↓ SVR) + venodilation (↓ preload) + bradycardia (cardiac accelerator blockade + Bezold-Jarisch reflex). This is a high spinal with combined cardiovascular crisis.
Immediate management:
- Call for help
- 100% O₂
- Trendelenburg or leg elevation (increases venous return)
- Atropine 0.3–0.6 mg IV (for bradycardia)
- Ephedrine 6–12 mg IV (α + β) — raises both HR and BP
- Epinephrine (adrenaline) 10–100 mcg IV if not responding — do not hesitate
- IV fluid bolus 500 mL
- Be prepared to intubate if consciousness deteriorates
Scenario 2. During labour epidural activation, after a negative test dose, you give the first 5 mL bolus of bupivacaine 0.5%. The patient immediately reports metallic taste, ringing in ears, and becomes confused. Her HR is 135 bpm.
Analysis: The catheter has migrated into the Batson's venous plexus. This is local anaesthetic systemic toxicity (LAST) — the test dose should have been positive but the heart rate response was perhaps missed.
Management:
- Stop all local anaesthetic immediately
- Call for emergency help, obstetric team
- 100% O₂ face mask, airway management ready
- If seizures: midazolam 1–2 mg IV or propofol 0.5–1 mg/kg to terminate (brief)
- Intralipid 20% — 1.5 mL/kg bolus IV (lipid sink — binds circulating bupivacaine)
- Continue Intralipid infusion 0.25 mL/kg/min
- If cardiac arrest: CPR + Intralipid + avoid vasopressin, calcium channel blockers, beta blockers (can worsen); use adrenaline in lower doses than standard (1–10 mcg/kg)
- Prolonged resuscitation — ECMO if available if refractory
Scenario 3. A patient is 36 hours post-labour epidural. The catheter has been removed. She presents with a severe positional headache — better lying flat, unbearable when standing. She is otherwise well.
Analysis: Post-dural puncture headache. The Tuohy needle has made a large dural hole → CSF leak → intracranial hypotension → traction on pain-sensitive structures when upright.
Management:
- Confirm diagnosis: Positional test — severe when upright, relieved within 30 minutes supine
- Conservative first (24–48 h): Bed rest, oral/IV hydration, paracetamol, NSAIDs, caffeine (300 mg oral bd or IV)
- If not resolving → Epidural Blood Patch (EBP):
- Under strict aseptic conditions, re-perform epidural at same or adjacent level
- Draw 15–20 mL of autologous blood from the patient's arm (IV cannula)
- Inject slowly into epidural space — patient will feel back pressure and may feel leg paraesthesia when 10–15 mL in
- Blood clot tamponades the dural hole; CSF pressure rises immediately
- Success: 70% complete relief with first EBP; 90–95% after second EBP
- Severe PDPH with focal neurology or other features → MRI to exclude subdural haematoma (extremely rare but can occur from bridging vein tear under low CSF pressure)
SUMMARY: THE RESIDENT'S MENTAL FRAMEWORK
NEURAXIAL ANAESTHESIA — CORE FRAMEWORK

ANATOMY           TECHNIQUE          PHARMACOLOGY      COMPLICATIONS
─────────         ─────────          ────────────      ────────────
Know your layers  Spinal:            Local anaesthetic Hypotension
  Supraspinous    25G Whitacre       Bupivacaine 0.5%  Bradycardia
  Interspinous    Lateral/sitting    Hyperbaric        High/total spinal
  Lig. flavum     L3-4, L4-5        Ropivacaine       PDPH
  Epidural space  Clear CSF = good  Levobupivacaine   Spinal haematoma
  Dura                               Prilocaine        LA toxicity
  Subarachnoid    Epidural:                            TNS
                  18G Tuohy needle   Intrathecal add:  Epidural abscess
Tuffier's line    LOR with saline    Fentanyl 25 mcg
= L4-L5           Test dose ALWAYS   Morphine 0.1 mg
                  3cm catheter in    Clonidine 30 mcg
Cord ends L1-2   Fractionate doses
  Below = safe
                  ASRA timings       Order of block:
                  for anticoagulants Autonomic > Pain
                  are MANDATORY      > Motor (highest)
                  check before every Sympathetic
                  neuraxial block    +2-6 levels above
                                     sensory
The three rules I want you to take from this session:
- Know your anatomy before you pick up the needle — feel it in your mind before you feel it with your hands
- Test dose before every epidural bolus — no exceptions, ever
- Haematoma after neuraxial = urgent MRI and neurosurgery call — do not wait to see if "the block is just wearing off slowly"
Sources: Miller's Anesthesia, 10e (Chapters 41, 74); Morgan & Mikhail's Clinical Anaesthesiology, 7e (Chapters 41, 45); Barash, Cullen & Stoelting's Clinical Anaesthesia, 9e (Chapters 11, 14–15); ASRA Evidence-Based Guidelines, 4th Edition (Horlocker et al., 2018)
Any section you want me to drill deeper — the pharmacology of LA toxicity, the obstetric spinal in detail, troubleshooting a failed epidural, or ASRA anticoagulation guidelines? We go wherever you need.
This is a shared conversation. Sign in to Orris to start your own chat.