
49
- Mathematics: 49 = 7², making it a perfect square. It's also the sum of three squares: 1² + 2² + 6² or other combinations.
- It's odd: 49 is an odd composite number with divisors 1, 7, and 49.
- Hexadecimal: 49 in hex is 0x31.
- Roman numerals: XLIX.
49 yr old female pt having complain of excessive hot flushes and body weakness in morning ,no fever no cough no weight loss
menopause hot flushes management
menopause hot flushes pathophysiology diagram
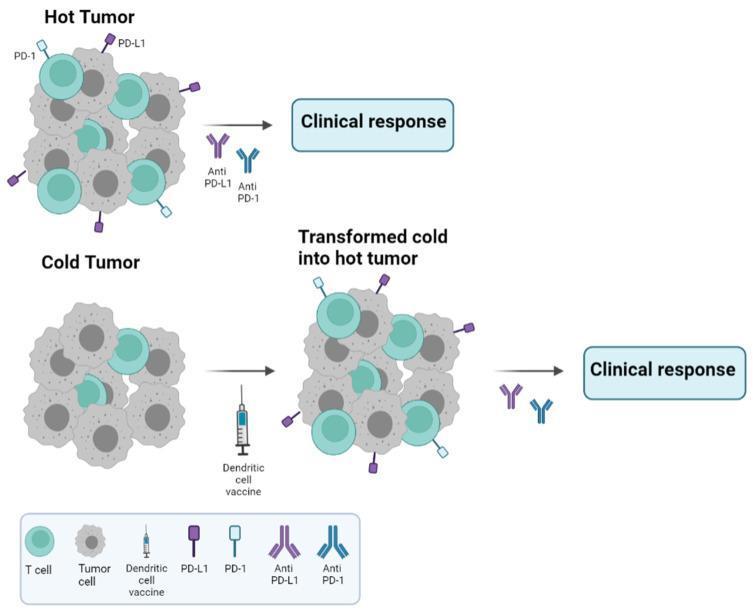
A pathophysiology diagram illustrating the differences between 'Hot' and 'Cold' tumors and the role of immunotherapy in oncological treatment. The top section depicts a 'Hot Tumor' microenvironment characterized by high infiltration of T cells (teal circles) and significant expression of PD-1 (light blue) and PD-L1 (purple) surface markers. This state leads to a favorable clinical response when treated with anti-PD-1 and anti-PD-L1 monoclonal antibodies. The bottom section shows a 'Cold Tumor' with minimal T-cell infiltration and absence of PD-L1/PD-1 markers, typically resulting in poor immunotherapy outcomes. A therapeutic pathway is illustrated showing the use of a Dendritic Cell (DC) vaccine to convert a 'Cold Tumor' into a 'Transformed cold into hot tumor.' This transformation increases lymphocyte infiltration and upregulates PD-1/PD-L1 axis expression, thereby priming the tumor for a subsequent clinical response to immune checkpoint inhibitors. The diagram emphasizes key concepts in immuno-oncology, including tumor microenvironment remodeling and the synergistic potential of combining vaccines with checkpoint blockade.
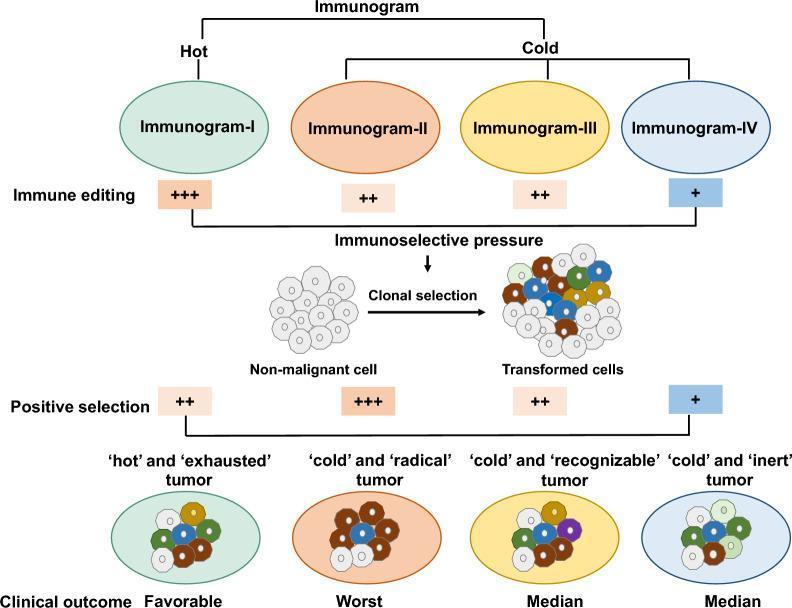
A pathophysiology diagram illustrating the 'Immunogram' framework for classifying cancer-immunity phenotypes. The flow chart categorizes tumors into 'Hot' (Immunogram-I) and 'Cold' (Immunogram-II, III, and IV). The diagram maps the relationship between immune editing, positive selection, and clinical outcomes through the lens of clonal selection. Immunogram-I ('hot' and 'exhausted') is characterized by high immune editing (+++) and moderate positive selection (++), leading to a favorable clinical outcome. In the 'Cold' category, Immunogram-II ('radical') shows high positive selection (+++) and moderate immune editing (++), resulting in the worst clinical outcome. Immunogram-III ('recognizable') and Immunogram-IV ('inert') are associated with median outcomes, with Immunogram-IV exhibiting the lowest levels of both immune editing (+) and positive selection (+). Central to the diagram is a visual representation of clonal selection, showing non-malignant cells transforming into heterogeneous 'transformed cells' under immunoselective pressure. This model integrates tumor immunology with evolutionary biology to predict patient survival and potential responses to immunotherapy across diverse solid tumor types.
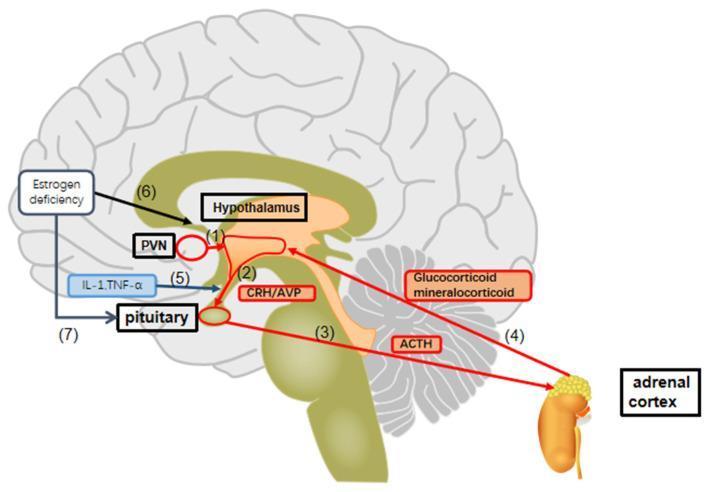
This pathophysiology diagram illustrates the Hypothalamic-Pituitary-Adrenal (HPA) axis and its modulation by estrogen deficiency and inflammatory cytokines. The visual content is organized into a sagittal cross-section of the human brain linked to the peripheral adrenal cortex. Key anatomical structures include the hypothalamus (specifically the paraventricular nucleus, PVN), the pituitary gland, and the adrenal gland. The hormonal cascade is shown via numbered red arrows: (1) and (2) release of CRH and AVP from the hypothalamus acting on the pituitary; (3) pituitary secretion of ACTH stimulating the adrenal cortex; and (4) subsequent release of glucocorticoids and mineralocorticoids which provide negative feedback to the brain. Modulatory pathways are represented by black and blue arrows: (6) and (7) depict how estrogen deficiency impacts the hypothalamus and pituitary, leading to HPA axis overactivation; (5) indicates the inhibitory influence of inflammatory cytokines IL-1 and TNF-alpha. This diagram serves as an educational tool for understanding neuroendocrine regulation and the impact of menopause-related hormonal changes on stress response systems.
Clinical Assessment: 49-Year-Old Female with Hot Flushes and Body Weakness
Most Likely Diagnosis: Perimenopause / Menopausal Transition
Pathophysiology
"The loss of estrogens often causes marked physiological changes in the function of the body, including (1) 'hot flushes,' characterized by extreme flushing of the skin; (2) psychic sensations of dyspnea; (3) irritability; (4) fatigue; (5) anxiety; and (6) decreased strength and calcification of bones."
- Guyton & Hall Textbook of Medical Physiology
Typical Symptoms of Perimenopause/Menopause
| Symptom Category | Examples |
|---|---|
| Vasomotor | Hot flushes, night sweats, palpitations |
| Sleep | Insomnia, early morning waking, fatigue |
| Musculoskeletal | Body aches, weakness, joint pain |
| Genitourinary | Vaginal dryness, dyspareunia, urinary urgency |
| Psychological | Irritability, anxiety, mood swings, poor concentration |
| Metabolic | Weight gain, risk of osteoporosis, cardiovascular risk |
Investigations to Order
- Serum FSH - elevated (>25-30 IU/L in menopausal range)
- Serum LH - elevated
- Serum Estradiol (E2) - low/declining
- TSH - to rule out hypothyroidism (can also cause fatigue and cold/heat intolerance)
- CBC - to rule out anaemia (fatigue)
- Blood glucose (FBS) - to rule out diabetes
- Serum calcium, Vit D - bone health baseline
- Lipid profile - cardiovascular risk rises post-menopause
- Menstrual history - irregular cycles confirm perimenopause
Note: Menopause is clinically diagnosed after 12 consecutive months of amenorrhea with no other cause. FSH elevation supports but is not mandatory for diagnosis. (Lippincott Pharmacology)
Differential Diagnoses to Consider
| Condition | Distinguishing Feature |
|---|---|
| Hypothyroidism | TSH elevated; cold intolerance, weight gain, constipation |
| Hyperthyroidism | TSH low; tremor, tachycardia, heat intolerance |
| Anaemia | Low Hb; pallor, exertional dyspnoea |
| Depression/Anxiety | Mood symptoms predominate |
| Carcinoid syndrome | Flushing + diarrhoea + wheezing (rare) |
| Phaeochromocytoma | Episodic hypertension + headache + sweating |
Management
1. Hormone Therapy (HT) - First Line for Moderate-to-Severe Vasomotor Symptoms
- Estrogen is the most effective treatment for hot flushes
- If the uterus is intact: use estrogen + progestogen (to prevent endometrial hyperplasia/carcinoma from unopposed estrogen)
- If post-hysterectomy: estrogen alone is sufficient
- Available as: oral, transdermal patch, topical gel, vaginal ring
- Use the lowest effective dose for the shortest necessary duration
- Current evidence: if started before age 60 or within 10 years of menopause, benefits likely outweigh risks in low-risk women (Guyton & Hall)
- Risks to counsel: slightly increased cardiovascular events and breast cancer (with long-term combined HT)
2. Non-Hormonal Options (for women who cannot use HT)
| Drug | Mechanism | Notes |
|---|---|---|
| SSRIs (paroxetine, escitalopram) | Serotonin modulation | Reduces hot flush frequency by ~50% |
| SNRIs (venlafaxine) | Serotonin-norepinephrine | Good evidence |
| Gabapentin | GABAergic | Especially effective for night sweats |
| Fezolinetant (newer) | NK3 receptor antagonist | Targets thermoregulatory pathway in hypothalamus; recent 2024 systematic review confirms efficacy vs. HT |
| Clonidine | Central alpha-2 agonist | Modest benefit |
3. Lifestyle Measures
- Avoid triggers: hot drinks, spicy food, alcohol, caffeine, hot environments
- Light, layered clothing; cool sleeping environment
- Regular aerobic exercise - also helps weakness and mood
- Yoga has evidence for menopausal symptom relief (2025 meta-analysis, PMID 39467491)
- Adequate calcium and Vitamin D intake (bone protection)
- Maintain healthy weight
4. Monitoring
- Periodic reassessment - try tapering HT every 6-12 months to check if symptoms recur
- Screen for osteoporosis (DEXA scan)
- Lipid profile and blood pressure monitoring annually
- Breast examination and mammography
Summary for This Patient
- Confirm with FSH, LH, E2, TSH
- Assess symptom severity and quality-of-life impact
- If moderate-to-severe symptoms: offer HT (with progestogen if uterus intact) at lowest effective dose
- If HT is contraindicated: SSRIs/SNRIs or gabapentin
- Address bone health, cardiovascular risk, and lifestyle modifications
Sources: Guyton & Hall Textbook of Medical Physiology; Goldman-Cecil Medicine; Lippincott Illustrated Reviews Pharmacology
Hot flushes cause
hot flushes vasomotor thermoregulation estrogen deficiency mechanism
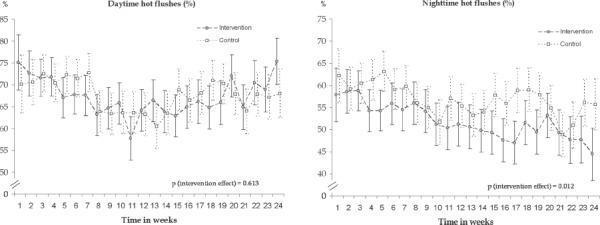
This figure contains two side-by-side line graphs depicting the longitudinal results of a clinical study on menopausal hot flushes over a 24-week period. The y-axes represent the observed weekly frequency percentage (%), while the x-axes denote time in weeks (1-24). Each graph compares an 'Intervention' group (dark circles with dashed lines) to a 'Control' group (open squares with dotted lines). The left graph displays 'Daytime hot flushes (%)', showing similar fluctuating trends between groups with overlapping 95% confidence intervals and a non-significant intervention effect (p = 0.613). The right graph displays 'Nighttime hot flushes (%)', demonstrating a more pronounced downward trend in the intervention group compared to the control group, reaching statistical significance (p = 0.012). Vertical error bars represent 95% confidence intervals for each weekly data point. This visual is used to evaluate the efficacy of clinical interventions on vasomotor symptoms in symptomatic women aged 40–63 years.
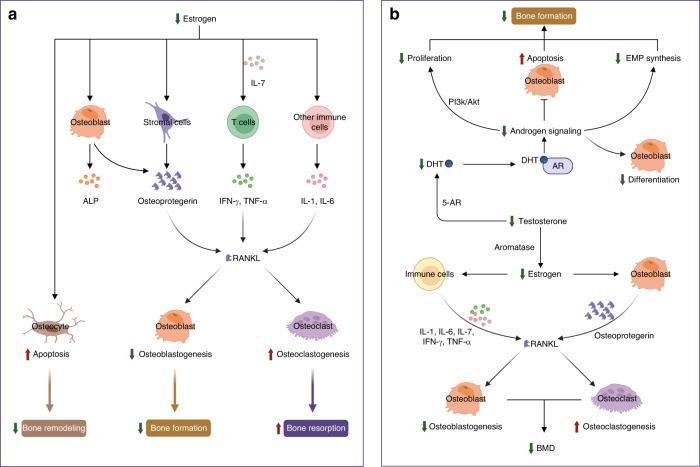
Two-part medical schematic diagram illustrating the molecular signaling pathways of sex steroid hormones on bone homeostasis. Panel A depicts the mechanism of estrogen deficiency on bone cells. Decreased estrogen levels lead to increased osteocyte apoptosis (reducing bone remodeling) and influence stromal and immune cells (T cells, IL-7, IFN-γ, TNF-α, IL-1, IL-6) to upregulate RANKL. This results in decreased osteoblastogenesis (reducing bone formation) and increased osteoclastogenesis (increasing bone resorption). Panel B illustrates the effects of male sex hormones. Decreased testosterone leads to reduced DHT via 5-alpha-reductase, impairing androgen signaling. This represses osteoblast proliferation (via PI3k/Akt), differentiation, and EMP synthesis while increasing osteoblast apoptosis. Additionally, the conversion of testosterone to estrogen via aromatase is reduced, further driving the RANKL-mediated shift toward increased osteoclastogenesis and decreased osteoblastogenesis, ultimately leading to reduced bone mineral density (BMD).
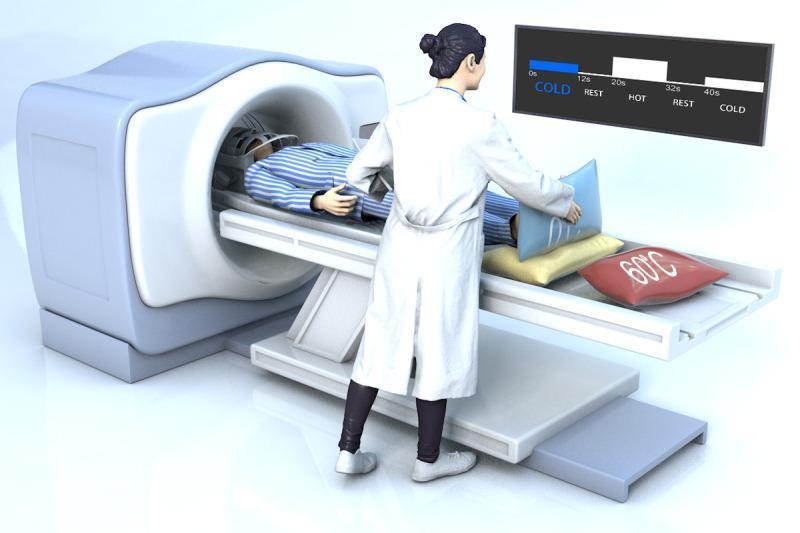
This illustration presents a schematic of a task-based functional Magnetic Resonance Imaging (fMRI) experimental setup designed for thermoregulation research. A human subject is positioned supine on the scanner bed with the head secured within a 64-channel head coil. A researcher in a white lab coat is shown administering thermal stimuli to the subject's lower limbs. The experimental protocol is detailed via an inset digital display showing a block design timeline: a 12-second 'COLD' block (0°C ice-water mixture), an 8-second 'REST' period, and a 'HOT' block (60°C warm compress), followed by further cycles. These stimuli are represented physically by labeled thermal bags (blue for cold, red marked '60°C' for hot) placed on the scanner platform. The design aims to stimulate cutaneous thermoreceptors to observe blood oxygen level-dependent (BOLD) signal changes in the preoptic and anterior hypothalamic (POAH) regions. This setup is clinically relevant for mapping functional hypothalamic areas in patients with brain tumors, such as craniopharyngiomas, to assist in surgical planning and preserving thermoregulatory function.
Causes of Hot Flushes
1. Primary Mechanism - Estrogen Withdrawal / Deficiency
Estrogen ↓  →  Reduced negative feedback on hypothalamus
             →  FSH ↑ + LH ↑ (episodic LH surges every 30-60 min)
             →  Each LH burst coincides with a hot flush episode
             →  Hypothalamic "thermostat" narrows its thermoneutral zone
             →  Peripheral vasodilation + sweating triggered inappropriately
"Each hot flush begins with the start of a burst of LH secretion. However, LH itself is not responsible - because symptoms continue after pituitary removal. Instead, some estrogen-sensitive event in the hypothalamus initiates both the LH release and the flushing episode."
- Ganong's Review of Medical Physiology
2. Causes of Hot Flushes - Complete Classification
A. Physiological / Hormonal
| Cause | Mechanism |
|---|---|
| Menopause / Perimenopause | Estrogen withdrawal; most common cause |
| Bilateral oophorectomy (surgical menopause) | Abrupt, severe estrogen loss |
| Premature ovarian insufficiency | Estrogen deficiency before age 40 |
| Postpartum period | Estrogen drop after delivery |
B. Drug-Induced (Iatrogenic)
| Drug | Mechanism |
|---|---|
| GnRH agonists (leuprolide, goserelin) | Suppress LH/FSH → medical castration → hot flushes |
| GnRH antagonists (degarelix, abarelix) | Direct gonadotropin suppression |
| Anti-estrogens (tamoxifen, raloxifene) | Estrogen receptor blockade |
| Aromatase inhibitors (anastrozole, letrozole) | Block estrogen synthesis |
| Androgen deprivation therapy in prostate cancer | Testosterone suppression → hot flushes in men |
| Opioid withdrawal | Sympathetic rebound |
| Niacin | Prostaglandin-mediated peripheral vasodilation |
| Calcium channel blockers | Vasodilation |
| Disulfiram | Aldehyde accumulation |
C. Pathological - Other Medical Conditions
| Condition | Key Distinguishing Features |
|---|---|
| Carcinoid syndrome | Hot flushes + diarrhoea + wheezing + abdominal pain; urinary 5-HIAA elevated |
| Phaeochromocytoma | Episodic hypertension + headache + palpitations + diaphoresis |
| Hyperthyroidism | Heat intolerance, weight loss, tachycardia, tremor, TSH low |
| Mastocytosis | Skin lesions (urticaria pigmentosa) + pruritus; histamine release |
| VIPoma (Verner-Morrison syndrome) | Profuse watery diarrhoea + flushing |
| Medullary thyroid carcinoma | Elevated calcitonin; flushing due to histamine/serotonin |
| Renal cell carcinoma | Paraneoplastic flushing |
| Lymphoma (especially Hodgkin's) | Pel-Ebstein fever + night sweats (but fever usually present) |
| Neurological (spinal cord lesions, autonomic dysfunction) | Disrupted thermoregulatory pathways |
| Dumping syndrome (post-gastrectomy) | Flushing after meals |
| Rosacea | Facial flushing triggered by heat, alcohol, spicy food |
| Alcohol/food triggers | Vasodilatory effect |
D. Psychological
| Cause | Notes |
|---|---|
| Anxiety disorder / Panic attacks | Sympathetic surge → flushing, sweating, palpitations |
| Stress | Catecholamine release |
3. In Context of This 49-Year-Old Patient
Perimenopause - estrogen withdrawal causing hypothalamic thermoregulatory instability
- Hyperthyroidism (TSH)
- Carcinoid (if GI symptoms present - 5-HIAA in urine)
- Phaeo (if hypertension/headache - urinary catecholamines)
- Drug causes (check medication history)
4. Summary - Key Memory Aid
Hot Flushes CAMP mnemonic:

C - Carcinoid / Castration (surgical or medical)
A - Anti-estrogens / Anxiety / Aromatase inhibitors
M - Menopause (perimenopause - most common)
P - Phaeochromocytoma / Premature ovarian failure
Sources: Ganong's Review of Medical Physiology; Goldman-Cecil Medicine; Katzung's Basic & Clinical Pharmacology