

Explain this
Type 1 diabetes mellitus pathogenesis autoimmune beta cell destruction T cells pancreas
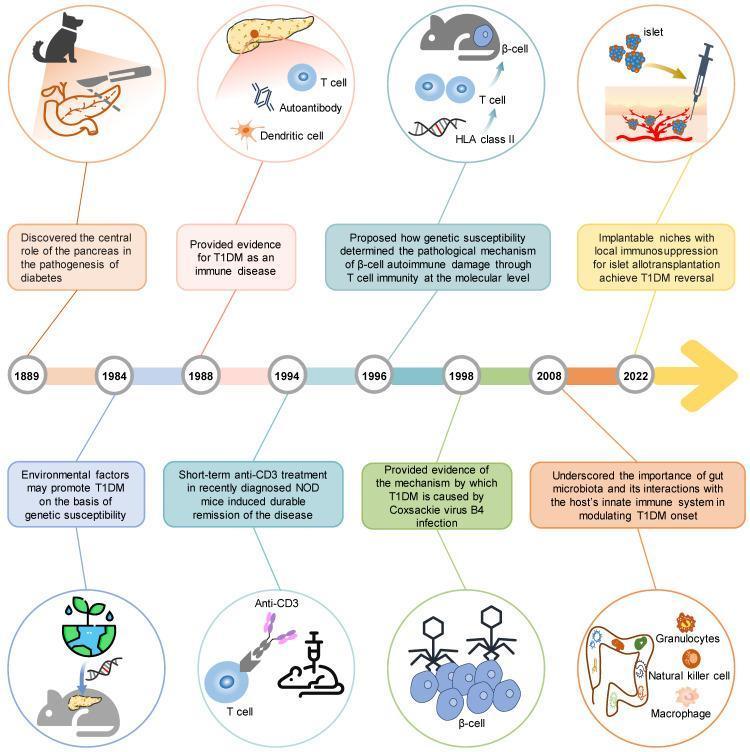
An educational infographic timeline illustrating a century of scientific milestones in Type 1 Diabetes Mellitus (T1DM) research, focusing on pathogenesis and therapeutic interventions. The diagram transitions from the discovery of the pancreas's role in 1889 (depicted by a surgical pancreatectomy icon) to modern strategies like implantable niches in 2022. Key educational concepts include the autoimmune nature of T1DM, represented by circular insets showing T-cell, autoantibody (Y-shaped), and dendritic cell interactions with pancreatic beta-cells. Genetic and molecular mechanisms are highlighted through illustrations of HLA Class II molecules and DNA helices. Clinical advancements featured include environmental triggers (virus-induced autoimmunity via Coxsackie virus B4), immunological therapies (anti-CD3 antibodies in NOD mouse models), and the role of gut microbiota (depicting granulocytes and natural killer cells in the intestine). The visual serves as an overview of how animal models and genetic engineering have elucidated beta-cell destruction and informed transplantation techniques using syringe-mediated islet delivery into engineered microenvironments.
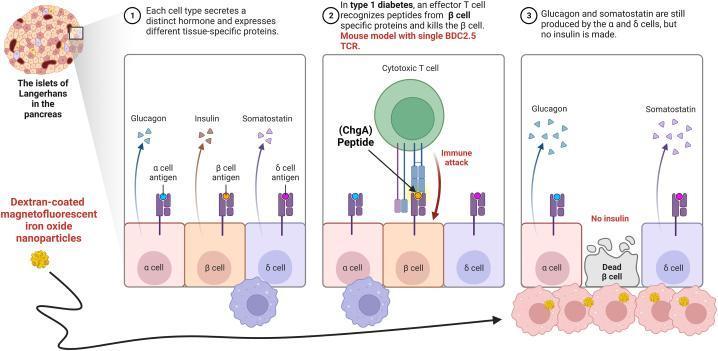
This pathophysiology diagram illustrates the cellular mechanisms of Type 1 Diabetes (T1D) within a pancreatic islet of Langerhans. The diagram is divided into three sequential panels. Panel 1 shows healthy endocrine cells: alpha (α) cells secreting glucagon, beta (β) cells secreting insulin, and delta (δ) cells secreting somatostatin, each expressing specific surface antigens. Panel 2 depicts an 'immune attack' phase where an autoreactive cytotoxic T cell recognizes a Chromogranin A (ChgA) peptide presented on the β-cell surface. Panel 3 illustrates the outcome: selective β-cell destruction ('Dead β cell') and the absence of insulin production, while α and δ cells remain intact and functional. The diagram also highlights the role of diagnostics, showing dextran-coated magnetofluorescent iron oxide nanoparticles being internalized by infiltrating macrophages and monocytes (insulitis). These nanoparticles serve as contrast agents for MRI to visualize microvascular leakage and inflammation in the pancreas. This educational tool demonstrates the transition from normal hormonal homeostasis to autoimmune-mediated islet dysfunction.
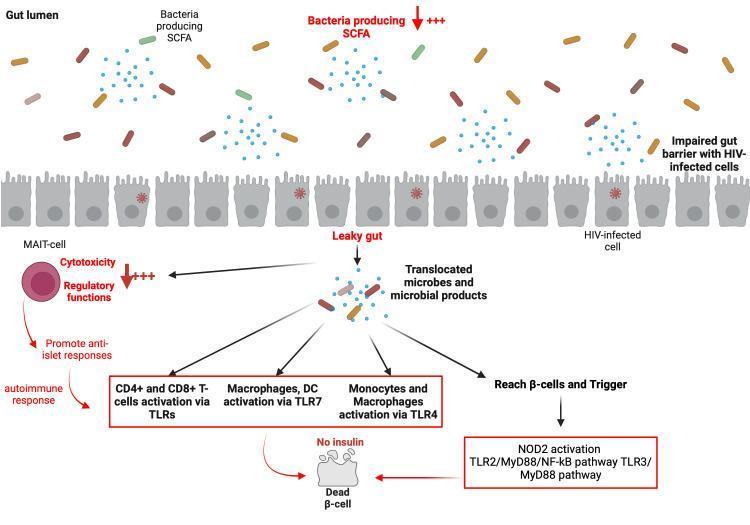
This pathophysiology diagram illustrates the link between HIV-associated gut dysbiosis and the development of Type 1 Diabetes Mellitus (T1DM). The upper section shows the gut lumen with decreased short-chain fatty acid (SCFA)-producing bacteria. An impaired gut barrier is depicted with HIV-infected epithelial cells, leading to a 'leaky gut' and the translocation of microbes and microbial products into the systemic circulation. This translocation triggers two primary pathways: 1) Systemic immune activation via Toll-like receptors (TLRs), involving CD4+/CD8+ T-cells, macrophages, dendritic cells (DCs), and monocytes, which promotes an autoimmune anti-islet response. 2) Direct interaction of microbial products with pancreatic beta cells, triggering intracellular signaling pathways including NOD2, TLR2/MyD88/NF-kB, and TLR3/MyD88. The diagram further highlights the role of Mucosal-Associated Invariant T (MAIT)-cells, which exhibit altered cytotoxicity and regulatory functions under these conditions. The final outcome is pancreatic beta-cell destruction (dead beta-cell) and the cessation of insulin production, illustrating a proposed mechanism for secondary autoimmune diabetes in people living with HIV (PLWH).
What the Diagram Shows
Top Section - Insulin Secretion Mechanism (Normal Beta Cell)
- A protein signal triggers membrane depolarization
- The mitochondria respond to glucose metabolism
- This causes an influx of Ca²⁺ through calcium channels
- The calcium influx triggers insulin vesicle exocytosis (insulin release into the blood)
The Main Flowchart: Pathogenesis of Type 1 DM
1. Genetic Abnormality + Environmental Trigger
- Genetic susceptibility - most notably mutations in HLA (Human Leukocyte Antigen) genes, particularly HLA-DR3 and HLA-DR4 alleles. These genes control immune recognition.
- Environmental triggers - viral infections (e.g., Coxsackievirus B4, enteroviruses), dietary factors, or gut microbiome changes can "switch on" the autoimmune process in genetically predisposed individuals.
2. Loss of Self-Tolerance
3. Self-Reactive Clonal T Cells Are NOT Killed in the Thymus
- Normally, T cells that react against the body's own tissues are destroyed in the thymus in a process called clonal deletion (part of central tolerance).
- In T1DM, this process fails - some auto-reactive T cells escape the thymus and enter circulation.
- These T cells are "clonal" meaning they multiply and target a specific self-antigen (beta cell proteins like GAD65, insulin, IA-2).
4. Attack on Pancreatic Beta Cells
- The escaped self-reactive T cells travel to the pancreas and directly attack the insulin-producing beta cells.
- The beta cells are recognized as autoantigens (self-proteins mistakenly identified as foreign).
- This causes insulitis - a chronic inflammatory infiltrate within the islets of Langerhans.
- As confirmed by the Tietz Textbook of Laboratory Medicine: "destruction is mediated by T cells... The islet cells have a chronic mononuclear cell infiltrate, called insulitis."
- Importantly, only beta cells are destroyed - the alpha cells (glucagon) and delta cells (somatostatin) are spared.
5. Decrease in Insulin
- Progressive beta cell destruction reduces insulin production.
- An 80-90% reduction in beta cell mass is required before clinical symptoms appear - meaning significant silent damage occurs before diagnosis.
6. Hyperglycemia
- Without insulin, glucose cannot enter cells.
- Blood glucose rises - hyperglycemia (the hallmark of diabetes).
- This leads to all the classic symptoms: polyuria, polydipsia, polyphagia, and weight loss.
Why T1DM Is Different from T2DM
| Feature | Type 1 DM | Type 2 DM |
|---|---|---|
| Cause | Autoimmune destruction of beta cells | Insulin resistance + relative insulin deficiency |
| Age of onset | Usually childhood/young adult | Usually adult (but rising in youth) |
| Body habitus | Often lean | Often overweight/obese |
| Insulin required | Always (absolute deficiency) | Not always (initially managed with oral drugs) |
| Autoantibodies | Present (GAD65, IAA, ICA, ZnT8) | Absent |
Key Autoantibodies in T1DM (Detected Before Symptoms)
- GAD65 antibodies (GADA) - found up to 10 years before clinical onset (~60% of new T1DM)
- Insulin autoantibodies (IAA) - present in ~80-90% of children who develop T1DM before age 5
- Islet cell cytoplasmic antibodies (ICA) - found in 75-85% of newly diagnosed patients
- ZnT8 antibodies and IA-2 antibodies