
Overview from standard sources miller, morgan with reference of pediatric anesthesia, viva ty0e during a case of pediatric anesthesia for adenoyonsillectomy
Reading File
Now let me search the library for pediatric anesthesia and adenotonsillectomy content across multiple sources simultaneously.
Finding Sources
Finding Sources
Finding Sources
Finding Sources
Finding Sources
Finding Sources
Finding Sources
Now let me read the key sections from Miller's and Barash on tonsillectomy/adenoidectomy anesthesia in parallel:
Reading File
Reading File
Reading File
Reading File
Reading File
Excellent content from Barash. Let me read more of that detailed section and also get the Morgan section:
Reading File
Reading File
I now have rich content from Miller's, Barash (Stoelting), and Morgan & Mikhail. Let me compile the comprehensive viva-style overview.
Pediatric Anesthesia for Adenotonsillectomy: Viva Overview
Sources: Miller's Anesthesia 10e, Morgan & Mikhail's Clinical Anesthesiology 7e, Barash/Stoelting's Clinical Anesthesia 9e
1. INDICATIONS FOR ADENOTONSILLECTOMY
Q: What are the indications for adenotonsillectomy in children?
- Recurrent/chronic tonsillitis (most common) - typically defined as >7 episodes/year or >5/year for 2 consecutive years
- Peritonsillar abscess
- Tonsillar/adenoidal hyperplasia with airway obstruction
- Obstructive Sleep Apnea Syndrome (OSAS) - most important anesthetic concern
- Failure to thrive, speech disorders, dental abnormalities from chronic obstruction
- Cardiac valvular disease with recurrent streptococcal bacteremia
- Malignant disease (lymphoma - important caveat for dexamethasone use)
(Barash 9e, p.4079)
2. PREOPERATIVE EVALUATION - KEY VIVA POINTS
Q: What is your preoperative focus for this child?
A - Airway assessment:
- Size of tonsils and adenoids
- Degree of nasopharyngeal obstruction
- Mouth opening, neck mobility
B - Screen for OSAS:
- Snoring, witnessed apneas, restless sleep, daytime somnolence, nocturnal enuresis, behavioral changes
- The "gold standard" is polysomnography (PSG)
- Apnea-Hypopnea Index (AHI): severe OSA = AHI >10 AND oxygen saturation nadir <80%
- Barash: "Despite only mild-to-moderate tonsillar enlargement, these patients have upper airway obstruction while awake and apnea during sleep - do not underestimate severity based on tonsillar size alone"
C - Cardiac comorbidities from chronic OSAS:
- Cor pulmonale - right ventricular hypertrophy, cardiomegaly
- Pulmonary hypertension, systemic hypertension
- ECG for RVH; CXR for cardiomegaly
- Each apneic episode spikes pulmonary artery pressure further
D - Recent URTI:
- Active fever or productive cough = grounds for postponement
- Recent URTI within 2-4 weeks increases risk of laryngospasm, bronchospasm
E - Coagulation status:
- History of bleeding, family bleeding history
- Platelet count, clotting screen if indicated
F - Obesity:
- Obese children: especially high risk for OSA, opioid sensitivity, respiratory arrest post-op (Miller 10e, Morgan 7e, Barash 9e)
3. PEDIATRIC AIRWAY - ANATOMICAL DIFFERENCES (VIVA FAVORITE)
Q: How is the pediatric airway different from adult?
| Feature | Pediatric | Clinical Implication |
|---|---|---|
| Head | Proportionately larger | Sniffing position - less neck extension needed |
| Tongue | Larger relative to oral cavity | Higher risk of obstruction |
| Larynx | Anterior and cephalad (C3-C4 vs C4-C5 in adult) | More anterior - view can be difficult |
| Epiglottis | Longer, floppy, U-shaped | Use straight blade (Miller) for better lift |
| Narrowest point | Cricoid ring (<5 years) vs glottis in adults | Uncuffed tube may leak; cuffed tubes now safe if chosen correctly |
| Trachea | Shorter | Higher risk of endobronchial intubation |
| Nasal breathers | Until ~5 months | Obligate nasal breathers - blocked nose = respiratory distress |
| FRC | Reduced (chest wall very compliant) | Rapid desaturation during apnea |
(Morgan & Mikhail 7e, p.1671; Barash 9e)
Q: What is the formula for uncuffed ETT size?
- (Age/4) + 4 for uncuffed; (Age/4) + 3.5 for cuffed
- Confirm with air leak at 15-20 cmH2O (uncuffed) or cuff pressure <20 cmH2O
4. ANESTHETIC INDUCTION
Q: How would you induce anesthesia?
Inhalational induction (preferred in children):
- Sevoflurane is the agent of choice - greater therapeutic index than halothane
- MAC of sevoflurane is highest in infants (2.5%) vs adults (2.0%)
- Inhalational induction followed by IV cannulation
- Glycopyrrolate 10 mcg/kg IV after IV access - reduces secretions, attenuates bradycardia
IV induction (if IV access present or older child):
- Propofol 3-4 mg/kg + fentanyl 1-2 mcg/kg
- Ketamine useful if haemodynamically compromised
Q: What is important about MAC in pediatric patients?
- MAC is highest in infants (not neonates), decreasing with age
- Exception: sevoflurane MAC shows no difference between neonates and infants
- Physiological reason: higher alveolar ventilation/FRC ratio, greater cardiac output to vessel-rich group = faster wash-in of volatile agents (Morgan & Mikhail 7e)
5. AIRWAY DEVICE
Q: ETT or LMA for adenotonsillectomy?
Options:
- Oral RAE (Ring-Adair-Elwyn) preformed ETT - most commonly used; taped in the midline to mandible; keeps tube out of surgical field; risk of kinking with mouth gag
- Wire-reinforced (armored) ETT - resistant to kinking
- Flexible LMA - used in some centers; kinking/displacement with Boyle-Davis gag is a concern; requires experienced team; advantage of avoiding laryngoscopy
Key points:
- Tube taped in midline of mandible (not corner of mouth)
- After gag placement: always recheck tube position - kinking or displacement is not uncommon
- ETT cuff inflation pressure must be checked after position change (neck extension for surgery)
- Throat pack placement by surgeon - mandatory documentation, must be removed before extubation (Miller 10e, p.9812; Barash 9e)
6. MAINTENANCE OF ANESTHESIA
Q: What agents do you use for maintenance?
- Either volatile (sevoflurane/isoflurane) or TIVA (propofol infusion) - both acceptable
- TIVA preferred by some due to reduced PONV, no theatre pollution, cleaner emergence
- Opioids: Fentanyl or morphine (use cautiously in OSA - reduce dose by up to 50%)
- Dexamethasone 0.15-0.5 mg/kg IV: reduces PONV, reduces postoperative swelling, improves oral intake
- CONTRAINDICATED if lymphoma is suspected - may cause lethal hyperkalemia from tumor lysis
- NSAIDs (e.g., ketorolac, ibuprofen): good evidence for analgesia without increased bleeding risk, though some surgeons avoid
- Paracetamol/acetaminophen: inadequate alone for tonsillectomy pain
- Ondansetron for PONV prophylaxis
- Local anaesthetic infiltration to tonsillar bed (with or without epinephrine) by surgeon - caution: injection into tonsillar vessels beneath tonsillar bed can cause seizures or cerebral infarction (Miller 10e; Barash 9e, p.10647)
Q: Why avoid NSAIDs in some centers?
- Theoretical concern about platelet dysfunction and post-tonsillectomy haemorrhage
- Evidence: bleeding rate NOT significantly increased with NSAIDs; most guidelines support their use
- Individual surgeon/institutional preference governs
7. OSA AND OPIOID SENSITIVITY - CRITICAL VIVA POINT
Q: Why are OSA children sensitive to opioids?
- Chronic intermittent hypoxemia upregulates central opioid receptors
- Altered CO2 response curves - blunted hypercapnic drive
- Risk of post-op respiratory arrest even with standard doses
- Reduce opioid dose by up to 50% in OSA patients (Barash 9e, Key Point 3)
- Maximize non-opioid multimodal analgesia
8. EXTUBATION - DEEP vs. AWAKE
Q: When do you extubate - deep or awake?
Awake extubation (more common, safer overall):
- Patient regains protective airway reflexes
- Reduces risk of airway obstruction post-extubation
- Risk: coughing/bucking on tube may trigger bleeding from surgical site
Deep extubation:
- Smoother emergence, less coughing/straining
- Reduces bleeding risk from Valsalva-like maneuvers
- Risk: airway obstruction - must be managed in high-dependency environment
- Only appropriate if very experienced team and environment capable of rapid detection/management of obstruction
Adjuncts for smooth emergence (awake route):
- Lignocaine (lidocaine) 1.5 mg/kg IV or topical down ETT (cuff deflated)
- Light remifentanil infusion during emergence
- Suction oropharynx thoroughly + remove throat pack before extubation
- Pass orogastric tube to decompress stomach (swallowed blood/secretions) (Miller 10e, p.9812)
9. COMPLICATIONS
A. Post-Tonsillectomy Haemorrhage (PTH) - MOST FEARED COMPLICATION
Q: How do you manage a child with post-tonsillectomy haemorrhage?
Primary (within 6 hours): often from inadequate surgical haemostasis
Secondary (days 5-10): usually infective sloughing of eschar
Anaesthetic management - key principles:
- Volume resuscitate first - IV access, fluids, blood if needed; hypovolemia reduces induction drug requirement - consider etomidate
- Treat as full stomach - significant swallowed blood in stomach
- Rapid sequence induction (RSI) with cricoid pressure - mandatory
- Prepare for difficult airway - bleeding + swelling + anxious child = previously easy laryngoscopy can quickly become impossible
- Have multiple laryngoscope sizes/blades available
- Videolaryngoscope on standby
- Have smaller ETT sizes ready
- Vigorous suction needed during laryngoscopy
- Surgeon must be present and scrubbed before induction
(Miller 10e, p.9812; Barash 9e, Key Point 4)
B. Laryngospasm
- Most common airway complication in pediatric anesthesia
- Risk factors: light anesthesia, secretions/blood, recent URTI
- Treatment: CPAP, jaw thrust, deepen anesthesia (propofol 0.5-1 mg/kg), suxamethonium 1-2 mg/kg IV (or 4 mg/kg IM) if complete
C. Negative Pressure Pulmonary Edema (NPPE)
- Occurs after sudden relief of chronic upper airway obstruction
- Mechanism: high negative intrapleural pressures (-30 cmH2O in obstruction vs. -10 cmH2O normally) increase venous return and disrupt pulmonary microvasculature
- Frothy pink fluid in ETT, SpO2 drop, bilateral interstitial infiltrates on CXR
- Prevention: apply moderate CPAP during induction to allow circulatory adaptation
- Treatment: supportive - oxygen, CPAP/PEEP, diuretics; usually resolves within 24 hours (Barash 9e, p.4094-4095)
D. Post-operative Nausea & Vomiting (PONV)
- Very common - multimodal prophylaxis essential
- Dexamethasone + ondansetron + TIVA where possible
E. Airway Obstruction Post-extubation
- Especially with residual tonsillar tissue, edema, or in OSA children
- Lateral "tonsil position" (lateral decubitus) for recovery
10. OSA - POSTOPERATIVE DISPOSITION
Q: Who needs overnight admission after adenotonsillectomy?
Admit to hospital (Barash Table 48-1) if ANY of:
- Age <3 years
- Severe OSA (AHI >10, SpO2 nadir <80%)
- Cor pulmonale / cardiac abnormality
- Failure to thrive / poor oral intake
- Craniofacial abnormality
- Neuromuscular disorder
- Obesity (BMI >95th percentile)
- Sickle cell disease
- Post-op SpO2 <80% in recovery
- Bleeding concerns
- Lives far from hospital / no reliable carer
Day-surgery discharge criteria: no active bleeding, PONV controlled, adequate analgesia, adequate oral intake of fluids, SpO2 acceptable on room air for >1 hour, appropriate carer/distance.
11. PHARMACOLOGY REMINDERS (VIVA SPECIFICS)
| Drug | Dose | Notes |
|---|---|---|
| Sevoflurane MAC | ~2.5% (infant) | Higher than adult (2.0%) |
| Propofol induction | 3-4 mg/kg | Reduce in OSA/hypovolemia |
| Fentanyl | 1-2 mcg/kg | Reduce 50% in OSA |
| Dexamethasone | 0.15-0.5 mg/kg (max 8mg) | Avoid if lymphoma suspected |
| Ondansetron | 0.1 mg/kg (max 4mg) | PONV prophylaxis |
| Glycopyrrolate | 10 mcg/kg | Anti-sialagogue, attenuates bradycardia |
| Suxamethonium (laryngospasm) | 1-2 mg/kg IV; 4 mg/kg IM | Beware bradycardia in children |
| Lignocaine (smooth emergence) | 1.5 mg/kg IV | Or topical via deflated cuff |
12. SURGICAL SETUP - VIVA POINTS
- Position: supine, head ring, neck extended (shoulder roll)
- Mouth gag: Boyle-Davis gag - risk of ETT/LMA displacement, kinking; ALWAYS recheck after placement
- Throat pack: surgeon places; anaesthetist must document and ensure removal before extubation ("count" system)
- Shared airway: requires constant communication between surgeon and anaesthetist
SUMMARY ALGORITHM FOR THE CASE
Pre-op: Screen for OSA severity → Echo/ECG if cor pulmonale → Check coags → Postpone if active URTI/fever
Induction: Inhaled sevoflurane → IV access → glycopyrrolate → RSI if full stomach/PTH
Airway: Oral RAE ETT (midline taped) or flexible LMA
Maintenance: Volatile or TIVA + reduced-dose opioids (OSA) + dexamethasone + paracetamol + NSAID
Intraop: Check ETT after gag placement; monitor EtCO2, SpO2, temp
End of case: Remove throat pack + suction oropharynx + OGT to empty stomach
Extubation: Awake preferred; deep only if skilled team; lateral recovery position
Post-op: Multimodal analgesia; PONV prophylaxis; admit if OSA criteria met
Complication readiness: PTH → RSI protocol; Laryngospasm → sux protocol; NPPE → CPAP/PEEP
References:
- Miller's Anesthesia 10e, Ch. 27 & 29 - Tonsillectomy and Adenoidectomy
- Morgan & Mikhail's Clinical Anesthesiology 7e, Ch. 54 - Pediatric Anesthesia
- Barash/Stoelting's Clinical Anesthesia 9e, Ch. 48 - Anesthesia for Pediatric ENT Surgery
With anesthesia, age, weight of patient, height of patient, circuits. Drugs, cannulae, mabl , ebv to be used
The user wants a practical, weight/age-based calculation guide for pediatric adenotonsillectomy anesthesia. Let me get the textbook content on circuits, blood volume, MABL, drug dosing, and cannulae sizes.
Searching sources...
Finding Sources
Finding Sources
Finding Sources
Reading File
Finding Sources
Finding Sources
Finding Sources
Finding Sources
Finding Sources
Reading File
I have all the textbook data I need. Now let me compile the complete practical guide with worked examples across different age/weight groups.
Pediatric Adenotonsillectomy: Complete Practical Anesthesia Reference
All calculations shown for three representative age groups for viva readiness
STEP 1 - WEIGHT ESTIMATION (If actual weight unknown)
| Age | Formula | Example |
|---|---|---|
| 1-5 years | (Age × 2) + 8 | 4 yr = 16 kg |
| 6-12 years | (Age × 3) + 7 | 8 yr = 31 kg |
| Older (APLS) | Age × 3 | 10 yr = 30 kg |
Most adenotonsillectomies are done in 3-10 year olds (peak 4-8 years). Use three worked examples: 4 yr/16 kg, 6 yr/22 kg, 10 yr/32 kg.
STEP 2 - HEIGHT & BSA (Quick Reference)
| Age | Approx Height | BSA (Mosteller) |
|---|---|---|
| 4 yr | ~102 cm | ~0.67 m² |
| 6 yr | ~116 cm | ~0.82 m² |
| 10 yr | ~138 cm | ~1.10 m² |
BSA formula (Mosteller): √(Ht cm × Wt kg / 3600)
STEP 3 - BREATHING CIRCUITS
This is a classic viva topic. Choice is based purely on weight (< or >20 kg rule):
< 20 kg → Mapleson F (Jackson-Rees modification of Ayres T-piece)
- Why: Low resistance, no valves, suitable for small tidal volumes, allows IPPV and spontaneous breathing
- Fresh Gas Flow (FGF) for spontaneous breathing: 2-3 × Minute Volume (or ~200-300 mL/kg/min)
- FGF for IPPV: 1000 mL + 100 mL/kg/min
- Minute volume in child = 100-150 mL/kg/min (TV 8-10 mL/kg × RR 20-30)
Example - 4 yr/16 kg child:
- Tidal Volume = 8 mL/kg = 128 mL
- Respiratory rate = 22/min
- Minute volume = ~2.8 L/min
- FGF (spontaneous) = 3 × 2.8 = ~8-9 L/min
- FGF (IPPV) = 1000 + (100×16) = 2600 mL/min = 2.6 L/min minimum
> 20 kg → Circle System (Paediatric/Adult Circle Absorber)
- CO2 absorber (soda lime) used; lower FGF acceptable (1-2 L/min)
- Can use adult circle with smaller tidal volumes
Summary Rule:
| Weight | Circuit | FGF |
|---|---|---|
| <5 kg | Mapleson F (T-piece) | 3× MV |
| 5-20 kg | Mapleson F / Jackson-Rees | 2-3× MV |
| >20 kg | Circle absorber | 1-2 L/min |
(Barash Clinical Anesthesia 9e; Miller's Anesthesia 10e)
STEP 4 - AIRWAY EQUIPMENT (Age/Weight Based)
Endotracheal Tube Size
| Formula | 4 yr | 6 yr | 10 yr | |
|---|---|---|---|---|
| Uncuffed ETT (ID mm) | (Age/4) + 4 | 5.0 | 5.5 | 6.5 |
| Cuffed ETT (ID mm) | (Age/4) + 3.5 | 4.5 | 5.0 | 6.0 |
For adenotonsillectomy: Oral RAE tube preferred (preformed, keeps tube out of surgical field). Order size of RAE = same formula. Always have 0.5 mm smaller available.
Cuffed vs Uncuffed:
- Cuffed ETT is now standard and safe in children >1 year (Microcuff low-pressure cuff)
- Confirms cuff pressure <20 cmH2O
- Advantage for adenotonsillectomy: protects against blood/secretion aspiration from surgical field
ETT Depth (Oral)
- (Age/2) + 12 cm at lips
- Confirm with bilateral auscultation + CXR if uncertain
Laryngoscope Blade
| Age | Blade |
|---|---|
| <1 yr | Straight (Miller 0 or 1) |
| 1-8 yr | Straight (Miller 1) or Curved (Macintosh 2) |
| >8 yr | Macintosh 2-3 |
LMA Size (if used)
| Weight | LMA Size | Max Cuff Volume |
|---|---|---|
| 5-10 kg | 1.5 | 7 mL |
| 10-20 kg | 2 | 10 mL |
| 20-30 kg | 2.5 | 14 mL |
| 30-50 kg | 3 | 20 mL |
STEP 5 - IV CANNULA SIZE
| Weight/Age | IV Cannula | Gauge | Notes |
|---|---|---|---|
| <10 kg | 24G (yellow) | 24G | Dorsum of hand, wrist |
| 10-20 kg | 22G (blue) | 22G | Most 4-6 yr olds |
| 20-40 kg | 20G (pink) | 20G | Standard for >20 kg |
| >40 kg | 18G (green) | 18G | As adult |
Rule of thumb for viva: "In children <20 kg, we use a 22G or 24G cannula; in children >20 kg, we upsize to 20G. For adenotonsillectomy, a single IV access is usually sufficient, but 2 IV lines are prudent in OSA children or anticipated difficult cases."
STEP 6 - ESTIMATED BLOOD VOLUME (EBV) & MABL
EBV by Age Group
(Barash Clinical Anesthesia 9e, p.3759)
| Age Group | EBV |
|---|---|
| Premature neonate | 95-100 mL/kg |
| Term neonate (0-1 month) | 85-90 mL/kg |
| Infant (1-12 months) | 75-80 mL/kg |
| Child (1-12 years) | 70-75 mL/kg |
| Adult male | 70 mL/kg |
| Adult female | 65 mL/kg |
MABL Formula
(Barash 9e, p.3759)
MABL = EBV × (Starting Hct - Target Hct) / Starting Hct
- Target Hct for healthy children = 20-25% (i.e., Hb ~7-8 g/dL)
- Use 25% as target for OSA children (higher O2 carrying capacity needed)
Worked Examples:
Example 1: 4-year-old, 16 kg, Hct 36%, Target Hct 25%
- EBV = 70 × 16 = 1120 mL
- MABL = 1120 × (36-25)/36 = 1120 × 0.306 = ~342 mL
Example 2: 6-year-old, 22 kg, Hct 38%, Target Hct 25%
- EBV = 70 × 22 = 1540 mL
- MABL = 1540 × (38-25)/38 = 1540 × 0.342 = ~527 mL
Example 3: 10-year-old, 32 kg, Hct 38%, Target Hct 25%
- EBV = 70 × 32 = 2240 mL
- MABL = 2240 × (38-25)/38 = 2240 × 0.342 = ~766 mL
For adenotonsillectomy: blood loss is usually 50-100 mL, well within MABL. MABL becomes critical in post-tonsillectomy haemorrhage (PTH) where significant concealed loss (swallowed blood) has already occurred before the child reaches theatre.
STEP 7 - FLUID MANAGEMENT (4-2-1 Rule)
Maintenance Fluids (Holliday-Segar / 4-2-1 Rule)
| Body Weight | Rate |
|---|---|
| First 10 kg | 4 mL/kg/hr |
| Next 10 kg | 2 mL/kg/hr |
| Every kg after 20 kg | 1 mL/kg/hr |
Worked Examples:
- 16 kg child: (4×10) + (2×6) = 40 + 12 = 52 mL/hr
- 22 kg child: (4×10) + (2×10) + (1×2) = 40 + 20 + 2 = 62 mL/hr
- 32 kg child: (4×10) + (2×10) + (1×12) = 40 + 20 + 12 = 72 mL/hr
Fluid deficit (from NPO period)
Deficit = Maintenance rate × hours of fasting Give 50% in first hour, then 25%/25% over next 2 hours
Fluid choice:
- Isotonic balanced crystalloid (Hartmann's / Lactated Ringer's) = standard
- Normal saline AVOIDED as first choice (hyperchloremic acidosis risk)
- Dextrose-containing fluids only in neonates/infants at risk of hypoglycemia
STEP 8 - DRUG DOSES (Complete Viva Chart)
A. INDUCTION AGENTS
| Drug | Dose | Route | 16 kg | 22 kg | 32 kg |
|---|---|---|---|---|---|
| Propofol | 3-4 mg/kg | IV | 48-64 mg | 66-88 mg | 96-128 mg |
| Thiopentone | 5-7 mg/kg | IV | 80-112 mg | 110-154 mg | 160-224 mg |
| Ketamine | 1-2 mg/kg | IV | 16-32 mg | 22-44 mg | 32-64 mg |
| Sevoflurane | 6-8% induction | Inhalational | - | - | - |
B. MUSCLE RELAXANTS
| Drug | Dose | Route | 16 kg | 22 kg | 32 kg |
|---|---|---|---|---|---|
| Suxamethonium (intubation/RSI) | 1.5-2 mg/kg | IV | 24-32 mg | 33-44 mg | 48-64 mg |
| Suxamethonium (laryngospasm) | 4 mg/kg | IM | 64 mg | 88 mg | 128 mg |
| Atracurium | 0.5 mg/kg | IV | 8 mg | 11 mg | 16 mg |
| Rocuronium | 0.6 mg/kg | IV | 9.6 mg | 13.2 mg | 19.2 mg |
| Vecuronium | 0.1 mg/kg | IV | 1.6 mg | 2.2 mg | 3.2 mg |
Note: Adenotonsillectomy does not routinely require muscle relaxants - most cases done with spontaneous breathing or IPPV using volatile ± remifentanil.
C. ANALGESICS
| Drug | Dose | Route | 16 kg | 22 kg | 32 kg |
|---|---|---|---|---|---|
| Fentanyl | 1-2 mcg/kg | IV | 16-32 mcg | 22-44 mcg | 32-64 mcg |
| Fentanyl (OSA child) | 0.5-1 mcg/kg (50% reduction) | IV | 8-16 mcg | 11-22 mcg | 16-32 mcg |
| Morphine | 0.05-0.1 mg/kg | IV | 0.8-1.6 mg | 1.1-2.2 mg | 1.6-3.2 mg |
| Paracetamol IV | 15 mg/kg (max 1g) | IV | 240 mg | 330 mg | 480 mg |
| Paracetamol rectal | 20 mg/kg | PR | 320 mg | 440 mg | 640 mg |
| Ibuprofen | 5-10 mg/kg | IV/PO | 80-160 mg | 110-220 mg | 160-320 mg |
| Ketorolac | 0.5 mg/kg (max 15 mg) | IV | 8 mg | 11 mg | 15 mg |
D. ANTIEMETICS
| Drug | Dose | Route | 16 kg | 22 kg | 32 kg |
|---|---|---|---|---|---|
| Ondansetron | 0.1 mg/kg (max 4 mg) | IV | 1.6 mg | 2.2 mg | 3.2 mg |
| Dexamethasone | 0.15-0.5 mg/kg (max 8 mg) | IV | 2.4-8 mg | 3.3-8 mg | 4.8-8 mg |
E. ANTICHOLINERGICS / ANTISIALAGOGUES
| Drug | Dose | Route | 16 kg | 22 kg | 32 kg |
|---|---|---|---|---|---|
| Atropine (bradycardia) | 0.02 mg/kg (min 0.1 mg, max 0.6 mg) | IV | 0.32 mg | 0.44 mg | 0.6 mg |
| Glycopyrrolate | 0.005-0.01 mg/kg | IV | 0.08-0.16 mg | 0.11-0.22 mg | 0.16-0.32 mg |
F. EMERGENCY DRUGS
| Drug | Dose | Indication | 16 kg | 22 kg | 32 kg |
|---|---|---|---|---|---|
| Adrenaline (cardiac arrest) | 0.01 mg/kg (1:10,000) | PEA/VF/asystole | 0.16 mg = 1.6 mL of 1:10,000 | 0.22 mg | 0.32 mg |
| Adrenaline (anaphylaxis) | 0.01 mg/kg IM (1:1000) | Anaphylaxis | 0.16 mL of 1:1000 | 0.22 mL | 0.32 mL |
| Suxamethonium (laryngospasm IM) | 4 mg/kg IM | Laryngospasm | 64 mg | 88 mg | 128 mg |
| Propofol (laryngospasm) | 0.5-1 mg/kg | Partial laryngospasm | 8-16 mg | 11-22 mg | 16-32 mg |
| Glucose 10% | 2-5 mL/kg | Hypoglycemia | 32-80 mL | 44-110 mL | 64-160 mL |
G. MAINTENANCE INFUSIONS
| Drug | Infusion Rate | Notes |
|---|---|---|
| Propofol TIVA | 6-12 mg/kg/hr induction → 3-6 mg/kg/hr maintenance | Good for PONV reduction |
| Remifentanil | 0.05-0.2 mcg/kg/min | Smooth emergence; titrate to response |
| Dexmedetomidine | 0.2-0.5 mcg/kg/hr | Opioid-sparing; useful in OSA |
STEP 9 - COMPLETE WORKED EXAMPLE (Viva Model Answer)
"6-year-old girl, 22 kg, 116 cm, presenting for adenotonsillectomy for OSA"
| Parameter | Calculation | Value |
|---|---|---|
| Weight | 6 yr: (6×3)+7 | 25 kg (actual: 22 kg - use actual) |
| Height | Estimated | 116 cm |
| BSA | √(116×22/3600) | 0.84 m² |
| Circuit | <20 kg | Jackson-Rees (Mapleson F) |
| FGF (IPPV) | 1000+(100×22) | 3.2 L/min |
| ETT (cuffed oral RAE) | (6/4)+3.5 | 5.0 mm ID |
| ETT depth | (6/2)+12 | 15 cm at lips |
| IV cannula | 10-20 kg | 22G |
| EBV | 70 mL/kg | 1540 mL |
| MABL (Hct 38% → 25%) | 1540×(13/38) | ~527 mL |
| Maintenance fluids | 4-2-1 | 62 mL/hr |
| Propofol induction | 3 mg/kg (OSA: reduce) | ~55-66 mg |
| Fentanyl (OSA - 50% reduction) | 1 mcg/kg | 22 mcg |
| Paracetamol IV | 15 mg/kg | 330 mg |
| Dexamethasone | 0.3 mg/kg | 6.6 mg |
| Ondansetron | 0.1 mg/kg | 2.2 mg |
| Atropine (if bradycardia) | 0.02 mg/kg | 0.44 mg |
| Suxamethonium (laryngospasm IM) | 4 mg/kg | 88 mg |
| Adrenaline (arrest) | 0.01 mg/kg | 0.22 mg |
STEP 10 - MONITORING SETUP
| Monitor | Comment |
|---|---|
| SpO2 | Pre-induction (pre-ductal in neonates) |
| ECG | Standard 3-lead |
| NIBP | Appropriate cuff = 2/3 width of upper arm; >1/2 to <2/3 arm length |
| EtCO2 (capnography) | Mandatory; assess ventilation |
| Temperature | Axillary/rectal/oesophageal - prevent hypothermia |
| Precordial stethoscope | Useful in <10 kg |
| Peripheral nerve stimulator | If NMB used |
NIBP Cuff Sizes:
| Weight | Cuff |
|---|---|
| Neonate | Neonatal (4 cm) |
| Infant | Infant (6 cm) |
| Child 1-5 yr | Child (9 cm) |
| Child 6-12 yr | Child large (12 cm) |
QUICK-RECALL CARD (Exam Summary)
WEIGHT:  (Age×2)+8 for <5 yr; (Age×3)+7 for 6-12 yr
CIRCUIT: <20 kg → Jackson-Rees (Mapleson F); >20 kg → Circle
ETT:     Uncuffed = (Age/4)+4; Cuffed = (Age/4)+3.5
DEPTH:   (Age/2)+12 cm at lips
LMA:     <10 kg=1.5; 10-20 kg=2; 20-30 kg=2.5; 30-50 kg=3
CANNULA: <10 kg=24G; 10-20 kg=22G; >20 kg=20G
EBV:     Neonate=90 mL/kg; Infant=80 mL/kg; Child=70-75 mL/kg
MABL:    EBV × (start Hct - target Hct) / start Hct
FLUIDS:  4 mL/kg for 1st 10 kg + 2 for 2nd 10 kg + 1 beyond
FENTANYL: 1-2 mcg/kg (HALVE in OSA)
SUXAMETHONIUM: 1.5-2 mg/kg IV; 4 mg/kg IM (laryngospasm)
DEXAMETHASONE: 0.15-0.5 mg/kg (AVOID if lymphoma suspected)
ATROPINE: 0.02 mg/kg (min 0.1 mg)
Sources: Barash/Stoelting Clinical Anesthesia 9e (p.3759); Miller's Anesthesia 10e; Morgan & Mikhail Clinical Anesthesiology 7e
Everything about pulse oximetry and capnography
Finding Sources
Finding Sources
Finding Sources
Reading File
Reading File
Finding Sources
Finding Sources
Reading File
Finding Sources
Finding Sources
Reading File
Reading File
Finding Sources
Finding Sources
Reading File
I now have comprehensive content from Miller's Anesthesia 10e and the textbook library. Let me compile the complete viva guide.
Pulse Oximetry & Capnography: Complete Viva Reference
Sources: Miller's Anesthesia 10e, Barash/Stoelting Clinical Anesthesia 9e, Morgan & Mikhail 7e
PART A: PULSE OXIMETRY
1. DEFINITION & PRINCIPLE
Q: What is pulse oximetry?
Pulse oximetry is a continuous, non-invasive measurement of the functional arterial oxygen saturation (SpO2) of hemoglobin, using the differential light absorption of oxygenated (O2Hb) and deoxygenated (deO2Hb) hemoglobin.
- The value measured is called SpO2 (from pulse oximetry) to distinguish from SaO2 (directly measured arterial blood gas)
- Accuracy: SpO2 is within ±2-3% of SaO2 over the range of 70-100% (Miller's Anesthesia 10e, p.5456)
2. PHYSICS & HOW IT WORKS
Q: Explain the Beer-Lambert Law as applied to pulse oximetry
Beer-Lambert Law: The intensity of light transmitted through a substance decreases exponentially with the concentration of the absorbing substance and the path length.
Two wavelengths used:
| Wavelength | Absorbed more by | Colour |
|---|---|---|
| 660 nm (red) | Deoxygenated Hb (deO2Hb) | Red light |
| 940 nm (infrared) | Oxygenated Hb (O2Hb) | Infrared light |
Why these two wavelengths? At 660 nm, deO2Hb absorbs ~10× more than O2Hb. At 940 nm, O2Hb absorbs more than deO2Hb. The difference is maximised - this gives the best discrimination between the two species.
AC/DC Separation - the key innovation:
Light absorption by tissue is divided into:
- DC component (non-pulsatile, "direct current"): Venous blood, capillary blood, tissue, bone, pigment - all constant
- AC component (pulsatile, "alternating current"): Arterial blood only - changes with each heartbeat
The ratio R is calculated:
R = (AC660/DC660) / (AC940/DC940)
This ratio R is then looked up on an empirically derived calibration curve (built by having volunteers breathe hypoxic mixtures across SpO2 70-100%) to yield SpO2.
(Miller's Anesthesia 10e, p.5456-5457)
Physical construction:
- Two LEDs (660 nm + 940 nm) that flash sequentially
- One photodetector on opposite side (transmission) or same side (reflectance)
- When both LEDs off: ambient light subtracted from signal automatically
3. FIVE SPECIES OF HAEMOGLOBIN (Critical Viva Point)
Q: Why is standard pulse oximetry a two-wavelength device a limitation?
Standard pulse oximetry measures functional saturation - only O2Hb and deO2Hb:
Functional SaO2 = O2Hb / (O2Hb + deO2Hb) × 100
But there are 5 species of Hb in blood:
| Species | Normal % | Notes |
|---|---|---|
| O2Hb (oxyhaemoglobin) | ~97% | Absorbs 940 nm more |
| deO2Hb (deoxyhaemoglobin) | ~2% | Absorbs 660 nm more |
| COHb (carboxyhaemoglobin) | <1% (smoker: up to 10%) | Absorbs 660 nm same as O2Hb → falsely HIGH SpO2 |
| MetHb (methaemoglobin) | <1% | Absorbs equally at both wavelengths → SpO2 drifts toward 85% regardless of true SaO2 |
| SHb (sulphaemoglobin) | <1% | Rare, causes SpO2 to read low |
Pulse co-oximetry (e.g., Masimo Rad-7) uses 8 wavelengths and can measure COHb and MetHb directly.
(Miller's Anesthesia 10e, p.5449-5462)
4. THE OXYHEMOGLOBIN DISSOCIATION CURVE (OHC)
Q: What is the clinical significance of the shape of the OHC for pulse oximetry?
The OHC is sigmoid (S-shaped):
SpO2 (%)
100 |----___
 98 |       \
 90 |        \   ← STEEP PART: small ΔPO2 = big ΔSpO2
 75 |         \
 50 |          |  P50 = 27 mmHg
    |__________|___
              PaO2 (mmHg)
Clinical implications:
- Flat upper portion (PaO2 >70 mmHg): SpO2 cannot detect hyperoxia - dangerous in premature neonates (retinopathy of prematurity risk)
- Steep lower portion: Once SpO2 starts falling rapidly, PaO2 is already critically low - pulse oximetry gives late warning
- SpO2 of 90% corresponds to PaO2 ~60 mmHg (onset of respiratory failure)
- SpO2 of 75% corresponds to PaO2 ~40 mmHg (mixed venous level)
Shifts of the curve:
| Shift LEFT (↑ affinity, ↓ O2 release) | Shift RIGHT (↓ affinity, ↑ O2 release) |
|---|---|
| ↓ Temperature | ↑ Temperature |
| ↓ CO2 / alkalosis | ↑ CO2 / acidosis |
| ↓ 2,3-DPG | ↑ 2,3-DPG |
| Fetal Hb (HbF) | Sickle cell disease |
| COHb, MetHb | Exercise, anaemia |
5. PHOTOPLETHYSMOGRAPHY - BONUS VIVA POINT
The pulse oximeter trace is also a photoplethysmograph (PPG):
- Shows arterial blood volume changes with each heartbeat
- Respiratory variation in PPG amplitude (ΔPOP / PVI) predicts fluid responsiveness in mechanically ventilated patients
- PVI (Pleth Variability Index) - commercially available on Masimo devices
- More reliable in mechanically ventilated than spontaneously breathing patients (Miller's Anesthesia 10e, p.5461)
6. PROBE SITES
| Site | Notes |
|---|---|
| Finger (standard) | Most common; affected by vasoconstriction, nail polish |
| Ear lobe | Faster response time (~6 sec); good during vasoconstriction |
| Forehead (reflectance) | Best during hypotension/vasoconstriction/hypothermia - least responsive to catecholamines |
| Nose | Alternative site |
| Toe/foot | Post-ductal in neonates (different from right hand pre-ductal) |
| Palm/wrist | Neonates |
In vasopressor-dependent patients: use ear or forehead probe - less vasoconstriction at these sites compared to fingers (Miller's Anesthesia 10e, p.5469-5470)
7. LIMITATIONS & SOURCES OF ERROR
This is the most popular viva topic:
A. Causes of FALSELY HIGH SpO2 (reads higher than true SaO2)
| Cause | Mechanism |
|---|---|
| Carbon monoxide poisoning (COHb) | COHb absorbs 660 nm same as O2Hb; SpO2 reads near 100% even in severe CO poisoning |
| Methaemoglobinaemia (early) | MetHb initially drives SpO2 up before plateau |
B. Causes of FALSELY LOW SpO2 (reads lower than true SaO2)
| Cause | Mechanism |
|---|---|
| Methaemoglobinaemia (established) | Regardless of true SaO2, SpO2 drifts toward 85% |
| Dyes (methylene blue, indocyanine green, indigo carmine) | Absorb at 660 nm - cause transient drop in SpO2 |
| Nail polish (blue/black/green) | Absorbs 660 nm; dark colours more problematic |
| Severe jaundice (bilirubin >20 mg/dL) | Absorbs at 460 nm - minimal clinical effect in adults |
C. Causes of INACCURATE or NO READING
| Cause | Mechanism |
|---|---|
| Vasoconstriction / poor perfusion | Reduced pulsatile component (AC signal too small) |
| Hypothermia | Peripheral vasoconstriction |
| Hypotension / shock | Weak peripheral pulse |
| Movement artefact | Most common cause of false alarms; next-generation signal processing (e.g., Masimo SETS) mitigates this |
| Ambient light interference | Bright theatre lights; resolved by shielding probe |
| Venous pulsation | Tricuspid regurgitation, high venous pressure → venous "pulsation" misread as arterial |
| Anaemia (severe) | At very low Hb, insufficient absorbing molecules; generally accurate unless Hb <5 g/dL |
| Melanin (dark skin) | May cause slight overestimation of SpO2 - subject of recent concern and regulatory review |
KEY VIVA POINT - Racial bias: Studies (including Sjoding et al., NEJM 2020) showed pulse oximeters overestimate SpO2 in patients with dark skin by ~3.5%, potentially masking hypoxemia. This is an active area of regulatory review by FDA.
D. Calibration limit
- Calibration curves only validated down to SpO2 70% - accuracy below 70% is unknown
8. CLINICAL APPLICATIONS
- Intraoperative monitoring (mandatory standard ASA/AAGBI)
- Sedation monitoring (procedural sedation, endoscopy, ICU)
- PACU / ward monitoring
- Transport monitoring
- Newborn screening for critical congenital heart disease (detects pre-ductal vs post-ductal difference)
- Pulse oximetry during COVID-19: enabled remote monitoring
- Fluid responsiveness assessment (via PPG waveform variation)
PART B: CAPNOGRAPHY
1. DEFINITIONS
| Term | Definition |
|---|---|
| Capnometry | Numerical measurement of CO2 concentration in a gas sample |
| Capnography | Continuous graphical display of CO2 concentration over time (waveform = capnogram) |
| End-tidal CO2 (EtCO2 / PETCO2) | CO2 concentration at the end of tidal exhalation (approximates alveolar CO2) |
| Volumetric capnography | CO2 plotted against exhaled volume (rather than time) |
Normal EtCO2 = 35-45 mmHg (or 4.7-6.0 kPa)
2. PHYSICAL PRINCIPLE
Infrared (IR) spectroscopy:
- CO2 absorbs infrared radiation at 4.28 μm wavelength
- The amount of IR absorbed is proportional to CO2 concentration (Beer-Lambert Law)
- A light source emits IR; the detector measures transmission; CO2 concentration calculated from absorption
Two system types:
| Type | Description | Pros/Cons |
|---|---|---|
| Sidestream (aspirating) | Gas sample drawn from circuit via fine tubing to analyser outside the airway | Pro: lightweight probe, works with LMA/mask; Con: 5-10 sec delay, sampling tube can block with water/secretions |
| Mainstream (non-aspirating) | Sensor sits directly in the breathing circuit | Pro: no delay, no sampling tube blockage; Con: heavy sensor on circuit, adds dead space, sensor can get hot |
(Miller's Anesthesia 10e, p.11316)
3. THE CAPNOGRAM WAVEFORM - FOUR PHASES
This is the most tested viva topic on capnography:
CO2
(mmHg)
45  |        __________D
    |       /          \
    |      /C           \
    |     /              \
  0 |____/A   B           \E___
    |←expiration→|←inspiration→|
      I  II  III              IV
| Phase | Name | What it represents |
|---|---|---|
| Phase I (A-B) | Inspiratory baseline | Dead space gas - no CO2; should be at zero |
| Phase II (B-C) | Expiratory upstroke | Mixture of dead space + alveolar gas; rapid CO2 rise |
| Phase III (C-D) | Alveolar plateau | Mostly alveolar gas; slight upslope due to ongoing CO2 diffusion from different lung units |
| Point D | End-tidal CO2 | The peak CO2 at end of exhalation = EtCO2 |
| Phase IV (D-E) | Inspiratory downstroke | Fresh gas displaces CO2; rapid return to zero |
Normal angle (alpha angle): Junction of Phase II and Phase III; normally ~100°. Widened in obstructive disease.
Beta angle: Junction of Phase III and Phase IV (downstroke); normally ~90°. Increased in rebreathing.
4. PaCO2 - EtCO2 GRADIENT
Q: What is the normal PaCO2 - EtCO2 gradient? What does it mean?
- Normal gradient = 2-5 mmHg (PaCO2 slightly higher than EtCO2)
- EtCO2 is always ≤ PaCO2 in healthy lungs
- Why? Because EtCO2 represents a mixture of gas from different alveoli including those with V/Q mismatch and dead space
The gradient INCREASES when dead space increases:
- Pulmonary embolism (major cause - reduced perfusion, high V/Q)
- Pulmonary hypotension
- Overdistended alveoli (high PEEP)
- Low cardiac output
- Haemorrhage / hypovolaemia
Alveolar Dead Space Fraction:
AVDSf = (PaCO2 - EtCO2) / PaCO2
(Miller's Anesthesia 10e, p.11316)
5. CAUSES OF CHANGES IN EtCO2 - COMPLETE TABLE
A. INCREASED EtCO2
| Cause | Mechanism |
|---|---|
| Hypoventilation | ↓ minute volume → CO2 accumulates |
| Rebreathing | Exhausted soda lime, incompetent inspiratory valve |
| Malignant hyperthermia | Massive ↑ CO2 production - often first/most sensitive sign |
| Fever / sepsis / shivering | ↑ metabolic rate → ↑ CO2 production |
| Tourniquet release | Sudden flush of accumulated CO2 |
| NaHCO3 administration | CO2 released from buffering |
| Thyrotoxicosis | ↑ metabolic rate |
| Laparoscopy (CO2 insufflation) | Absorption of CO2 from peritoneum |
| Light anaesthesia (pain/response) | ↑ sympathetic activity, ↑ metabolism |
B. DECREASED EtCO2
| Cause | Mechanism |
|---|---|
| Hyperventilation | ↑ CO2 elimination |
| Pulmonary embolism | ↑ dead space → less alveolar CO2 |
| Cardiac arrest / circulatory collapse | No pulmonary perfusion → near-zero EtCO2 |
| Hypothermia | ↓ metabolic rate, ↓ CO2 production |
| Severe haemorrhage / hypovolaemia | ↓ pulmonary perfusion |
| Air embolism | ↑ dead space |
| Pulmonary hypoperfusion (any cause) | ↑ V/Q mismatch |
C. ABSENT EtCO2
| Cause | Mechanism |
|---|---|
| Oesophageal intubation | Most critical - no CO2 from stomach (though transient CO2 from carbonated drinks) |
| Complete circuit disconnect | No gas sampling |
| Complete circuit obstruction | No gas flow |
| Cardiac arrest | No pulmonary blood flow |
| Blocked sidestream sampling tube | Water/secretions |
6. ABNORMAL WAVEFORM PATTERNS - VIVA FAVOURITES
Pattern 1: Slanted / shark-fin upstroke (Phase II-III slope increased)
     /\
    /  \
   /    \
  /      \___
- Obstructive airway disease (asthma, COPD, bronchospasm)
- Different lung units empty at different rates → prolonged, sloping plateau
- Increased alpha angle
Pattern 2: Elevated baseline (Phase I not returning to zero)
     _____
    /     \
___/       \_____  ← does not return to 0
- Rebreathing of exhaled CO2
- Exhausted soda lime
- Stuck/incompetent inspiratory valve
- Insufficient fresh gas flow (esp. Mapleson circuits)
Pattern 3: Sudden drop to zero
___|||||||||_____ (suddenly flat at 0)
- Oesophageal intubation (most critical diagnosis)
- Extubation / disconnection
- Complete circuit obstruction
- Cardiac arrest
Pattern 4: Exponential decrease toward zero
     ↓↓↓
   ...becoming smaller
- Pulmonary embolism (sudden) or decreasing cardiac output
- Cardiac arrest (gradual decline)
Pattern 5: Suddenly elevated then decreasing
    ↑↑
   ...then slowly falling
- Malignant hyperthermia onset
- CO2 insufflation starting (laparoscopy)
- Tourniquet release
- NaHCO3 bolus
Pattern 6: Cardiogenic oscillations (notches on plateau)
___/^\__/^\_____
- Heart motion transmitted to lungs during cardiac surgery
- Normal variant with slow RR and strong cardiac output
Pattern 7: Cleft/notch during Phase III
- Patient taking spontaneous breath during IPPV (curare cleft)
- Indicates neuromuscular block wearing off or patient fighting ventilator
7. CLINICAL USES OF CAPNOGRAPHY
| Use | Details |
|---|---|
| Confirm ETT in trachea | Standard of care - 6 consecutive waveforms confirm tracheal placement; zero waveform = oesophageal |
| Monitor ventilation adequacy | EtCO2 guides ventilator settings |
| Detect disconnection / circuit failure | Sudden drop to zero |
| Detect malignant hyperthermia | Unexplained sudden rise in EtCO2 |
| Pulmonary embolism detection | Sudden decrease in EtCO2 with clinical deterioration |
| CPR quality assessment | EtCO2 during CPR correlates with cardiac output; EtCO2 >10 mmHg suggests adequate CPR |
| ROSC during CPR | Sudden rise in EtCO2 during CPR = return of spontaneous circulation (ROSC) |
| Assess NMB reversal | Curare cleft = spontaneous breathing returning |
| Dead space estimation | AVDSf calculation |
| Fluid responsiveness (volumetric) | Changes in Bohr dead space with PEEP titration |
| Sedation monitoring | Non-intubated patients (via nasal/oral sampling cannula) |
| Rebreathing detection | Baseline elevation |
8. EtCO2 IN SPECIAL SITUATIONS
Cardiac Arrest
- Before ROSC: EtCO2 <10 mmHg = inadequate CPR / very poor prognosis
- Sudden rise to >40 mmHg during CPR = ROSC (most reliable non-invasive sign)
- If EtCO2 persistently <10 mmHg after 20 min of good CPR = consider stopping resuscitation (prognostic marker)
Paediatric patients
- Same principles apply
- EtCO2-PaCO2 gradient may be slightly larger due to V/Q immaturity in neonates
- Sidestream capnography preferred in small children (lightweight)
- Accuracy reduces with very high respiratory rates and small tidal volumes (gas mixing in sidestream tubing)
- Time-based capnography less accurate at very high RRs (>40/min) - gaps between breaths too short to develop clear plateau
Laparoscopy
- CO2 absorbs from peritoneum → EtCO2 rises by 5-10 mmHg
- Increase minute ventilation by 10-15% at start
- Subcutaneous emphysema → very high EtCO2 even with hyperventilation
- Steep Trendelenburg → ↑ airway pressure + atelectasis → ↑ EtCO2
Malignant Hyperthermia
- EtCO2 rise is the earliest and most sensitive indicator - precedes temperature rise
- Often >80-100 mmHg despite maximal ventilation
- Treat with dantrolene + cooling + hyperventilation
9. VOLUMETRIC CAPNOGRAPHY
Plots CO2 against exhaled volume (rather than time):
- Provides direct Bohr dead space measurement
- Helpful for PEEP optimisation (titrate PEEP to minimise dead space without overdistension)
- Can demonstrate response to bronchodilator therapy
- Available on modern ICU ventilators (Miller's Anesthesia 10e, p.11317)
10. TRANSCUTANEOUS CO2 (TcCO2)
- Probe heats skin → dilates capillaries → CO2 diffuses through skin → measured by IR sensor
- Continuous non-invasive PaCO2 estimate
- Useful in high-frequency ventilation where capnography inadequate
- Requires calibration against blood gas; drift over time
- Less accurate in: low cardiac output, thick skin/obesity, cyanotic heart disease (Miller's Anesthesia 10e, p.11317)
11. COMPARISON TABLE: PULSE OXIMETRY vs CAPNOGRAPHY
| Feature | Pulse Oximetry | Capnography |
|---|---|---|
| What it measures | O2 saturation (SpO2) | CO2 concentration (EtCO2) |
| What it monitors | Oxygenation | Ventilation |
| Normal values | SpO2 >95% (>92% in COPD) | EtCO2 35-45 mmHg |
| Response time | ~6 seconds (ear fastest) | Sidestream: 5-10 sec; mainstream: near-instant |
| First sign of hypoventilation | Late (SpO2 falls only after significant O2 reserve depleted) | Early (EtCO2 rises immediately) |
| Confirms ETT placement | No | Yes (6 waveforms) |
| Detects oesophageal intubation | No (SpO2 takes time to fall) | Yes (immediate - no waveform) |
| Detects MH | No | Yes (early EtCO2 rise) |
| Detects PE | Indirect (SpO2 fall) | Yes (EtCO2 falls) |
| Detects ROSC | Indirect | Yes (sudden EtCO2 rise) |
| Circuit disconnect | No | Yes (EtCO2 → 0) |
| Main limitation | Does NOT detect ventilation failure until SpO2 falls | EtCO2 ≠ PaCO2 when dead space increased |
QUICK-RECALL VIVA CARD
PULSE OXIMETRY
- Wavelengths: 660 nm (red) + 940 nm (infrared)
- AC (pulsatile) = arterial; DC (steady) = everything else
- COHb: falsely HIGH SpO2 (660 nm same as O2Hb)
- MetHb: SpO2 drifts to 85% regardless
- Methylene blue: falsely LOW SpO2
- Vasoconstriction → no signal
- OHC flat top: cannot detect hyperoxia
- SpO2 90% ≈ PaO2 60 mmHg

CAPNOGRAPHY
- Phases: I=dead space, II=upstroke, III=plateau, IV=downstroke
- Normal EtCO2: 35-45 mmHg; gradient PaCO2-EtCO2 = 2-5 mmHg
- Gradient INCREASES with: PE, ↓ cardiac output, overdistension
- Sudden EtCO2 to ZERO: oesophageal intubation / disconnection / cardiac arrest
- Sudden EtCO2 RISE: MH / hypoventilation / laparoscopy / NaHCO3
- Sudden EtCO2 DROP: PE / haemorrhage / ↓ cardiac output
- CPR: EtCO2 >10 = adequate; sudden rise = ROSC
- Shark-fin: obstructive disease
- Elevated baseline: rebreathing (exhausted soda lime / bad valve)
Sources: Miller's Anesthesia 10e (Ch.37, p.5449-5470; Ch.31, p.11316-11317); Barash Clinical Anesthesia 9e; Morgan & Mikhail Clinical Anesthesiology 7e
Give relevant pictures
Let me fetch all the relevant textbook images on pulse oximetry and capnography in parallel.
Finding Sources
Finding Sources
Reading File
I can see several image URLs. Let me extract them all and fetch them in parallel.
Reading File
I now have all the image URLs. Let me fetch them all in parallel - I have 6 key images from Miller's on pulse oximetry plus the photoplethysmography image:
Loading Image
Loading Image
Loading Image
Loading Image
Now let me get the Hb absorption spectra image (truncated URL) and fetch the capnography-related images:
Reading File
Finding Sources
Loading Image
Reading File
Loading Image
Finding Sources
Now let me search for capnography waveform images from the textbooks:
Finding Sources
Searching Content
"capnograph" in /textbooks/9780323935920
Finding Sources
Finding Sources
Searching the Web
capnogram waveform phases normal abnormal anesthesia diagram labeled image
Loading Image
Loading Image
Loading Image
Excellent - I have all the key images. Now let me deliver the complete picture-annotated response.
Pulse Oximetry & Capnography: Relevant Images with Explanations
PULSE OXIMETRY IMAGES
1. Oxyhemoglobin Dissociation Curve (OHC)
(Miller's Anesthesia 10e, Fig. 37.2)
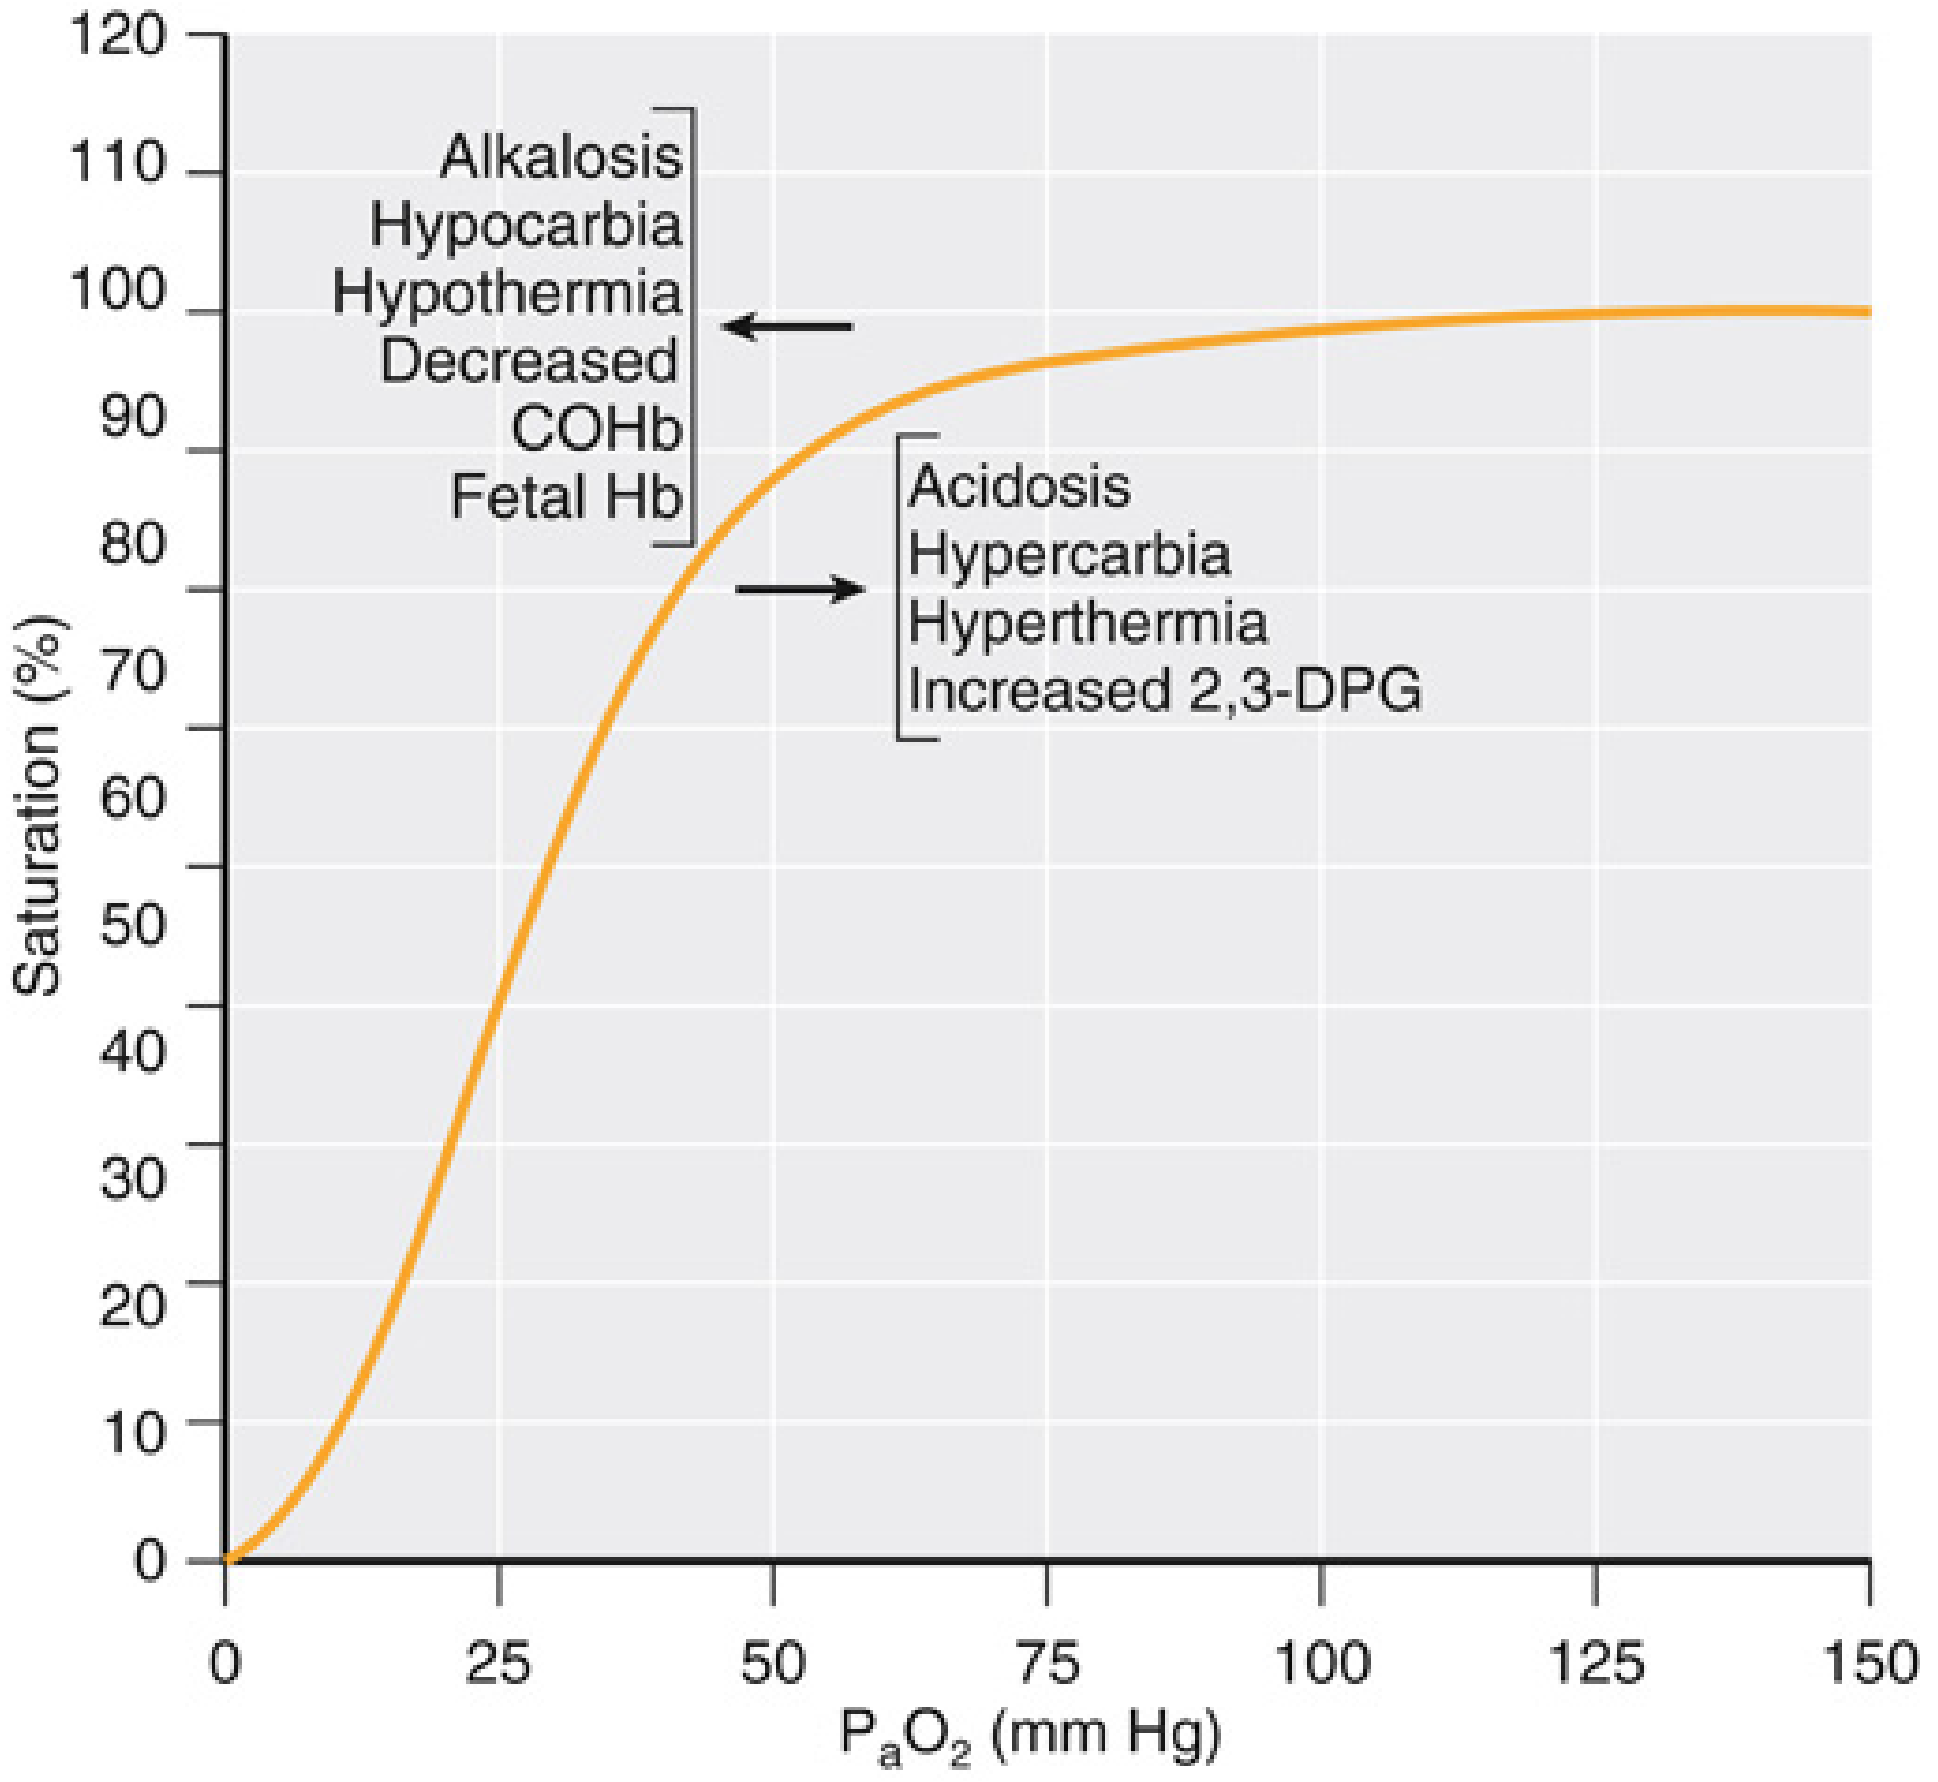
Key teaching points from this curve:
- Flat upper portion (PaO2 >70 mmHg): SpO2 cannot distinguish between normal and hyperoxic states - dangerous in neonates (retinopathy risk)
- Steep lower portion: Once SpO2 starts falling, PaO2 is already critically low - pulse oximetry gives late warning of deterioration
- SpO2 90% = PaO2 ~60 mmHg (onset of respiratory failure)
- Left shift (Alkalosis, Hypocarbia, Hypothermia, COHb, Fetal Hb): higher affinity, less O2 release to tissues
- Right shift (Acidosis, Hypercarbia, Hyperthermia, ↑2,3-DPG): lower affinity, better O2 delivery to tissues
2. Haemoglobin Absorption Spectra - The Physics of Pulse Oximetry
(Miller's Anesthesia 10e, Fig. 37.3A & 37.3B)
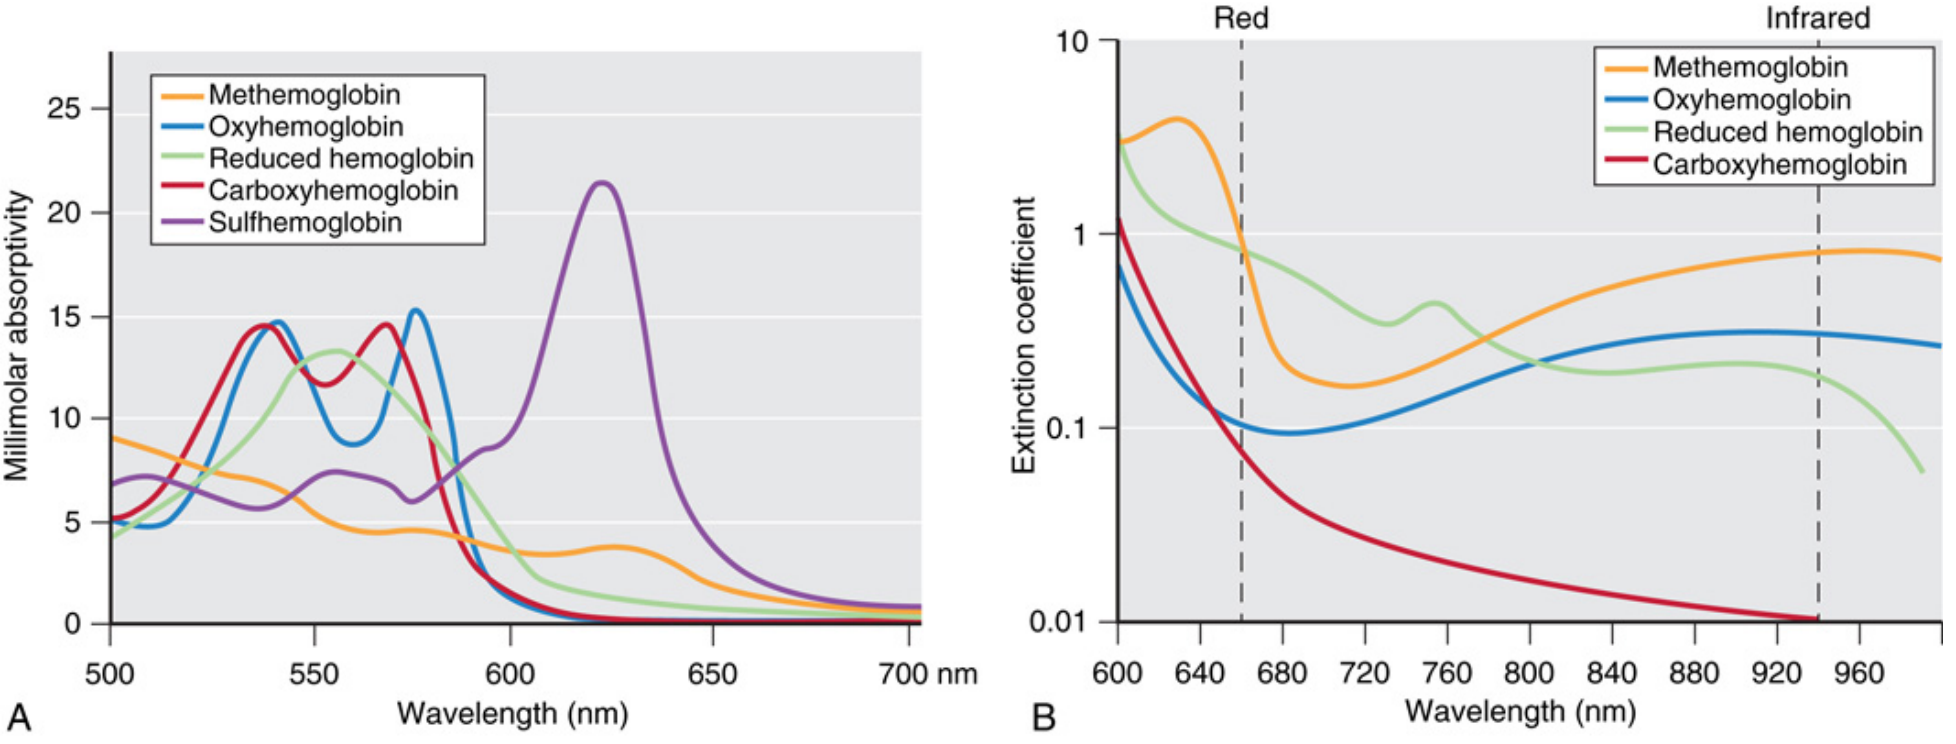
Key teaching points:
- Panel A (left): All 5 Hb species shown across visible spectrum (500-700 nm)
- Panel B (right): The two dashed vertical lines = the two wavelengths used by pulse oximeters: 660 nm (red) and 940 nm (infrared)
- At 660 nm: Reduced (deoxy) Hb absorbs MUCH more than OxyHb - so well-oxygenated blood transmits more red light
- At 940 nm: OxyHb absorbs more than reduced Hb - infrared discriminates in the opposite direction
- Critical viva point: At 660 nm, COHb (carboxyhaemoglobin) has nearly the same extinction coefficient as O2Hb (red line ≈ blue line at 660 nm) - this explains why CO poisoning produces falsely high SpO2
- MetHb (orange) has high absorption at BOTH wavelengths - this drives the R ratio toward 1.0, which on the calibration curve corresponds to ~85% SpO2, regardless of true saturation
3. AC/DC Pulse Principle - How Arterial Blood is Isolated
(Miller's Anesthesia 10e, Fig. 37.4)
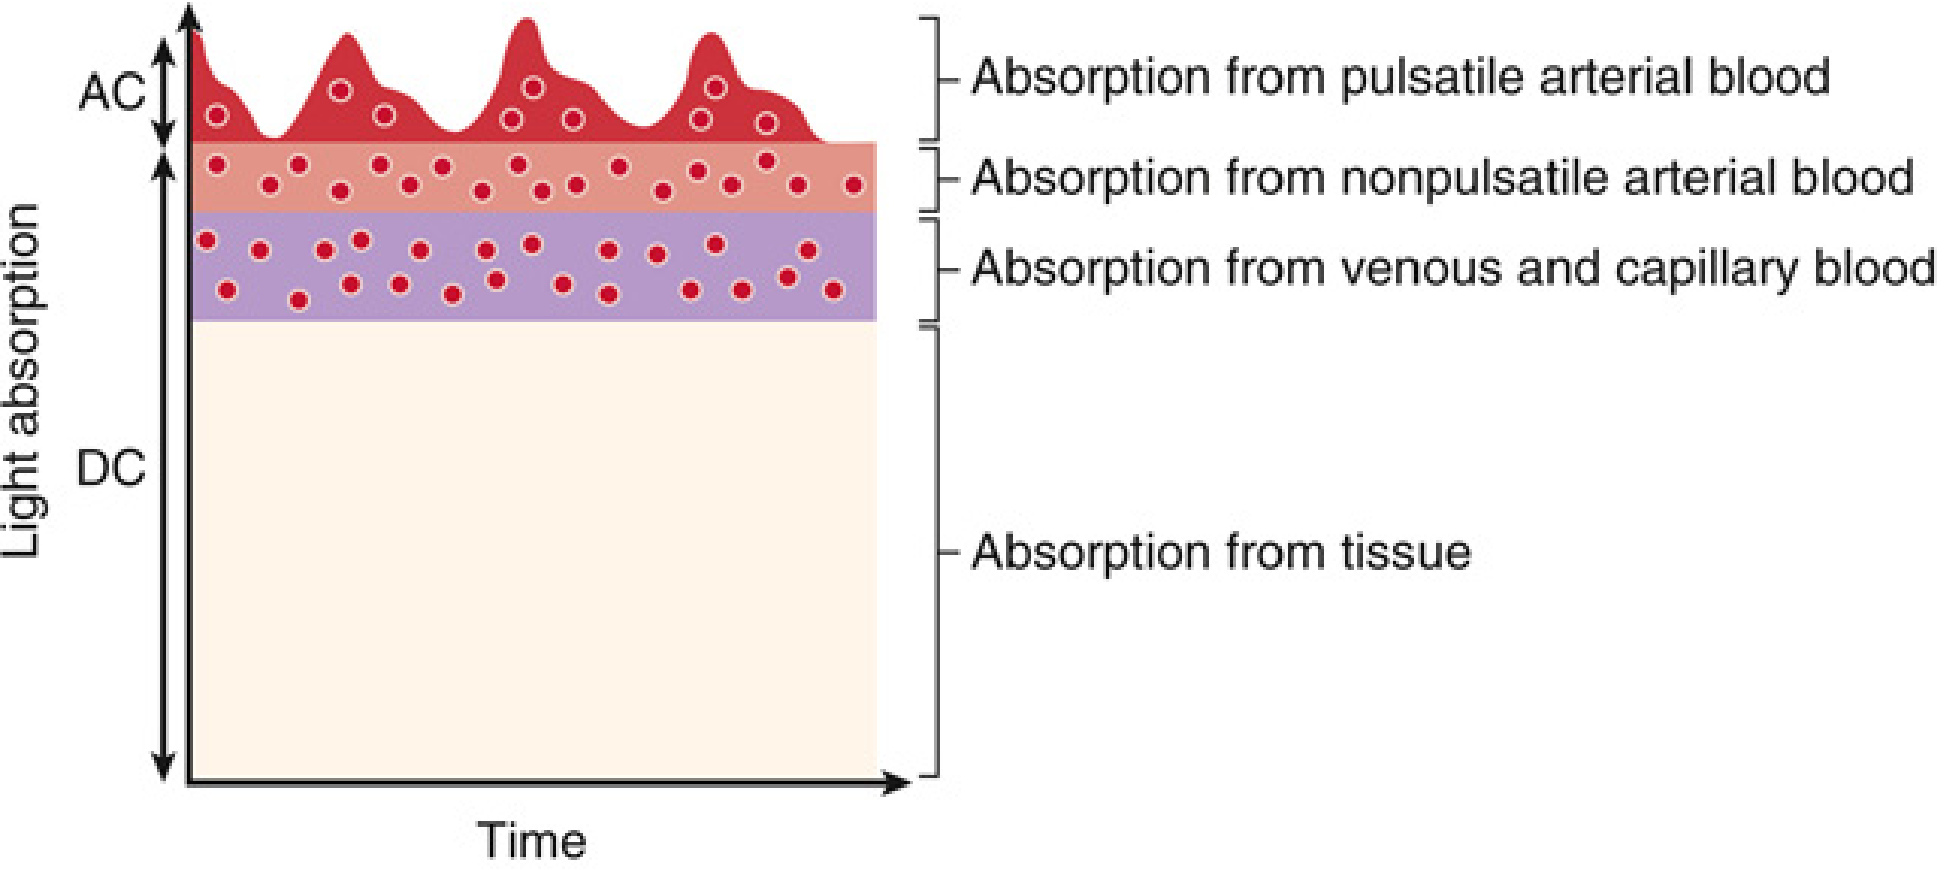
Key teaching points:
- The DC (non-pulsatile) component = background absorption from tissue, venous blood, capillary blood - constant, ignored
- The AC (pulsatile) component at the top = absorption that changes with each heartbeat = arterial blood only
- The pulse oximeter calculates the ratio R = (AC660/DC660) / (AC940/DC940) - this ratio isolates arterial saturation from all background tissue
- This is why poor peripheral perfusion (shock, hypothermia, vasoconstriction) causes loss of signal - the AC component disappears when there is no pulsatile flow
4. Calibration Curve: R-ratio to SpO2
(Miller's Anesthesia 10e, Fig. 37.5)
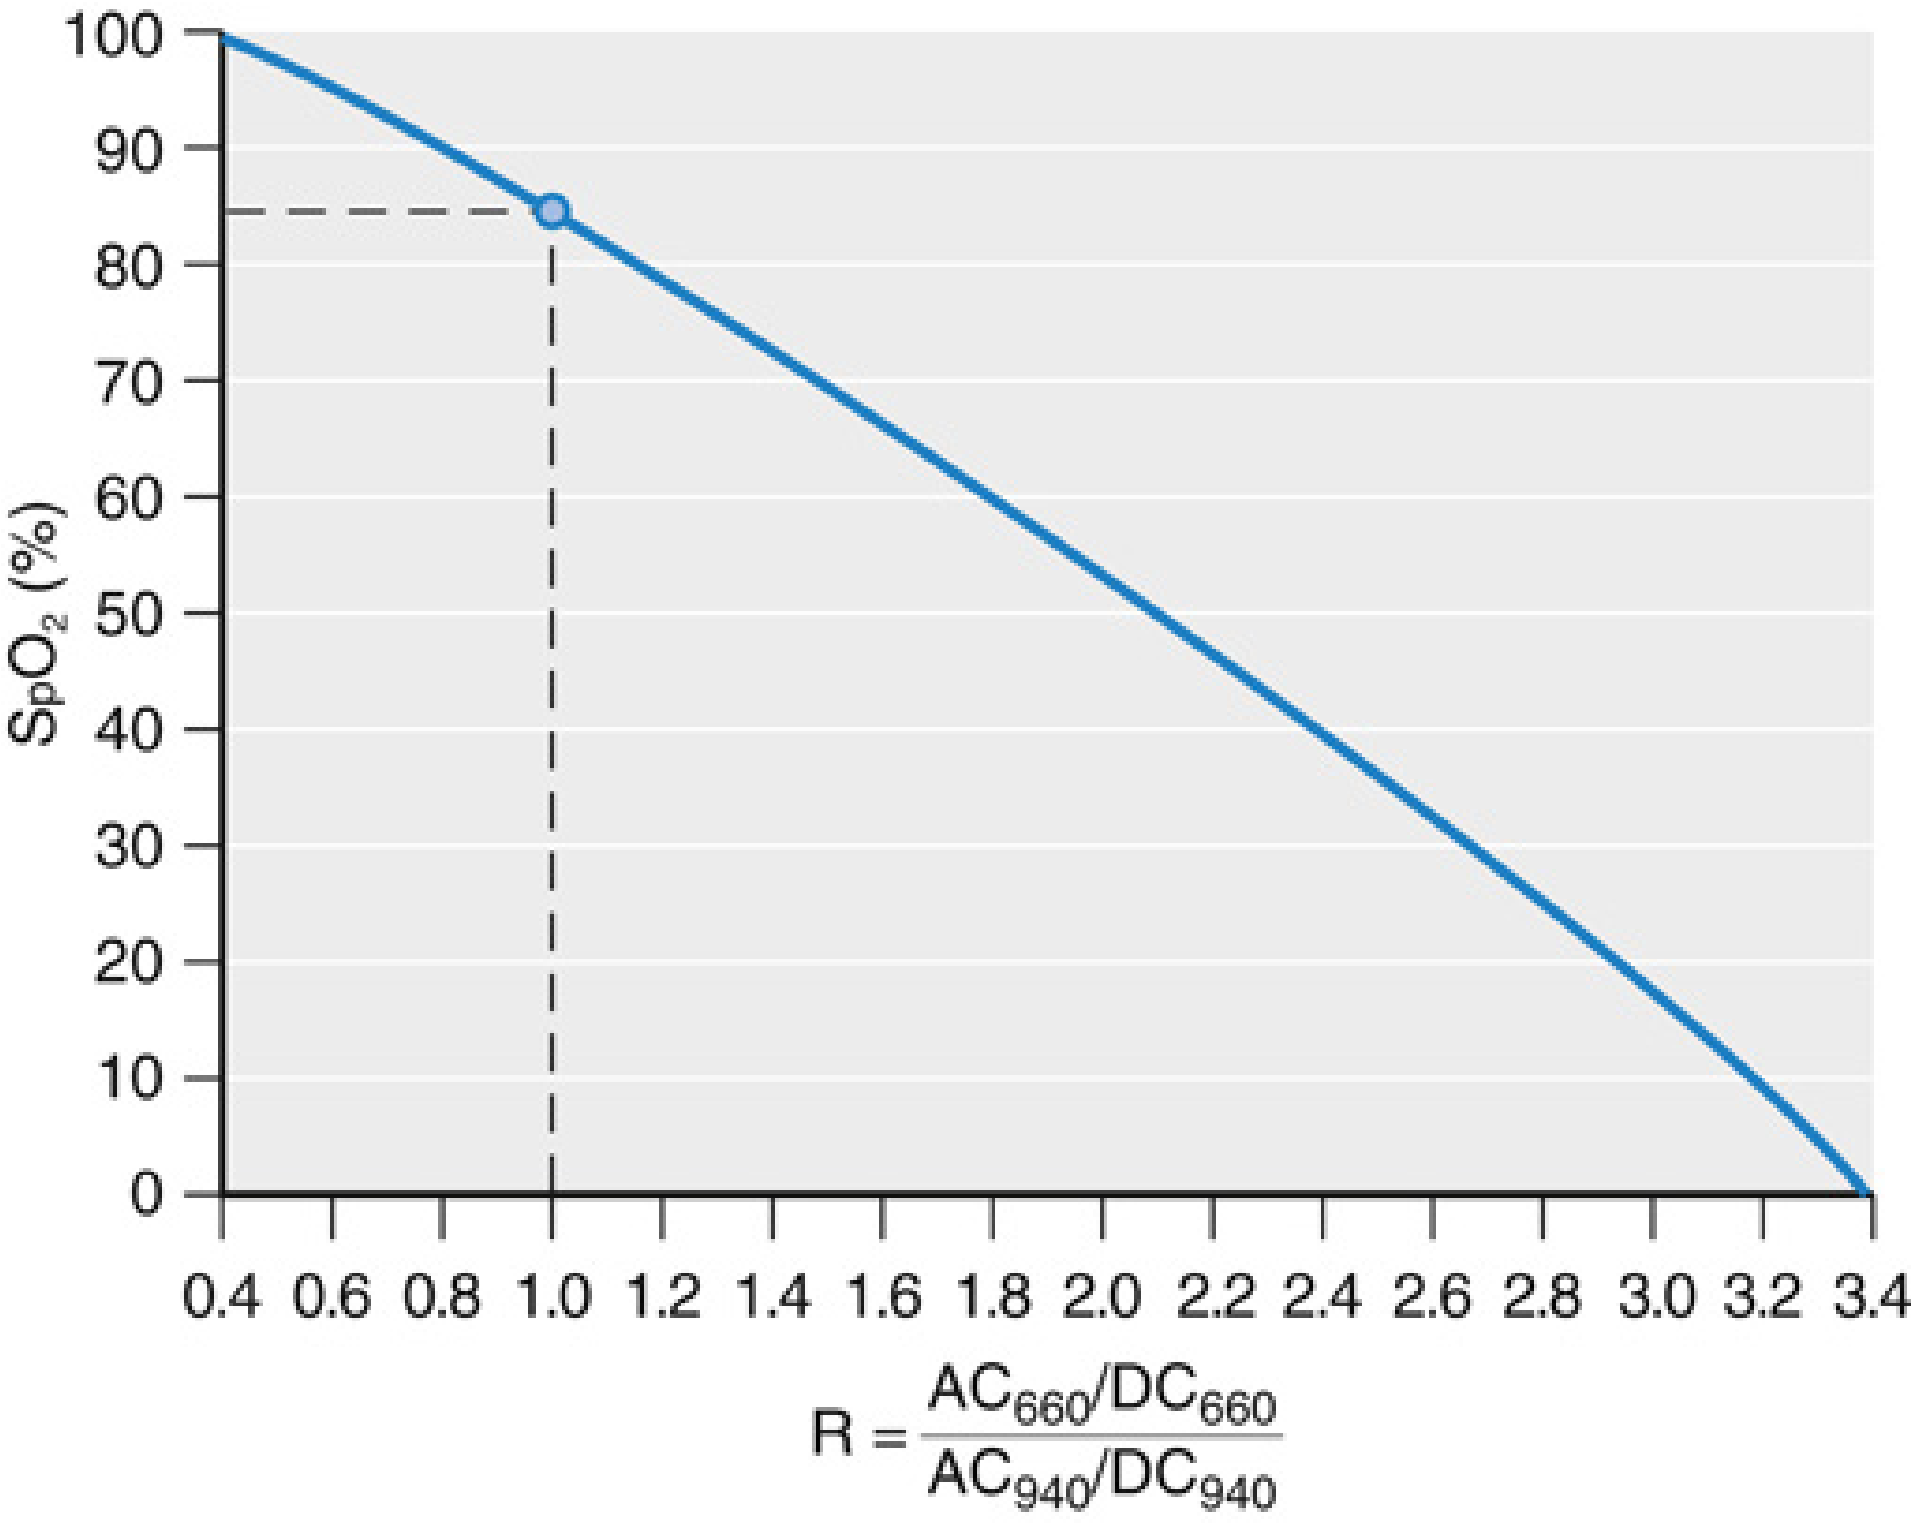
Key teaching points:
- The R ratio (x-axis) is mathematically derived from AC and DC light absorption at both wavelengths
- The SpO2 (y-axis) is read off this empirically-derived calibration curve built into each oximeter
- Dashed lines at R=1.0, SpO2=85%: When R=1 (equal absorption at both wavelengths, as happens with MetHb), SpO2 reads 85% - this is the classic MetHb trap
- Calibration was performed only in volunteers down to SpO2 70% - accuracy below 70% is unknown and unreliable
- Each manufacturer has their own proprietary calibration curve
5. Photoplethysmogram (PPG Waveform)
(Miller's Anesthesia 10e, Fig. 37.6)
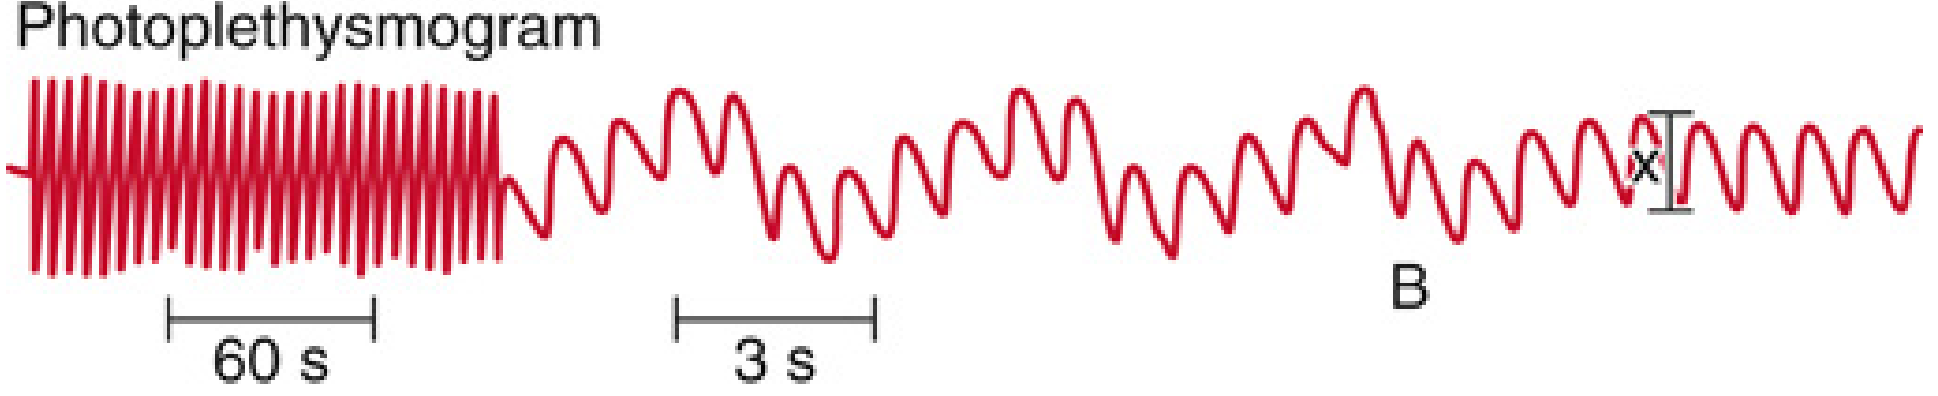
Key teaching points:
- The pulse oximeter trace is also a photoplethysmograph - it shows arterial blood volume changes beat to beat
- Left section (60s scale): tight, small amplitude = fast heart rate
- Middle/right (3s scale): larger waves with respiratory variation in amplitude (ΔPOP)
- Point B: ventilation stopped - respiratory variation disappears
- Clinical use: Respiratory variation in PPG amplitude predicts fluid responsiveness in mechanically ventilated patients (PVI - Pleth Variability Index)
- Large respiratory swings in PPG = patient likely fluid-responsive
CAPNOGRAPHY IMAGES
6. Normal Capnogram - Phases Labeled (Simple View)

Phases:
- Phase 1 (blue, baseline): Inspiration - dead space gas, CO2 = 0
- Phase 2 (pink, upstroke): Expiratory upstroke - mixing of dead space + alveolar gas
- Phase 3 (red, plateau): Alveolar plateau - represents alveolar gas CO2
- EtCO2 (green circle): The peak value at end of exhalation = measured end-tidal CO2
- Phase 4 (yellow, downstroke): Inspiratory downstroke - fresh gas washes out CO2
7. Normal Capnogram - Detailed Anatomy
(Deranged Physiology)

Key teaching points:
- Transitional part (Phase II): Mixing of dead space and alveolar gas - the upstroke represents washout of anatomical dead space
- Alveolar plateau (Phase III): Average alveolar CO2 concentration - should be nearly flat (slight upslope is normal)
- Alpha angle: Transition from Phase II to III - represents the quality of alveolar emptying. Widened (>110°) in obstructive disease (bronchospasm, COPD) because different lung units empty at different times
- End-tidal CO2: Measured at the peak of Phase III = maximal alveolar CO2 concentration
- CO2 must return to zero on inspiration - if it does not, there is rebreathing (exhausted soda lime or faulty inspiratory valve)
8. Normal Capnogram with Phase Labels (Classic Textbook Style)

Key teaching points:
- Phase I: Respiratory baseline at 0 mmHg - dead space gas, no CO2
- Phase II: Expiratory upstroke - steep rise as alveolar gas begins to exit
- Phase III: Alveolar plateau - EtCO2 measured at the highest point
- Phase 0: Inspiratory downstroke - rapid return to zero as fresh gas enters
- Normal EtCO2 = 35-45 mmHg; Normal PaCO2-EtCO2 gradient = 2-5 mmHg
ABNORMAL WAVEFORM PATTERNS SUMMARY TABLE
| Pattern | What it looks like | Cause |
|---|---|---|
| Shark fin / obstructive | Slanted, prolonged upstroke; Phase III slopes upward | Bronchospasm, COPD, asthma |
| Elevated baseline | Does not return to zero on inspiration | Rebreathing - exhausted soda lime, faulty inspiratory valve |
| Sudden drop to zero | Flat line at zero | Oesophageal intubation, disconnection, circuit obstruction, cardiac arrest |
| Sudden rise then high plateau | Abrupt EtCO2 increase | Malignant hyperthermia, hypoventilation, tourniquet release, laparoscopy |
| Gradual decrease | EtCO2 progressively falls | Pulmonary embolism, decreasing cardiac output, haemorrhage |
| Curare cleft (notch in plateau) | Notch/dip in Phase III plateau | Return of spontaneous breathing - NMB wearing off |
| Cardiogenic oscillations | Small oscillations on plateau | Heartbeat transmitted to lungs - strong cardiac output, slow RR |
| Sudden rise during CPR | EtCO2 jumps from <10 to >40 mmHg | ROSC - return of spontaneous circulation |
IMAGE SOURCES
- Miller's Anesthesia 10e (Figs 37.2, 37.3, 37.4, 37.5, 37.6) - all textbook images from the medical library
- Normal waveform diagram from Don't Forget the Bubbles (Owen Hibberd, 2022)
- Capnogram anatomy from Deranged Physiology
- Phase-labeled capnogram from medical education resource via capnography.com
This is a shared conversation. Sign in to Orris to start your own chat.