

Analyse the ecg
ECG Analysis - Medway Hospitals, Kumbakonam (31.07.2026, 17:22:31)
Technical Details
- Machine: GE MAC2000, 12SL algorithm v241
- Speed: 25 mm/s | Gain: 10 mm/mV
- Filter: 0.56-40 Hz, 50 Hz notch
Measured Intervals (from report header)
| Parameter | Value | Normal Range | Interpretation |
|---|---|---|---|
| Heart Rate | 78 bpm | 60-100 | Normal |
| QRS Duration | 80 ms | <120 ms | Normal (narrow) |
| QT / QTc | 358 / 408 ms | QTc <440 ms (M) | Normal |
| PR Interval | 134 ms | 120-200 ms | Normal |
| P wave duration | 100 ms | <120 ms | Normal |
| RR / PP | 770 / 769 ms | Regular | Regular |
| Axis (P/QRS/T) | 69 / 45 / 46° | -30° to +90° | Normal axis |
Rhythm
- Normal Sinus Rhythm - every QRS is preceded by a P wave; P wave upright in I, II, aVF and inverted in aVR, confirming sinus origin
- Rate is 78 bpm, regular
P Wave Analysis
- P wave duration 100 ms (normal <120 ms)
- The machine flags "Possible Left Atrial Enlargement" - this likely reflects a biphasic P wave in V1 (broad terminal negative component), suggesting left atrial abnormality/enlargement
- Left atrial enlargement on ECG criteria: P wave notching in II ("P mitrale") or terminal negative portion in V1 >1 mm deep and >40 ms wide
QRS Complex
- Duration 80 ms - narrow, normal ventricular conduction
- Left Ventricular Hypertrophy (LVH) is flagged by the machine - likely based on voltage criteria:
- Tall R waves in lateral leads (I, aVL, V4-V6)
- Deep S waves in V1-V2
- The V4 and V5 leads show tall, prominent R waves consistent with LVH
- Common LVH voltage criteria include:
- Sokolow-Lyon: S in V1 + R in V5 or V6 ≥35 mm
- Cornell: R in aVL + S in V3 ≥28 mm (men) / ≥20 mm (women)
ST Segments & T Waves
- No obvious ST elevation or depression visible on review
- T waves appear concordant (upright in lateral leads)
- No signs of acute ischemia or injury pattern
Axis
- P axis: 69° (normal)
- QRS axis: 45° (normal - no left or right axis deviation)
- T axis: 46° (concordant with QRS - normal)
Summary of Findings
| Finding | Clinical Significance |
|---|---|
| Normal Sinus Rhythm, 78 bpm | Reassuring |
| Possible Left Atrial Enlargement | Suggests pressure/volume overload of LA; associated with hypertension, mitral valve disease, or LVH |
| Left Ventricular Hypertrophy | Common with long-standing hypertension, aortic stenosis, hypertrophic cardiomyopathy |
| Normal QTc (408 ms) | No prolonged repolarization |
| No acute ischemic changes | No STEMI/NSTEMI pattern |
Clinical Correlation
- Systemic hypertension (most common cause) - chronic pressure overload leads to LVH, then LAE
- Aortic stenosis - pressure overload pattern
- Hypertrophic cardiomyopathy (HCM)
- Mitral valve disease (particularly mitral regurgitation or stenosis)
Note: This is a computer-interpreted ECG (marked "Unconfirmed"). All findings require clinical correlation and confirmation by a qualified physician.
Search for imaging studies that correlate with these ECG findings
left ventricular hypertrophy echocardiogram imaging
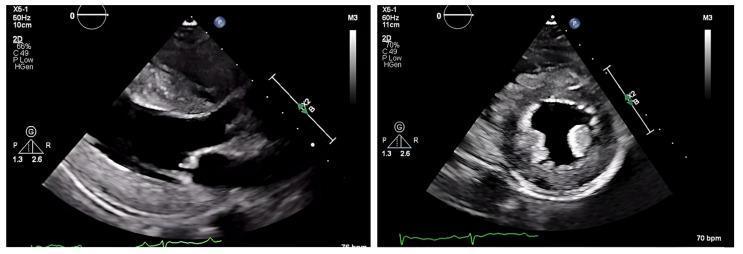
Two-dimensional transthoracic echocardiogram (ECHO) images demonstrating severe left ventricular hypertrophy (LVH). The image on the left shows a parasternal long-axis view, highlighting significant thickening of the interventricular septum and the posterior wall of the left ventricle. The image on the right displays a parasternal short-axis (transverse) view at the level of the papillary muscles, revealing concentric thickening of the myocardium and a resultant reduction in the left ventricular cavity size. The myocardial texture appears slightly speckled or echogenic, a visual finding often associated with infiltrative cardiomyopathies such as cardiac amyloidosis. Both views show a small pericardial effusion visible as an echo-free space posterior to the left ventricle. Annotation scales (10cm and 11cm depth) and transducer settings (X5-1, 50-60Hz) are visible on the periphery. This educational visual is used to differentiate between structural wall mass increases on imaging and the low-voltage electrical activity typically seen on an electrocardiogram in patients with hATTR cardiac amyloidosis.
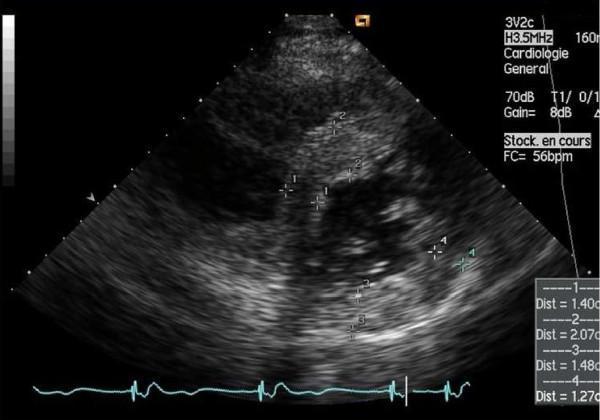
Diagnostic Image: Transthoracic echocardiogram in a parasternal short-axis (PSAX) view at the mid-ventricular level. The image demonstrates significant concentric left ventricular hypertrophy (LVH), a common cardiac manifestation of Fabry disease. The left ventricular (LV) myocardium exhibits increased echogenicity with a relatively preserved homogeneous granular texture. Calipers and numerical annotations indicate quantitative measurements of wall thickness: Point 1 (1.40 cm), Point 2 (2.07 cm), Point 3 (1.48 cm), and Point 4 (1.27 cm), confirming pathologically thickened interventricular septal and posterior walls. An electrocardiogram (ECG) trace is visible at the bottom of the frame for cardiac cycle synchronization. This visual is intended for medical education regarding the diagnostic imaging of storage-disorder-induced cardiomyopathies and the quantification of ventricular remodeling.
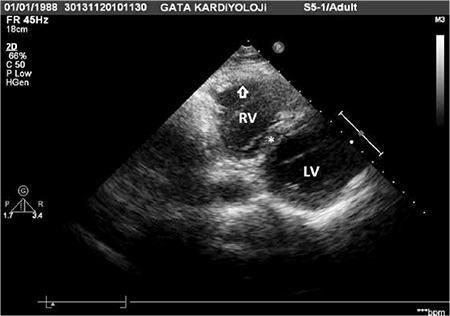
A 2D transthoracic echocardiogram in a left parasternal, basal, short-axis projection illustrating significant right-heart pathology. The image displays a dilated and hypertrophied right ventricle (RV) compared to the left ventricle (LV). An arrow points to the thickened RV free wall, noted to be 11.4 mm, indicating right ventricular hypertrophy. The RV chamber is prominently enlarged with a measured area of 18.1 cm², consistent with volume or pressure overload. The interventricular septum (marked with an asterisk) appears displaced, suggesting altered ventricular hemodynamics. The left ventricle (LV) is labeled in its respective inferior-right position within the ultrasound sector. This diagnostic imaging provides visual evidence of chronic right-sided heart strain, often seen in congenital heart conditions such as Scimitar syndrome or pulmonary hypertension. The modality is an adult echocardiographic study used to evaluate cardiac chamber dimensions, wall thickness, and spatial relationships between the ventricles.
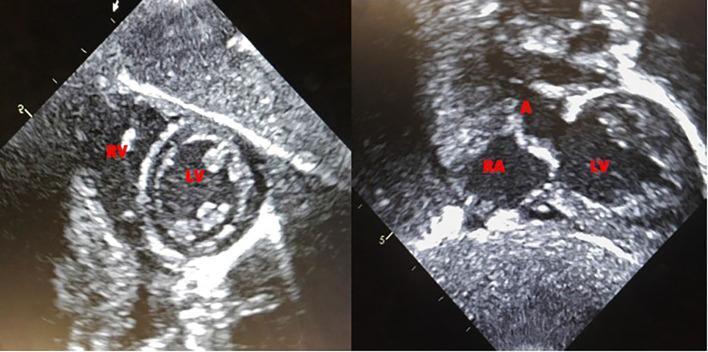
This diagnostic imaging contains two side-by-side echocardiogram frames from a patient at 11 weeks of life, demonstrating the resolution of previously noted biventricular hypertrophy. The left panel shows a short-axis view of the heart, where the left ventricle (LV) and right ventricle (RV) are labeled. The ventricular septal wall and free walls appear to have normalized in thickness, and the LV chamber maintains a regular circular morphology. The right panel displays a different echocardiographic plane, likely an apical or subcostal view, labeling the right atrium (RA), the aorta (A), and the left ventricle (LV). The image highlights the normal proportional relationship between the cardiac chambers and the outflow tract. This visual documentation is clinically significant for monitoring the progression and treatment response of pediatric cardiomyopathies, such as those associated with Pompe disease or other metabolic disorders. The educational focus is on identifying cardiac anatomy and assessing ventricular wall thickness using neonatal ultrasound.
left atrial enlargement echocardiography
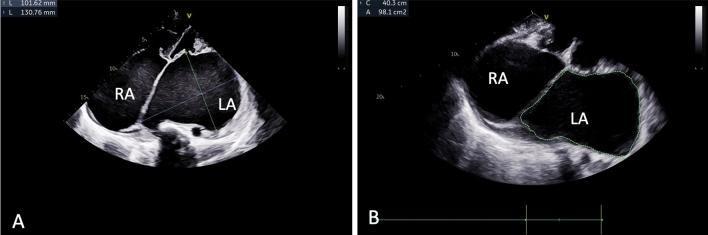
Two-panel echocardiogram demonstrating a case of extreme left atrial enlargement, often referred to as a 'giant left atrium.' Panel A shows a two-dimensional echocardiography view in which the left atrium (LA) and right atrium (RA) are markedly dilated. Linear measurements of the LA are provided, showing dimensions of 130.76 mm and 101.62 mm. Panel B displays the planimetric measurement of the left atrium, where the chamber is outlined with a dotted line, yielding a cross-sectional area of 98.1 cm². The image highlights the morphological impact of chronic rheumatic heart disease, specifically severe mitral valve disease, which typically drives such extreme chamber remodeling. The interatrial septum and adjacent RA are also visible, though the LA disproportionately occupies the cardiac silhouette. These images serve as a classic clinical example of advanced atrial cardiopathy and the quantitative assessment of chamber size using standard echocardiographic parameters.
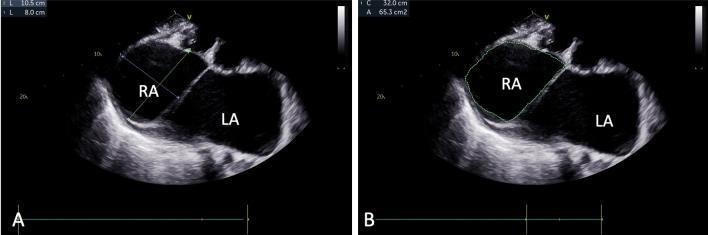
Two-dimensional transthoracic echocardiography images illustrating massive biatrial enlargement, with a primary focus on a giant right atrium (RA). The images show a side-by-side comparison of different measurement modalities. Panel A demonstrates linear measurements of the RA, showing dimensions of 10.5 cm by 8.0 cm. Panel B displays the planimetric measurement of the same chamber, revealing a massive right atrial area of 65.3 cm² and a circumference of 32.0 cm. The left atrium (LA) is also prominently enlarged and labeled. These findings are clinically significant in the context of chronic valvular disease, such as rheumatic heart disease with severe mitral and tricuspid involvement, leading to extreme chamber remodeling. The echocardiogram serves as an educational tool for identifying advanced stages of valvular pathology and severe atrial volume overload.
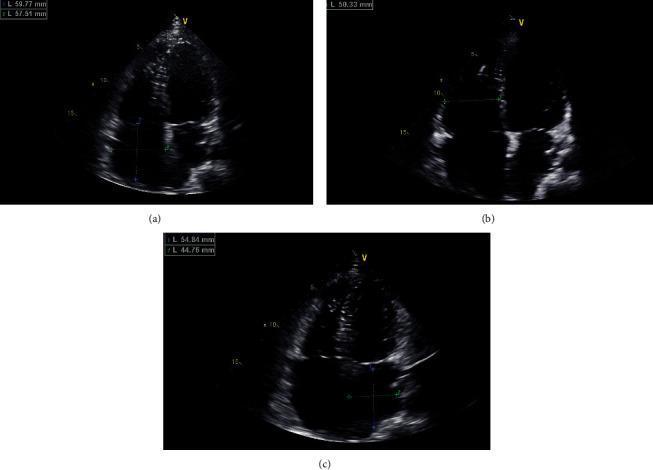
Transthoracic echocardiography images in the apical four-chamber view demonstrating significant chamber enlargement in a patient with a confirmed EMD gene mutation. Image (a) focuses on the right atrium, measuring approximately 59.77 mm by 57.51 mm, indicating severe bi-atrial dilation. Image (b) shows the right ventricle with a measured diameter of roughly 50.33 mm. Image (c) visualizes the left atrium with dimensions of 54.84 mm by 44.76 mm. The images illustrate cardiac structural changes often associated with Emery-Dreifuss muscular dystrophy, including atrial enlargement and secondary ventricular dilation, which may clinically present with arrhythmias such as atrial flutter or atrioventricular block. The modality highlights the use of diagnostic ultrasound for assessing cardiac morphology and chamber dimensions in hereditary myopathies.
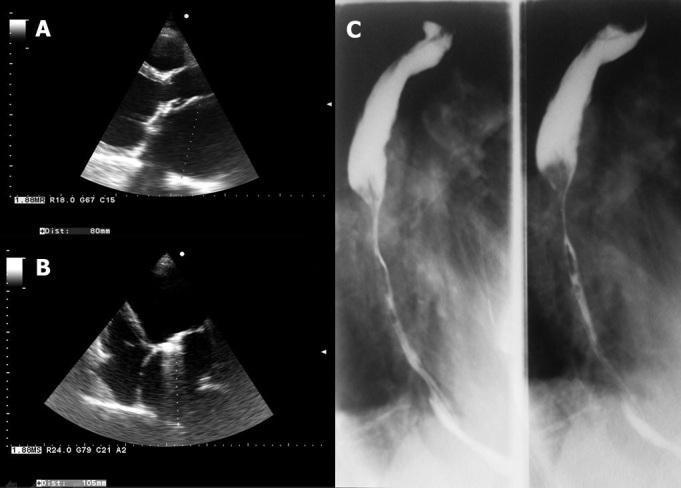
This composite diagnostic image includes echocardiography and barium contrast radiography to demonstrate cardiovascular and gastrointestinal pathology. Panel A shows a transthoracic echocardiogram in the parasternal long axis view, documenting severe left atrial enlargement with a postero-anterior diameter measurement of 80mm. Panel B displays an apical four-chamber view, revealing a significantly dilated left atrium with a longitudinal diameter measured at 105mm. Panel C presents two vertical X-ray views from a barium swallow (upper gastrointestinal series). These radiographs show the esophagus with contrast, highlighting significant luminal narrowing (stricture) in the middle and lower esophageal segments, contrasted against proximal dilation. The clinical correlation suggests an extrinsic compression of the esophagus, likely due to the massive left atrial enlargement (cor bovinum) observed in the echocardiography, a phenomenon known as Ortner's syndrome or dysphagia megalatriensis.
ECG left ventricular hypertrophy left atrial enlargement echocardiography correlation
hypertensive heart disease cardiac MRI left ventricular wall thickening
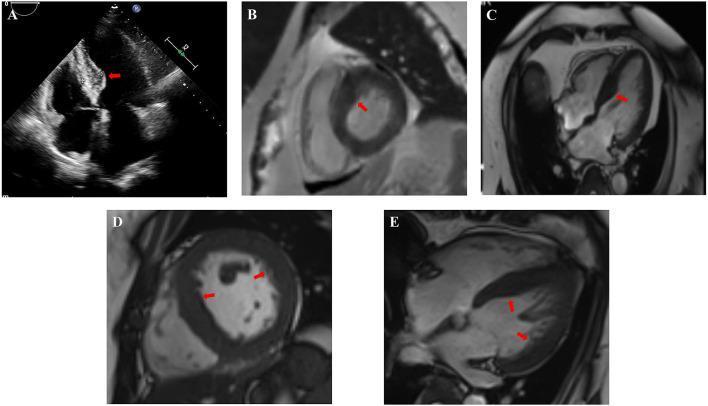
This composite figure presents clinical imaging findings for two cases of Hypertrophic Cardiomyopathy (HCM), utilizing echocardiography and cardiac MRI. Images A-C (Case 2) demonstrate significant asymmetric septal hypertrophy. Panel A (echocardiogram) shows marked thickening at the base of the interventricular septum (IVS). Panels B (short-axis view) and C (four-chamber view) of the cardiac MRI confirm uneven thickening of the basal and intermediate IVS segments, indicated by red arrows, reaching 20-22 mm, while the left ventricular lateral wall remains at a normal thickness of 8-10 mm. Images D-E (Case 3) provide cardiac MRI views showing a less severe but distinct septal thickening of approximately 14-16 mm. Red arrows highlight the non-uniform ventricular wall thickening, contrasting with a lateral wall thickness of 9-11 mm. These imaging modalities illustrate the hallmark features of HCM, including disproportionate septal-to-lateral wall ratios and the heterogeneous distribution of myocardial hypertrophy, essential for distinguishing hereditary cardiomyopathy from secondary causes like hypertensive heart disease.
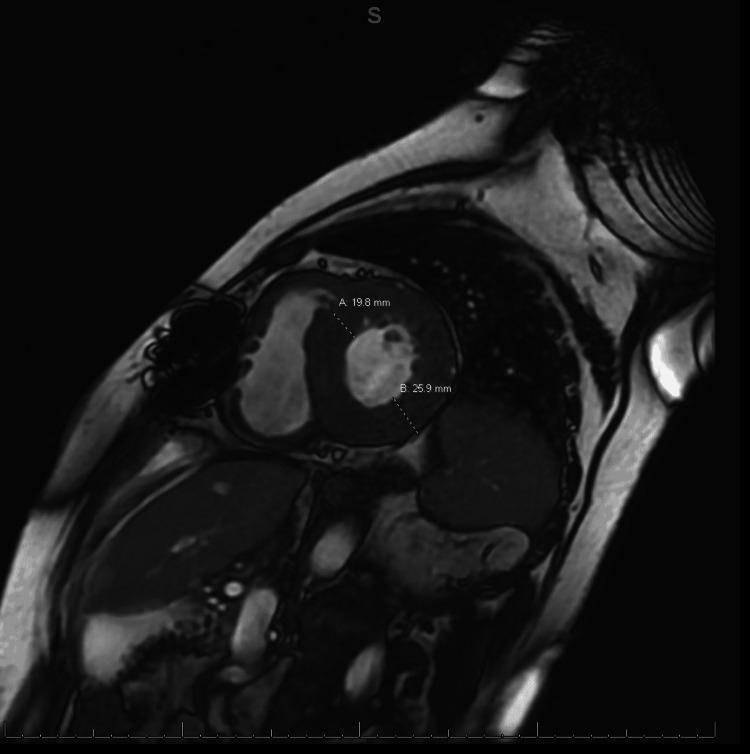
Diagnostic cardiac MRI in a short-axis view demonstrating significant concentric left ventricular (LV) hypertrophy. The image provides quantitative measurements of the myocardial wall thickness: marker 'A' identifies the anteroseptal wall at 19.8 mm, and marker 'B' identifies the posterior lateral wall at 25.9 mm, both significantly exceeding normal physiological limits. The LV chamber appears narrowed due to the increased wall mass. Surrounding anatomical structures including the right ventricle, chest wall, and lungs are visible in this transverse orientation. The imaging is used here to characterize structural changes consistent with infiltrative cardiomyopathies, such as cardiac amyloidosis, or severe hypertensive heart disease. This visual is suitable for advanced cardiology and radiology education focusing on hemodynamic assessment and structural heart disease.
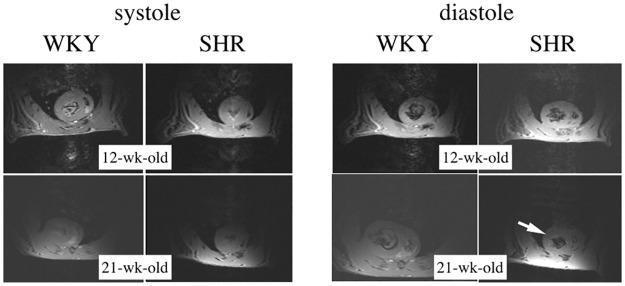
This diagnostic image set displays short-axis cine-MRI frames of the heart obtained at 9.4T, used for a comparative study of cardiac morphology. The panel is divided into two main sections: 'systole' and 'diastole,' featuring two rat models: the control Wistar-Kyoto (WKY) rat and the Spontaneously Hypertensive Rat (SHR). The images compare cardiac structures at 12 weeks and 21 weeks of age. In the systole phase, the ventricular morphology appears relatively consistent across both models and time points. However, in the diastole phase, a significant pathological progression is visible. While the 12-week-old SHR and all WKY control frames show normal left ventricular wall thickness, the 21-week-old SHR frame (indicated by a white arrow) demonstrates clear concentric hypertrophy of the left ventricle. This progressive thickening of the myocardial wall is a characteristic feature of hypertensive heart disease. The images serve as an educational tool for identifying longitudinal morphological changes and diagnostic markers of cardiac hypertrophy using high-field MRI in a clinical research context.
chest X-ray cardiomegaly left atrial enlargement double density sign
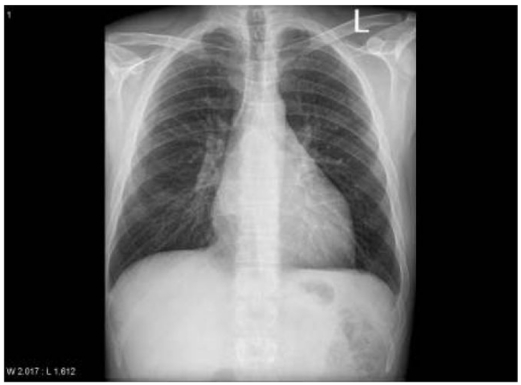
**Modality:** Frontal projection (PA/AP) chest radiograph (CXR). **Anatomical Region:** Thorax, focusing on the mediastinum and tracheobronchial tree. **Key Findings:** - **Tracheobronchial Tree:** Significant widening of the subcarinal angle (splaying of the carina), characterized by the elevation of the left mainstem bronchus. - **Cardiomediastinal Silhouette:** Global cardiomegaly is present. There is specific evidence of left atrial enlargement, indicated by the "double density" sign (overlapping of the enlarged left atrium and the right atrium) and the aforementioned carinal splaying. - **Lungs:** Lung fields appear relatively clear without overt focal consolidation or pleural effusion, though there is prominence of the hila. - **Skeleton/Soft Tissues:** Visualized bony structures and soft tissues are within normal limits for this projection. **Diagnostic Significance:** The splaying of the carina (subcarinal angle >90 degrees) in the context of a double density sign is a classic radiologic indicator of left atrial enlargement. This can be associated with conditions such as mitral valve disease or chronic heart failure. **Database Keywords:** Chest X-ray, cardiomegaly, splayed carina, subcarinal angle, left atrial enlargement, double density sign, mitral valve disease.
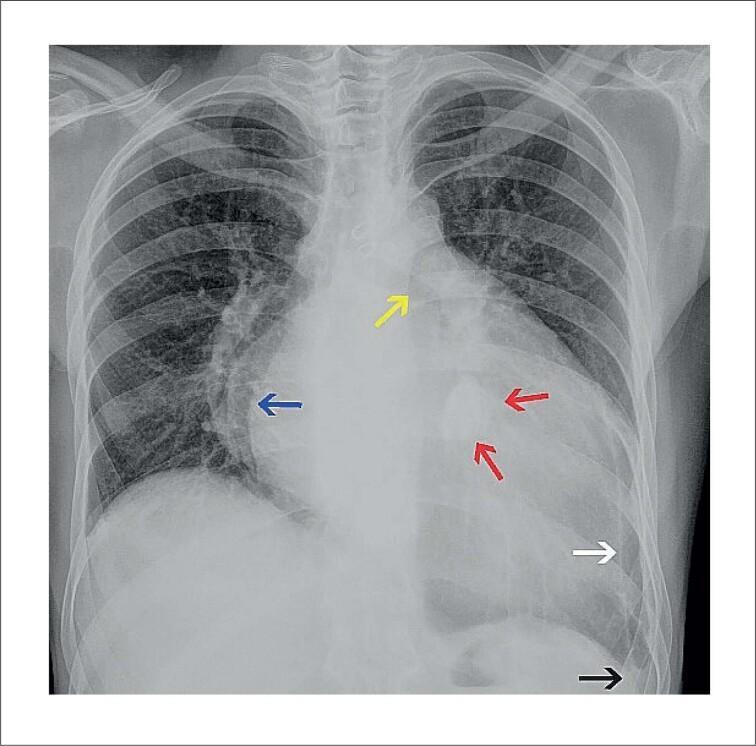
Posteroanterior (PA) chest radiograph demonstrating significant cardiomegaly and specific signs of multi-chamber enlargement, particularly the left atrium. Key findings include the 'double density' sign (blue arrow) along the right heart border and elevation of the left mainstem bronchus (yellow arrow), both classic radiographic indicators of left atrial enlargement. A well-defined, oval hyperdense lesion (red arrows), approximately 3.5 cm x 2.0 cm, is visible projected over the cardiac silhouette near the expected location of the mitral valve, consistent with caseous calcification of the mitral annulus (CCMA). Additionally, the left costophrenic angle is obliterated (black arrow), suggesting a small pleural effusion, and a linear calcification is noted along the peripheral left hemithorax (white arrow), possibly representing pleural calcification. The overall cardiac configuration, including a straightened left heart border and enlarged silhouette, is highly suggestive of advanced valvular heart disease, such as rheumatic heart disease, resulting in chronic heart failure.
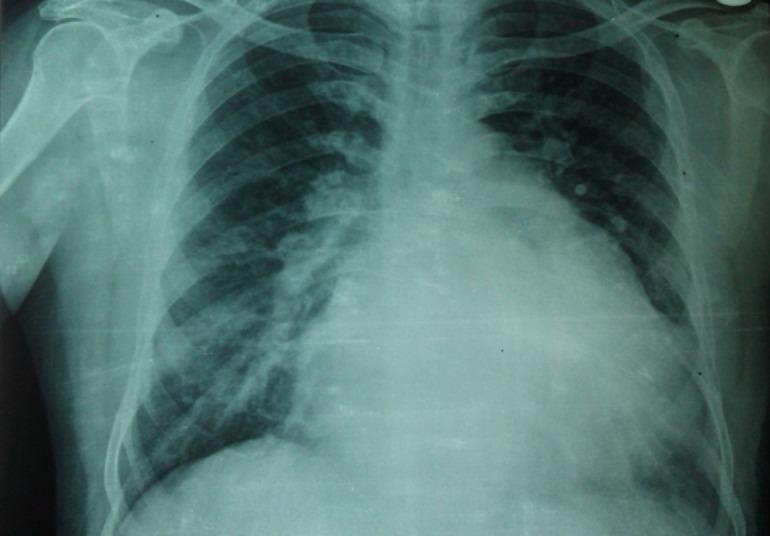
This diagnostic image is a posterior-anterior (PA) chest X-ray demonstrating significant cardiomegaly and pulmonary vascular congestion. The cardiac silhouette is markedly enlarged, occupying more than 50% of the thoracic diameter. Key radiographic findings include straightening of the left heart border and a double density sign, highly suggestive of left atrial enlargement. The pulmonary vasculature appears prominent, particularly in the perihilar regions, with associated interstitial haziness and increased pulmonary markings indicating pulmonary overflow or venous congestion. These findings are clinically relevant for evaluating valvular heart disease, such as mitral stenosis, or congenital defects like atrial septal defect (ASD) that lead to chronic volume overload. The image serves as an educational example of how chronic cardiac remodeling manifests radiographically, highlighting the relationship between left-sided heart disease and secondary pulmonary vascular changes.
ECG LVH echocardiography diagnostic accuracy hypertension
Imaging Correlates of ECG Findings
ECG findings to correlate:
- Left Ventricular Hypertrophy (LVH)
- Possible Left Atrial Enlargement (LAE)
1. Echocardiography (Primary Imaging Modality)
LVH on Echo
| Parameter | Normal | LVH Threshold |
|---|---|---|
| IVS thickness (diastole) | <11 mm | ≥12 mm (men), ≥11 mm (women) |
| Posterior wall thickness | <11 mm | ≥12 mm |
| LV mass index (men) | <115 g/m² | ≥115 g/m² |
| LV mass index (women) | <95 g/m² | ≥95 g/m² |
| Relative wall thickness | <0.42 | ≥0.42 = concentric |
LAE on Echo

| Parameter | Normal | Mild | Moderate | Severe |
|---|---|---|---|---|
| LA diameter (PLAX) | <38 mm | 38-40 mm | 41-46 mm | >46 mm |
| LA volume index | <34 mL/m² | 34-41 | 42-48 | >48 |
2. Chest X-Ray Findings
- Double density sign (enlarged LA superimposed on right cardiac border)
- Carinal splaying (subcarinal angle >90°)
- Elevation and posterior displacement of left mainstem bronchus
- Straightening/bulge of left heart border (LA appendage)
- Cardiomegaly (cardiothoracic ratio >0.5)
- Rounded, boot-shaped cardiac silhouette
- Left ventricular prominence
3. Cardiac MRI (Gold Standard for LV Mass Quantification)
- No acoustic window limitations
- Precise LV mass measurement (±5%)
- Late gadolinium enhancement (LGE) to differentiate causes:
- Hypertensive LVH: no LGE or patchy mid-wall fibrosis
- HCM: insertion-point LGE or patchy RV/septal LGE
- Cardiac amyloid: subendocardial/global LGE ("zebra" pattern)
4. ECG-to-Echo Diagnostic Accuracy (Evidence)
- ECG LVH criteria have high specificity (~90%) but low sensitivity (~30-50%) compared to echo
- Sokolow-Lyon criteria tend to underdiagnose LVH in South Asian patients due to body habitus differences
- A 2024 narrative review in Am J Hypertens (PMID 38112655) evaluates newer ECG criteria (Peguero-Lo Presti) that may outperform classical criteria for echo-confirmed LVH
Recommended Imaging Workup for This Patient
| Priority | Study | What to Look For |
|---|---|---|
| 1st | Transthoracic Echo (TTE) | LV wall thickness, LV mass index, LA diameter/volume, EF, diastolic function (E/e'), valvular disease |
| 2nd | Chest X-ray | Cardiomegaly, double density sign, pulmonary congestion |
| 3rd (if echo inconclusive) | Cardiac MRI | Precise LV mass, LGE pattern to distinguish HCM vs hypertensive LVH vs amyloid |
| Ancillary | BP monitoring, renal function, ABPM | Confirm hypertension as the underlying cause |
The most likely unifying diagnosis for LVH + LAE in an adult from this clinical setting is hypertensive heart disease. Echo will quantify severity and guide management.