ECG
Asking for Preferences
Reading File
Finding Sources
Searching Images
ECG waves P QRS T interpretation normal electrocardiogram
Finding Sources
Loading Image
Finding Sources
Searching Images
ECG waveform diagram P wave QRS complex T wave labeled intervals PR QT
Reading File
Reading File
Loading Image
Reading File
Loading Image
Loading Image
Here is a comprehensive guide to ECG basic interpretation and waves, sourced from Goldman-Cecil Medicine, Tietz Textbook of Laboratory Medicine, and Harrison's Principles of Internal Medicine.
What Is an ECG?
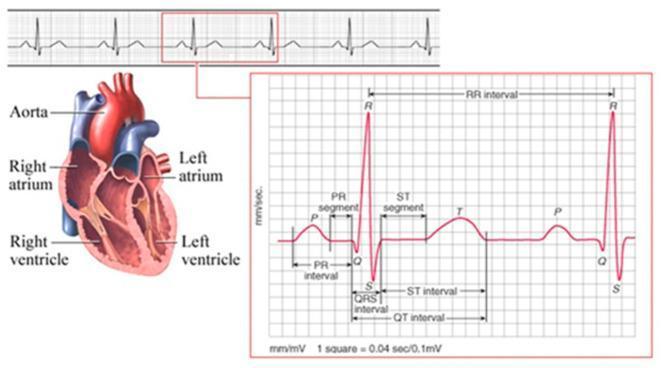
An electrocardiogram records the heart's electrical activity from multiple vantage points on the body's surface simultaneously, allowing analysis of electrical activation in different myocardial regions. Standard recording: 25 mm/sec, 10 mm = 1 mV.
The ECG Paper Grid
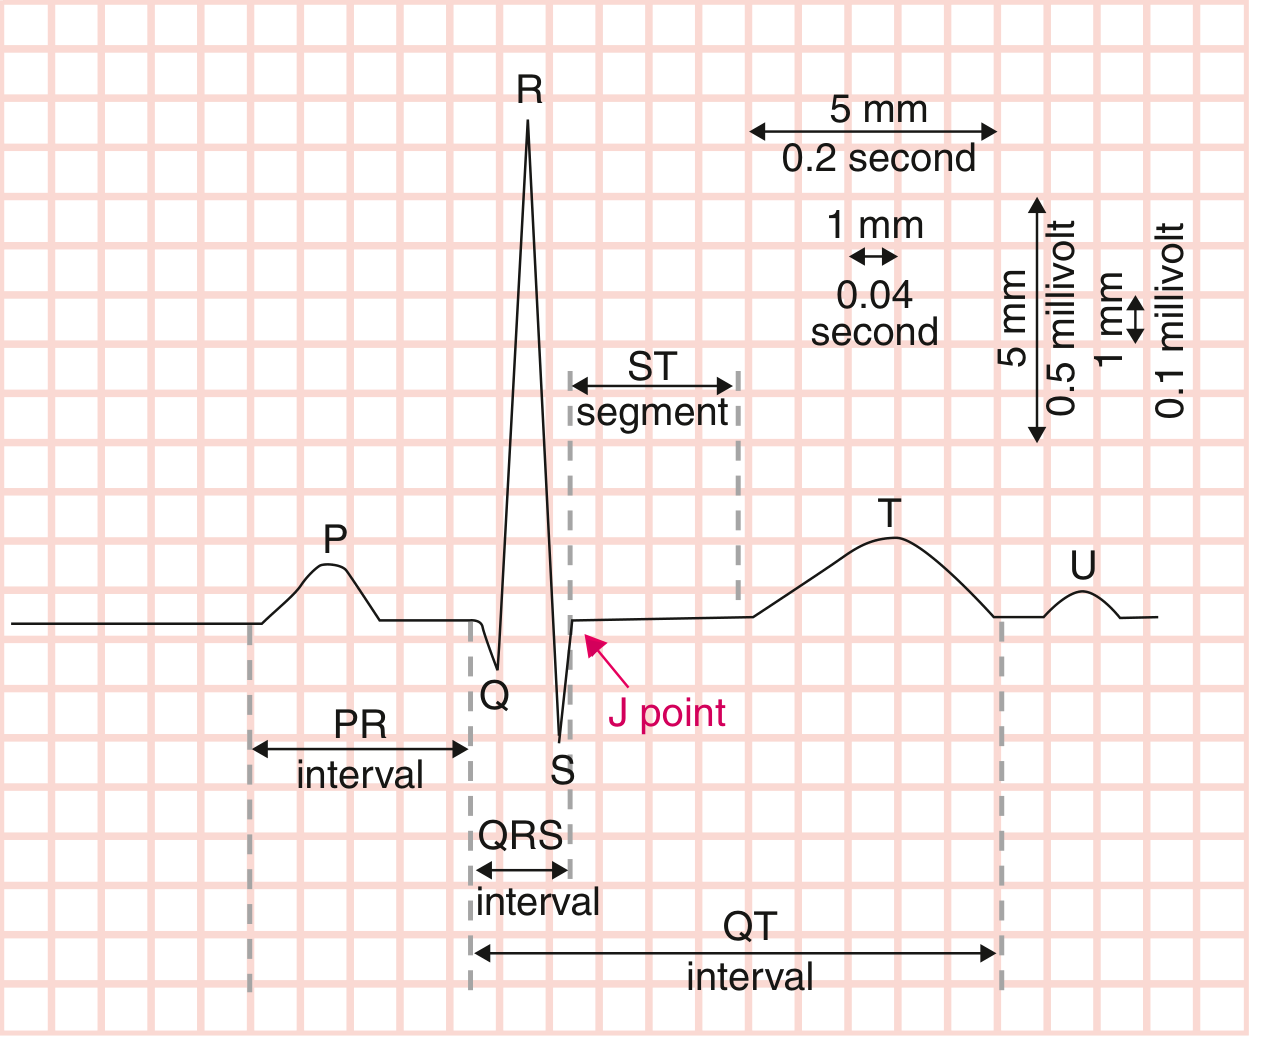
| Axis | Small box (1 mm) | Large box (5 mm) |
|---|---|---|
| Time (horizontal) | 0.04 sec (40 ms) | 0.20 sec (200 ms) |
| Voltage (vertical) | 0.1 mV | 0.5 mV |
The Waves & What They Represent
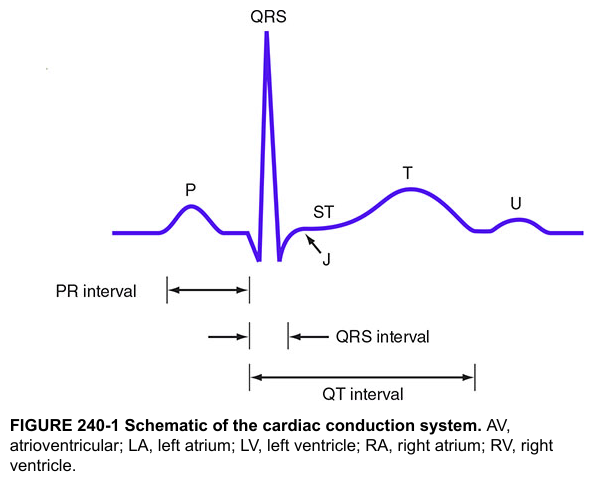
P Wave
- Represents atrial depolarization (both right and left atria)
- Triggers atrial muscular contraction
- Normal: small, rounded, upright in leads I, II, aVF
QRS Complex
- Represents ventricular depolarization
- Much larger amplitude than the P wave (due to greater ventricular muscle mass)
- Made of up to 3 deflections:
- Q wave — first negative deflection (when present)
- R wave — first positive deflection
- S wave — negative deflection after the R wave
- (An R' wave = a second positive deflection, if present)
- Not every QRS will have all three components; the path of ventricular depolarization determines which appear
- Normal duration: < 120 ms (3 small boxes)
ST Segment
- Flat segment between QRS and T wave, starting at the J point
- Represents the plateau phase of ventricular action potential
- Normally isoelectric (flat, at baseline)
- Elevation or depression is a key sign of ischemia/infarction
T Wave
- Represents ventricular repolarization
- Mean electrical vector is normally concordant with the mean QRS vector (same direction)
- Normally upright in I, II, V2–V6; inverted in aVR
U Wave
- Small deflection after T wave (not always visible)
- Thought to represent repolarization of the Purkinje fibers or papillary muscles
- Prominent U waves seen in hypokalemia and bradycardia
Key Intervals & Normal Values
| Interval | What it measures | Normal value |
|---|---|---|
| PR interval | Onset of P wave → onset of QRS; conduction through atria, AV node, His-Purkinje | 120–200 ms (3–5 small boxes) |
| QRS duration | Duration of ventricular depolarization | < 120 ms (< 3 small boxes) |
| QT interval | Onset of QRS → end of T wave; total ventricular electrical systole | ≤ 440 ms (rate-corrected QTc) |
| ST segment | J point to T wave onset | Isoelectric (no elevation/depression > 1 mm) |
| RR interval | R peak to R peak; used to calculate heart rate | 600–1000 ms at normal HR (60–100 bpm) |
Heart rate from ECG: HR = 300 ÷ number of large boxes between R-R peaks
The 12 Leads
A standard ECG has 12 leads, each viewing the heart from a different angle:
- Limb leads (6): I, II, III, aVR, aVL, aVF — record between arm and leg electrodes
- Precordial/chest leads (6): V1–V6 — placed across the sternum and left precordium
Each lead records the same electrical impulse from a different spatial vantage point. Abnormalities are localized by comparing which leads show changes.
Systematic Approach to Basic Interpretation
- Rate — Count R-R intervals (300 ÷ large boxes, or 1500 ÷ small boxes)
- Rhythm — Regular or irregular? Is there a P before every QRS?
- Axis — Lead I and aVF: normal axis = both upright (roughly)
- P waves — Present? Morphology? One per QRS?
- PR interval — Short (<120 ms → pre-excitation), long (>200 ms → 1st degree AV block)
- QRS duration — Wide (≥120 ms → bundle branch block or ventricular rhythm)?
- ST segments & T waves — Elevation, depression, inversion?
- QT interval — Prolonged (risk of Torsades de Pointes)?
Sources: Goldman-Cecil Medicine, Ch. 42 (Ganz & Link); Tietz Textbook of Laboratory Medicine, 7th Ed., Ch. 48; Harrison's Principles of Internal Medicine, 22nd Ed.
This is a shared conversation. Sign in to Orris to start your own chat.