ECG
Asking for Preferences
Reading File
Finding Sources
Searching Images
ECG electrocardiogram waves intervals normal interpretation
Finding Sources
Finding Sources
Reading File
Finding Sources
Reading File
Reading File
Reading File
Loading Image
Loading Image
Reading File
Loading Image
Reading File
I now have comprehensive content from Goldman-Cecil Medicine and Guyton & Hall for a full ECG overview. Let me compile this into a thorough response.
ECG — Electrocardiogram: A Complete Overview
What Is the ECG?
The electrocardiogram (ECG/EKG) is a recording of the electrical activity of the heart from electrodes placed on the body surface. It captures depolarization and repolarization of cardiac muscle, providing a window into cardiac rhythm, conduction, structure, and ischemia.
The Cardiac Conduction System
Before reading an ECG, understand what generates the signals:
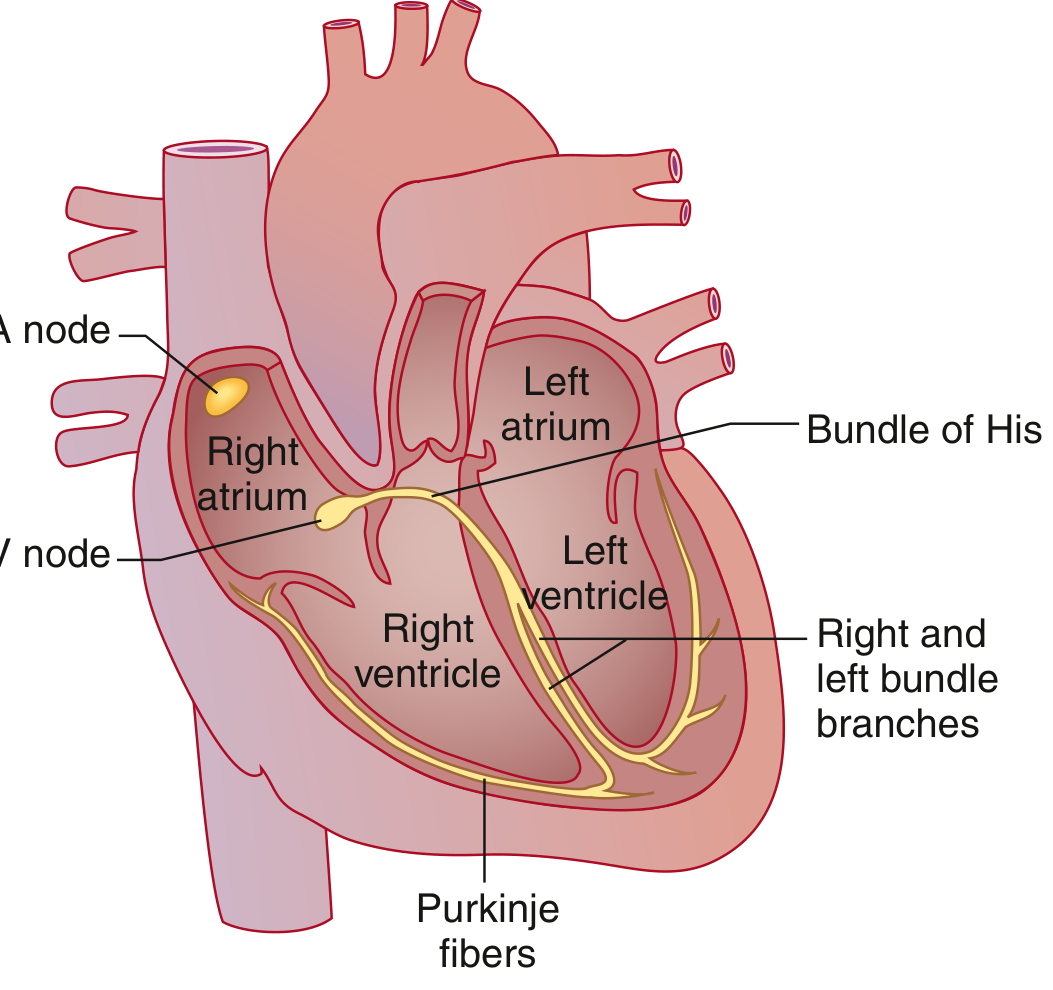
- SA node (high lateral right atrium near SVC) — dominant pacemaker, spontaneously depolarizes at the highest rate
- Bachmann bundle — speeds the wave to the left atrium
- AV node — the only electrical connection between atria and ventricles; physiologic conduction delay here
- Bundle of His → Right & Left bundle branches → Purkinje fibers — rapid spread to ventricular muscle
Goldman-Cecil Medicine, p. 421
ECG Waves and What They Represent
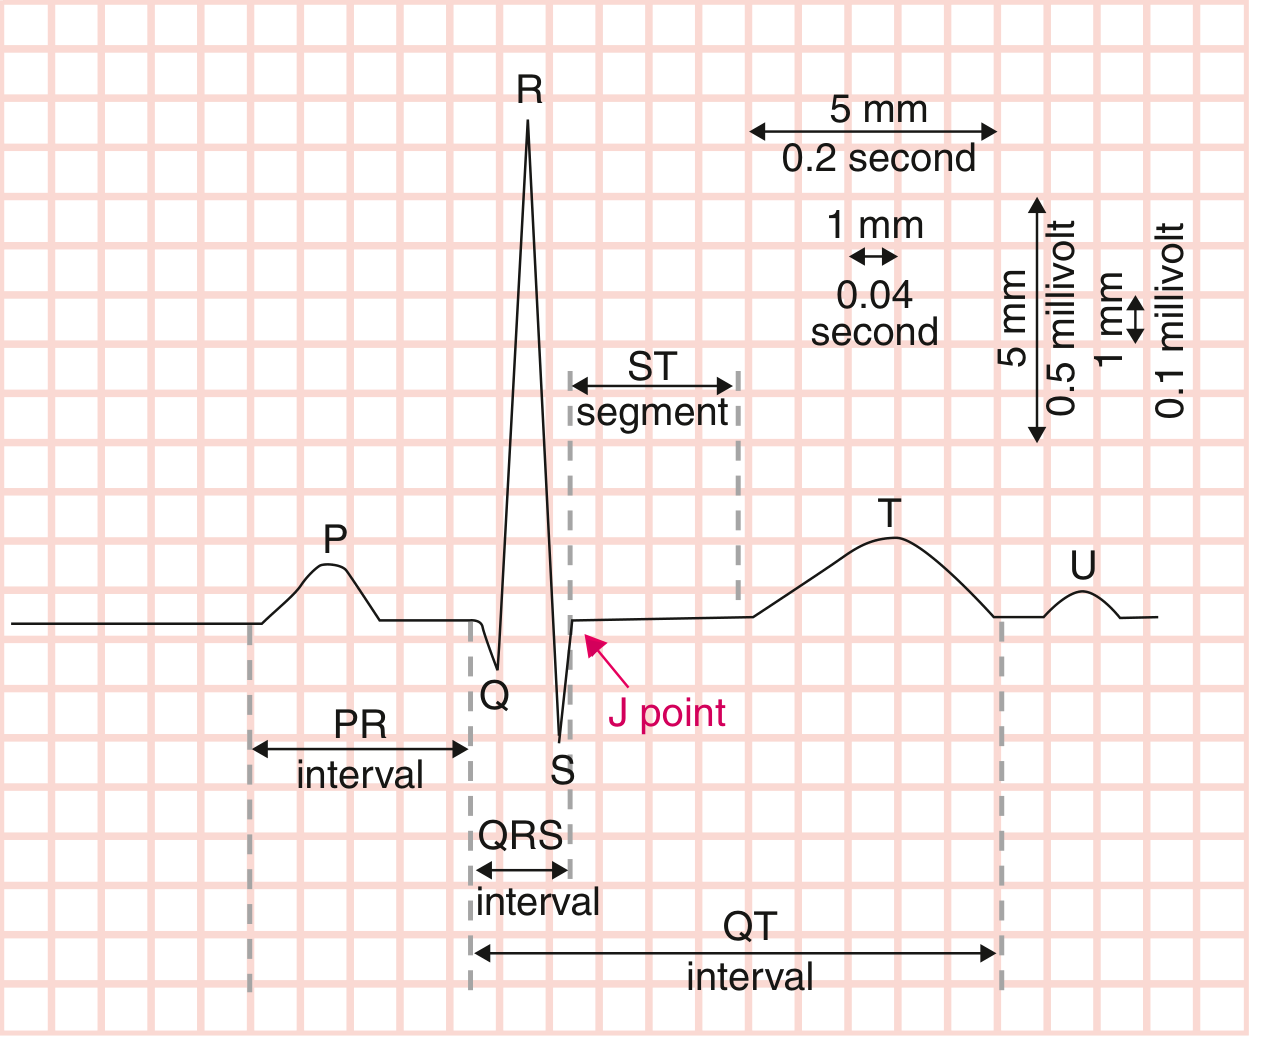
| Wave/Segment | Represents |
|---|---|
| P wave | Atrial muscular depolarization |
| PR interval | Conduction through atrial muscle, AV node, and His-Purkinje system |
| QRS complex | Ventricular muscular depolarization |
| J point | Junction between end of QRS and start of ST segment |
| ST segment | Early ventricular repolarization (isoelectric at baseline) |
| T wave | Ventricular repolarization |
| U wave | Small wave after T wave (origin debated; may represent repolarization of Purkinje fibers or papillary muscles) |
| QT interval | Total duration of ventricular depolarization + repolarization (QRS onset to T wave offset) |
The P wave and QRS are depolarization waves. The T wave is a repolarization wave. Because ventricular mass far exceeds atrial mass, the low-amplitude atrial repolarization wave is buried within the QRS and not visible on surface ECG.
Goldman-Cecil Medicine, p. 421; Guyton & Hall Medical Physiology, p. 143
Normal ECG Intervals (Table 42-1)
| Parameter | Normal Value |
|---|---|
| Heart rate | 50–100 bpm |
| P wave duration | < 0.12 sec (120 ms) |
| PR interval | 0.09–0.20 sec (90–200 ms) |
| QRS duration | 0.075–0.11 sec (75–110 ms) |
| QTc (males) | 390–450 ms |
| QTc (females) | 390–460 ms |
| QRS axis | −30° to +90° |
Goldman-Cecil Medicine, Table 42-1
ECG Paper & Speed
- Standard recording speed: 25 mm/sec
- Small box (1 mm) = 0.04 sec (40 ms) horizontally; 0.1 mV vertically
- Large box (5 mm) = 0.20 sec (200 ms) horizontally; 0.5 mV vertically
- Standard recording duration: 10 seconds (groups of leads I–III, aVR/aVL/aVF, V1–V3, V4–V6, each for 2.5 sec + rhythm strip)
Heart Rate Calculation
- Formula: HR = 60,000 ÷ RR interval (in ms)
- Quick method (regular rhythm): Count large boxes between consecutive R waves:
- 1 box = 300 bpm | 2 = 150 | 3 = 100 | 4 = 75 | 5 = 60 | 6 = 50
- For irregular rhythm (e.g., AF): Count QRS complexes in 10-second strip × 6
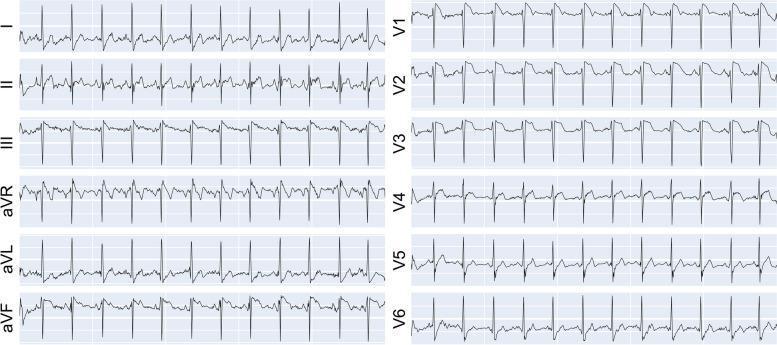
The 12 Leads
A standard ECG has 12 leads — 6 limb leads + 6 precordial leads:
| Limb Leads | View |
|---|---|
| I, II, III | Bipolar limb leads (Einthoven's triangle) |
| aVR, aVL, aVF | Augmented unipolar limb leads |
| Precordial Leads | Position |
|---|---|
| V1 | 4th intercostal space, right sternal border |
| V2 | 4th intercostal space, left sternal border |
| V3 | Between V2 and V4 |
| V4 | 5th intercostal space, midclavicular line |
| V5 | Anterior axillary line (same level as V4) |
| V6 | Midaxillary line (same level as V4/V5) |
Normal R-wave progression: V1 has a small R and deep S → progressively taller R wave → by V5/V6, predominantly positive. The transition point (where R amplitude first exceeds S) is normally at V3 or V4.
Normal 12-Lead ECG
Electrical Axis
- Normal frontal plane axis: −30° to +90°
- Left axis deviation (LAD): < −30° (seen in LBBB, left anterior fascicular block, inferior MI)
- Right axis deviation (RAD): > +90° (seen in RVH, RBBB, left posterior fascicular block, PE)
- Quick rule: If QRS is mainly positive in both leads I and II → axis is normal
Systematic Approach to ECG Interpretation
Use a stepwise approach to avoid missing findings:
- Rate — Calculate from RR interval
- Rhythm — Regular or irregular? P before every QRS?
- P waves — Present, morphology, upright in I and II?
- PR interval — Short (<120 ms → pre-excitation), prolonged (>200 ms → 1st degree AV block)?
- QRS duration — Narrow (<110 ms) or wide (≥120 ms → BBB, paced, WPW, hyperkalemia)?
- Axis — Normal, LAD, or RAD?
- ST segments — Elevation (injury/STEMI), depression (ischemia/NSTEMI)?
- T waves — Upright, inverted, peaked (hyperkalemia)?
- QT interval — Prolonged (drugs, electrolytes, congenital LQTS)?
- Compare to prior ECG if available
Goldman-Cecil Medicine, p. 424
Key Pathological Patterns at a Glance
| Finding | Classic Cause |
|---|---|
| ST elevation | STEMI, Prinzmetal angina, pericarditis, LBBB |
| ST depression | NSTEMI/UA, LVH strain, digoxin effect |
| Pathological Q wave | Prior MI (width ≥ 40 ms, depth ≥ 25% of R) |
| Wide QRS (≥120 ms) | LBBB, RBBB, WPW, paced rhythm, hyperkalemia |
| Prolonged QTc | Drugs (amiodarone, antipsychotics, antibiotics), hypokalemia, hypomagnesemia, congenital LQTS |
| Delta wave + short PR | Wolff-Parkinson-White syndrome |
| J (Osborn) wave | Hypothermia, hypercalcemia |
| Peaked T waves | Hyperkalemia |
| Diffuse saddle-shaped ST elevation | Pericarditis |
Want to go deeper on any specific topic — arrhythmias, bundle branch blocks, STEMI localisation, axis deviation, or a specific clinical scenario?
This is a shared conversation. Sign in to Orris to start your own chat.