
from Guyton and Hall textbook of medical physiology, 4th South Asia edition, write a 5-mark short note on Mechanism of Ovulation,Contraception-rhythm method
LH surge ovulation follicle rupture mechanism diagram Guyton
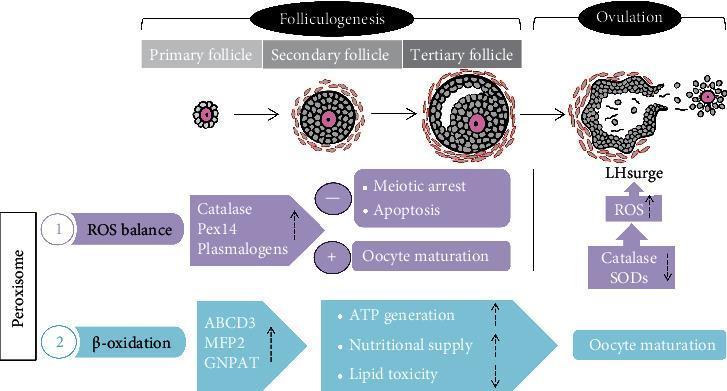
This pathophysiology diagram illustrates peroxisomal regulation during folliculogenesis and ovulation. The top sequence depicts morphological follicle progression from a primary follicle through a secondary follicle to a tertiary follicle (showing antrum formation), culminating in a preovulatory follicle and LH surge-triggered ovulation. The diagram outlines two primary peroxisomal pathways: 1) ROS balance, where upregulation of Catalase, Pex14, and plasmalogens promotes oocyte maturation while inhibiting meiotic arrest and apoptosis; and 2) β-oxidation, where upregulation of ABCD3, MFP2, and GNPAT increases ATP generation and nutritional supply while decreasing lipid toxicity to support oocyte maturation. During the ovulation phase, the schematic shows a shift characterized by the downregulation of Catalase and SODs, leading to an increase in Reactive Oxygen Species (ROS) levels. Key educational concepts include the role of peroxisomes in metabolic support, antioxidant defense, and the transition of oxidative states required for successful oocyte release.
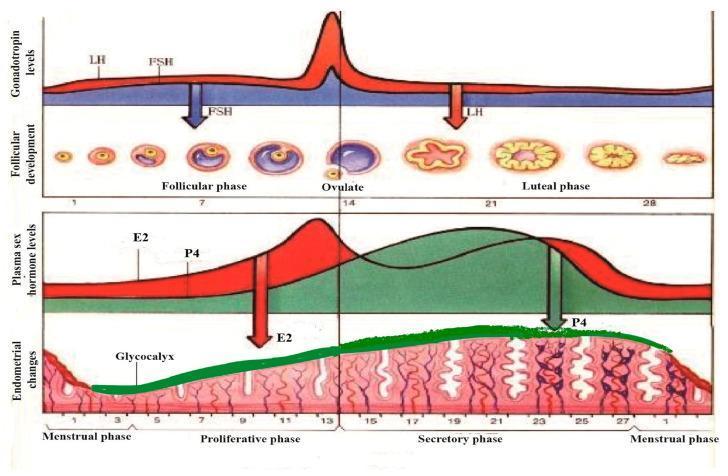
A multi-panel pathophysiology diagram illustrating the synchronous physiological changes during a standard 28-day human menstrual cycle. The top panel graphs gonadotropin levels, showing a sharp surge in Luteinizing Hormone (LH) and a moderate rise in Follicle-Stimulating Hormone (FSH) at day 14, correlating with the follicular phase, ovulation, and luteal phase stages. The corresponding follicular development shows the maturation of a primary follicle into a Graafian follicle, ovulation, and the formation of the corpus luteum and corpus albicans. The middle panel tracks plasma sex hormone levels, highlighting the mid-cycle peak of Estradiol (E2) and the post-ovulatory rise of Progesterone (P4). The bottom panel depicts endometrial morphology, transitioning from the menstrual phase to the proliferative and secretory phases. A green-shaded layer highlights the glycocalyx development, which thickens and becomes most prominent during the secretory phase under the influence of P4, before thinning during menstruation. The diagram demonstrates the hormonal regulation of the ovary and uterine lining for medical educational purposes.
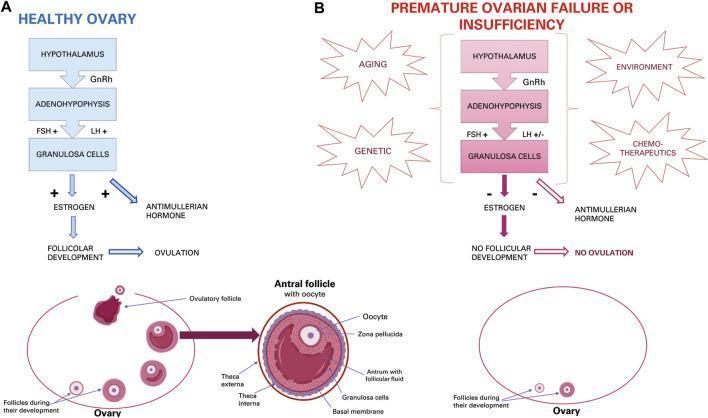
A medical pathophysiology diagram comparing a healthy ovary (Panel A) with premature ovarian failure/insufficiency (POI/POF) (Panel B). Panel A illustrates the normal hypothalamic-pituitary-ovarian axis: GnRH stimulates the adenohypophysis to release FSH and LH, promoting granulosa cell activity. This results in the secretion of estrogen and anti-Mullerian hormone (AMH), leading to sequential follicular development and ovulation. Below, an anatomical illustration shows an ovary with multiple follicles at various stages, including a detailed cross-section of an antral follicle highlighting the oocyte, zona pellucida, antrum, granulosa cells, basal membrane, and theca layers (interna and externa). Panel B depicts the impact of aging, genetics, environment, and chemotherapeutics on this axis. It shows disrupted signaling with negative regulation of estrogen and AMH, culminating in 'no follicular development' and 'no ovulation.' The corresponding ovary diagram shows a depleted ovarian reserve with significantly fewer follicles compared to the healthy state. This comparison highlights the hormonal dysregulation and cellular depletion characteristic of premature reproductive senescence.
Short Note: Mechanism of Ovulation and Contraception - Rhythm Method
Mechanism of Ovulation
Sequence of Events
- The theca externa releases proteolytic enzymes from lysosomes, causing dissolution and weakening of the follicular capsular wall - leading to follicle swelling and degeneration of the stigma.
- Rapid new blood vessel growth into the follicle wall occurs, while prostaglandins (vasodilatory local hormones) are secreted into follicular tissues.
Contraception - Rhythm Method
Basis
- The ovum remains viable for fertilization for no longer than 24 hours after ovulation.
- Sperm can remain fertile in the female reproductive tract for up to 5 days.
- Therefore, the fertile window spans approximately 4-5 days before ovulation up to a few hours after ovulation.
How the Method Works
| Cycle Length | Calculated Day of Ovulation |
|---|---|
| 28 days | ~Day 14 |
| 40 days | ~Day 26 |
| 21 days | ~Day 7 |
Limitation
| Feature | Detail |
|---|---|
| Time of ovulation | Day 14 (28-day cycle) |
| LH surge timing | 16 hours before ovulation |
| LH rise magnitude | 6-10 fold |
| Enzymes involved | Proteolytic enzymes from lysosomes |
| Local hormones | Prostaglandins (vasodilation) |
| Fertile window | ~4-5 days |
| Rhythm method abstinence period | 4 days before + 3 days after ovulation |
| Failure rate (rhythm method) | 20-25% per year |