
Explain true action potential of cardiac cell.
Reading File
Finding Sources
Finding Sources
Searching PubMed
"cardiac action potential"
Searching the Web
cardiac ventricular myocyte action potential phases 0 1 2 3 4 physiology
Reading File
Reading File
True action potential of a cardiac cell
The true action potential refers to the fast-response action potential of working cardiac muscle cells:
- Atrial muscle cells
- Ventricular muscle cells
- His-Purkinje fibres
It has a stable resting membrane potential and five phases: 0 to 4. This differs from the SA and AV nodal pacemaker action potential, which has no true stable resting potential.
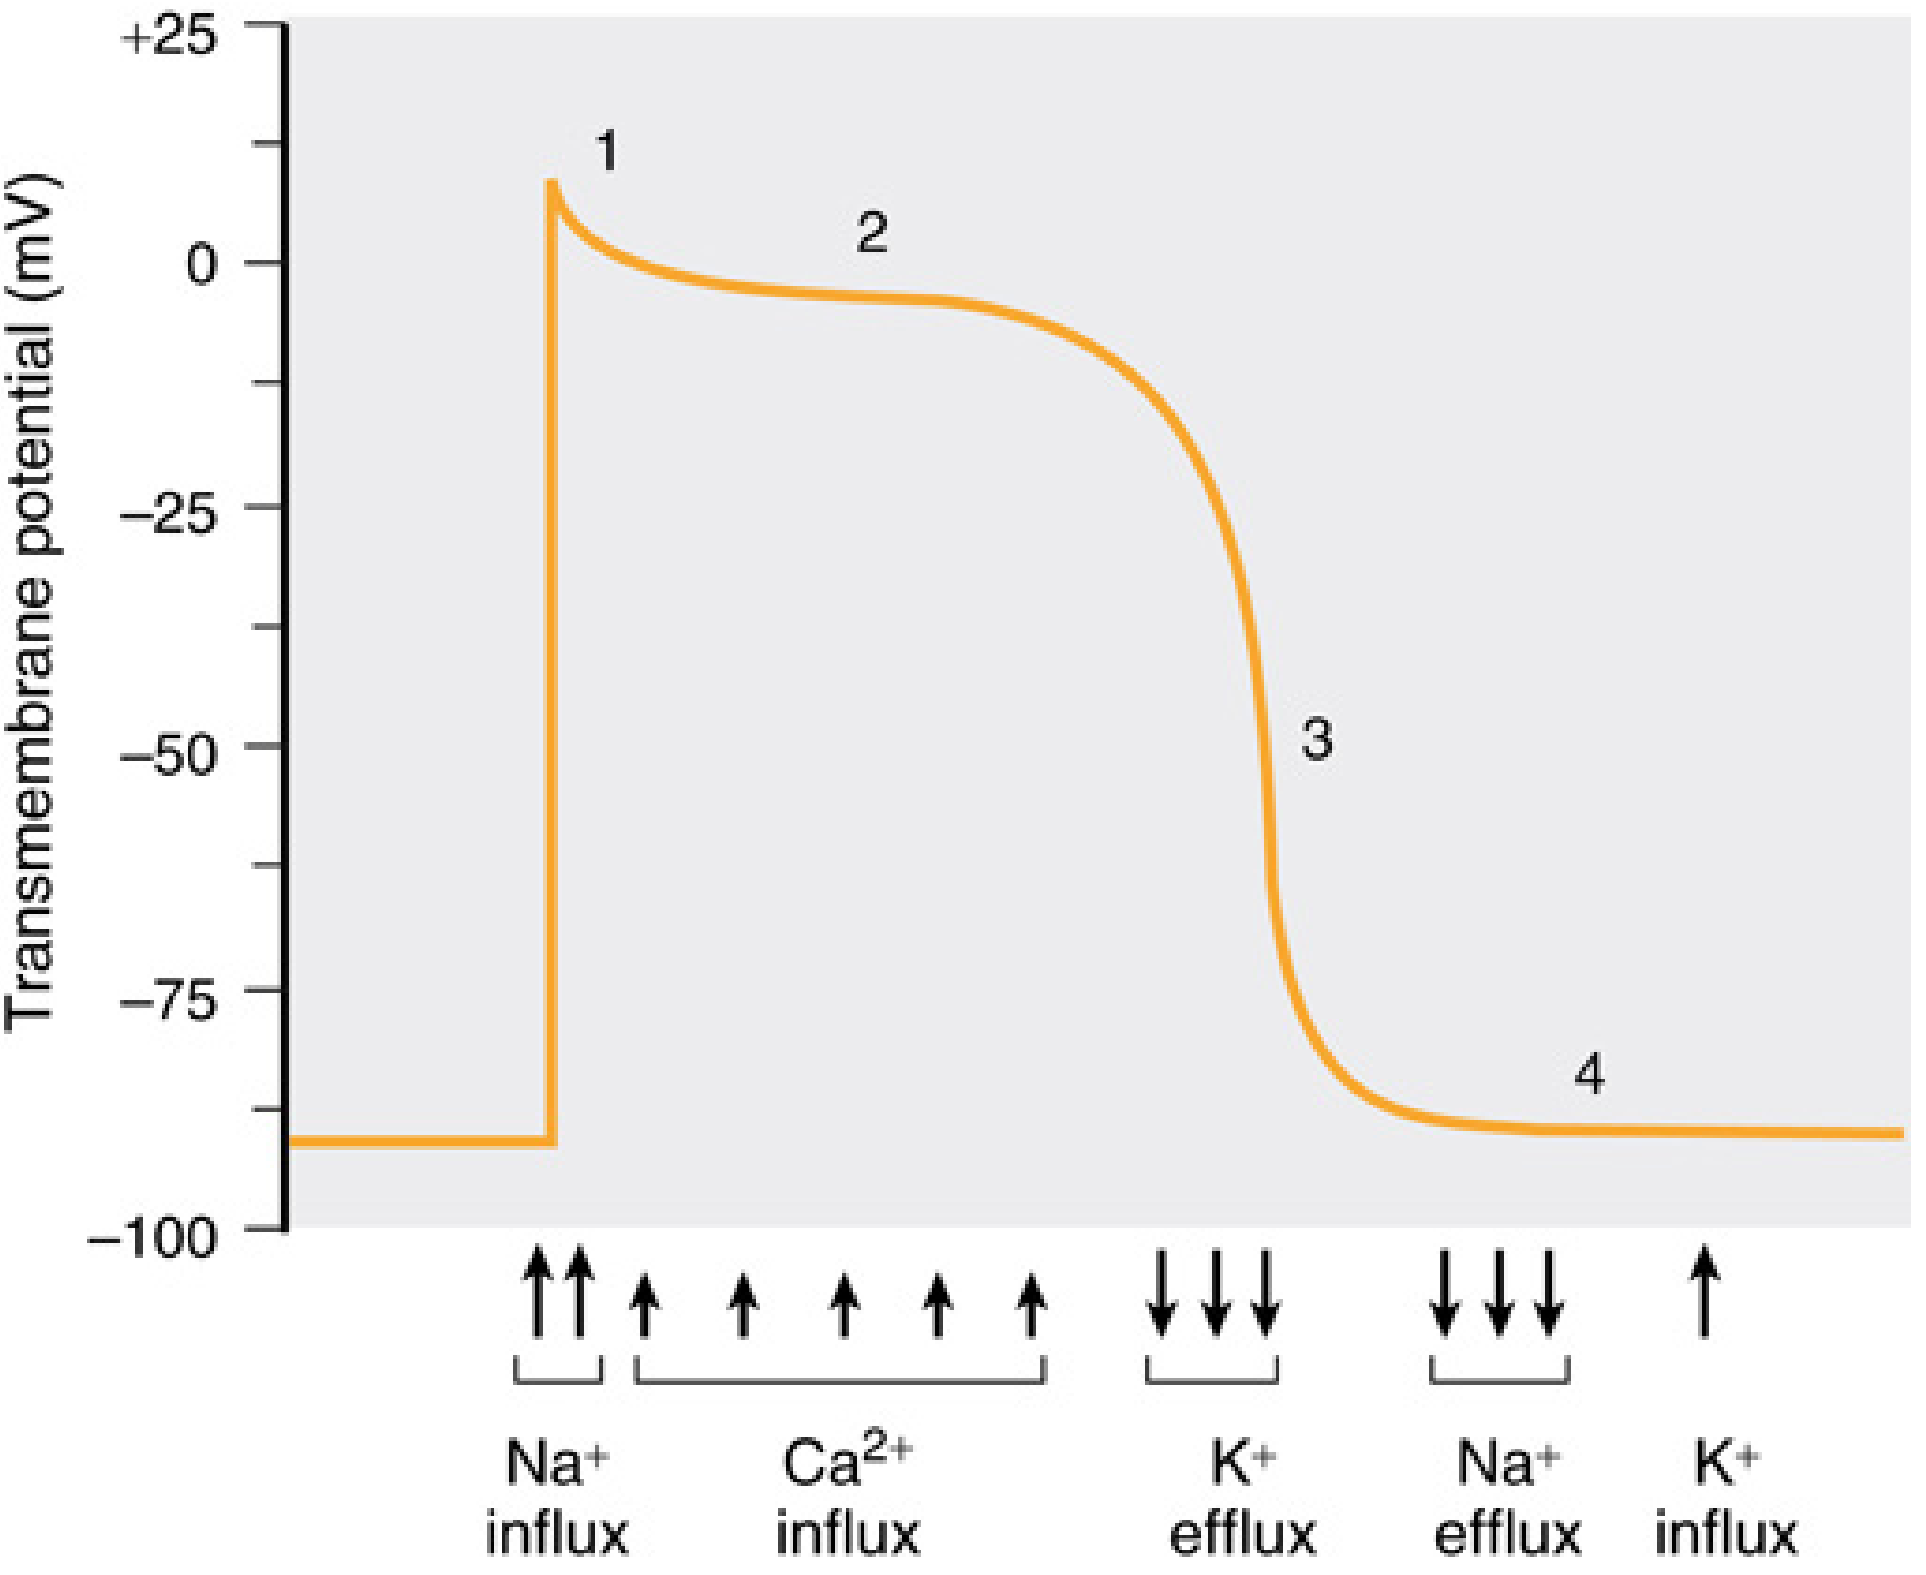
Phase 4: Resting membrane potential
- Membrane potential is about -90 mV in ventricular muscle.
- The membrane is predominantly permeable to K⁺ through inward-rectifier K⁺ channels, so K⁺ conductance maintains the negative intracellular voltage.
- This phase is stable. Working myocytes do not spontaneously depolarize.
- The Na⁺/K⁺-ATPase maintains the Na⁺ and K⁺ concentration gradients; the Na⁺-Ca²⁺ exchanger helps remove intracellular Ca²⁺.
Phase 0: Rapid depolarization
- An impulse from an adjacent cell brings the membrane to threshold.
- Fast voltage-gated Na⁺ channels open.
- There is a rapid inward Na⁺ current (INa), causing a steep rise in membrane potential and an overshoot to positive values.
- The steepness of phase 0 determines conduction velocity in atrial, ventricular, and Purkinje tissue.
- Class I antiarrhythmic drugs decrease this phase by blocking fast Na⁺ channels.
Phase 1: Initial rapid repolarization
- Fast Na⁺ channels become inactivated.
- A brief outward K⁺ current, mainly the transient outward current, Ito, produces a small fall in membrane voltage.
- This creates the notch just after the phase 0 spike.
Phase 2: Plateau phase
- L-type Ca²⁺ channels open, allowing Ca²⁺ to enter the cell.
- At the same time, K⁺ continues to leave through K⁺ channels.
- The inward Ca²⁺ current and outward K⁺ current are approximately balanced, producing a prolonged plateau near 0 mV.
- Entering Ca²⁺ triggers further Ca²⁺ release from the sarcoplasmic reticulum, initiating cardiac muscle contraction.
- The plateau makes the cardiac action potential much longer than that of skeletal muscle and prevents tetany.
Phase 3: Rapid repolarization
- L-type Ca²⁺ channels close or inactivate.
- Outward K⁺ currents increase, especially delayed rectifier K⁺ currents and inward-rectifier K⁺ current.
- K⁺ efflux predominates, returning the membrane potential toward -90 mV.
- As the membrane repolarizes, Na⁺ channels recover from inactivation and can eventually be activated again.
Refractory periods
The long action potential causes a long refractory period:
- Absolute/effective refractory period: from phase 0 through much of phase 3. A second propagated action potential cannot be generated.
- Relative refractory period: late phase 3. A stronger-than-normal stimulus may generate an action potential.
This prevents summation and tetanic contraction, ensuring that the heart alternates between contraction and relaxation so it can fill with blood.
One-line summary
Fast Na⁺ entry causes phase 0, transient K⁺ exit causes phase 1, Ca²⁺ entry balanced by K⁺ exit produces phase 2, K⁺ exit causes phase 3, and K⁺ permeability maintains the stable phase 4 resting potential.
Source: Miller's Anesthesia, 10th ed., pp. 1397-1399.
Explain how ECG waves relate to cardiac action potentials
Reading File
Finding Sources
Finding Sources
Searching Images
diagram electrocardiogram ECG P wave QRS complex T wave related to ventricular action potential phases
Searching PubMed
electrocardiography AND cardiac action potential
Searching the Web
ECG P wave QRS T wave relationship cardiac action potential ventricular action potential phases
Reading File
Reading File
Reading File
An ECG is not a recording of the action potential of one cardiac cell. It records the changing net electrical vector produced as depolarization and repolarization spread across large areas of atrial and ventricular myocardium.
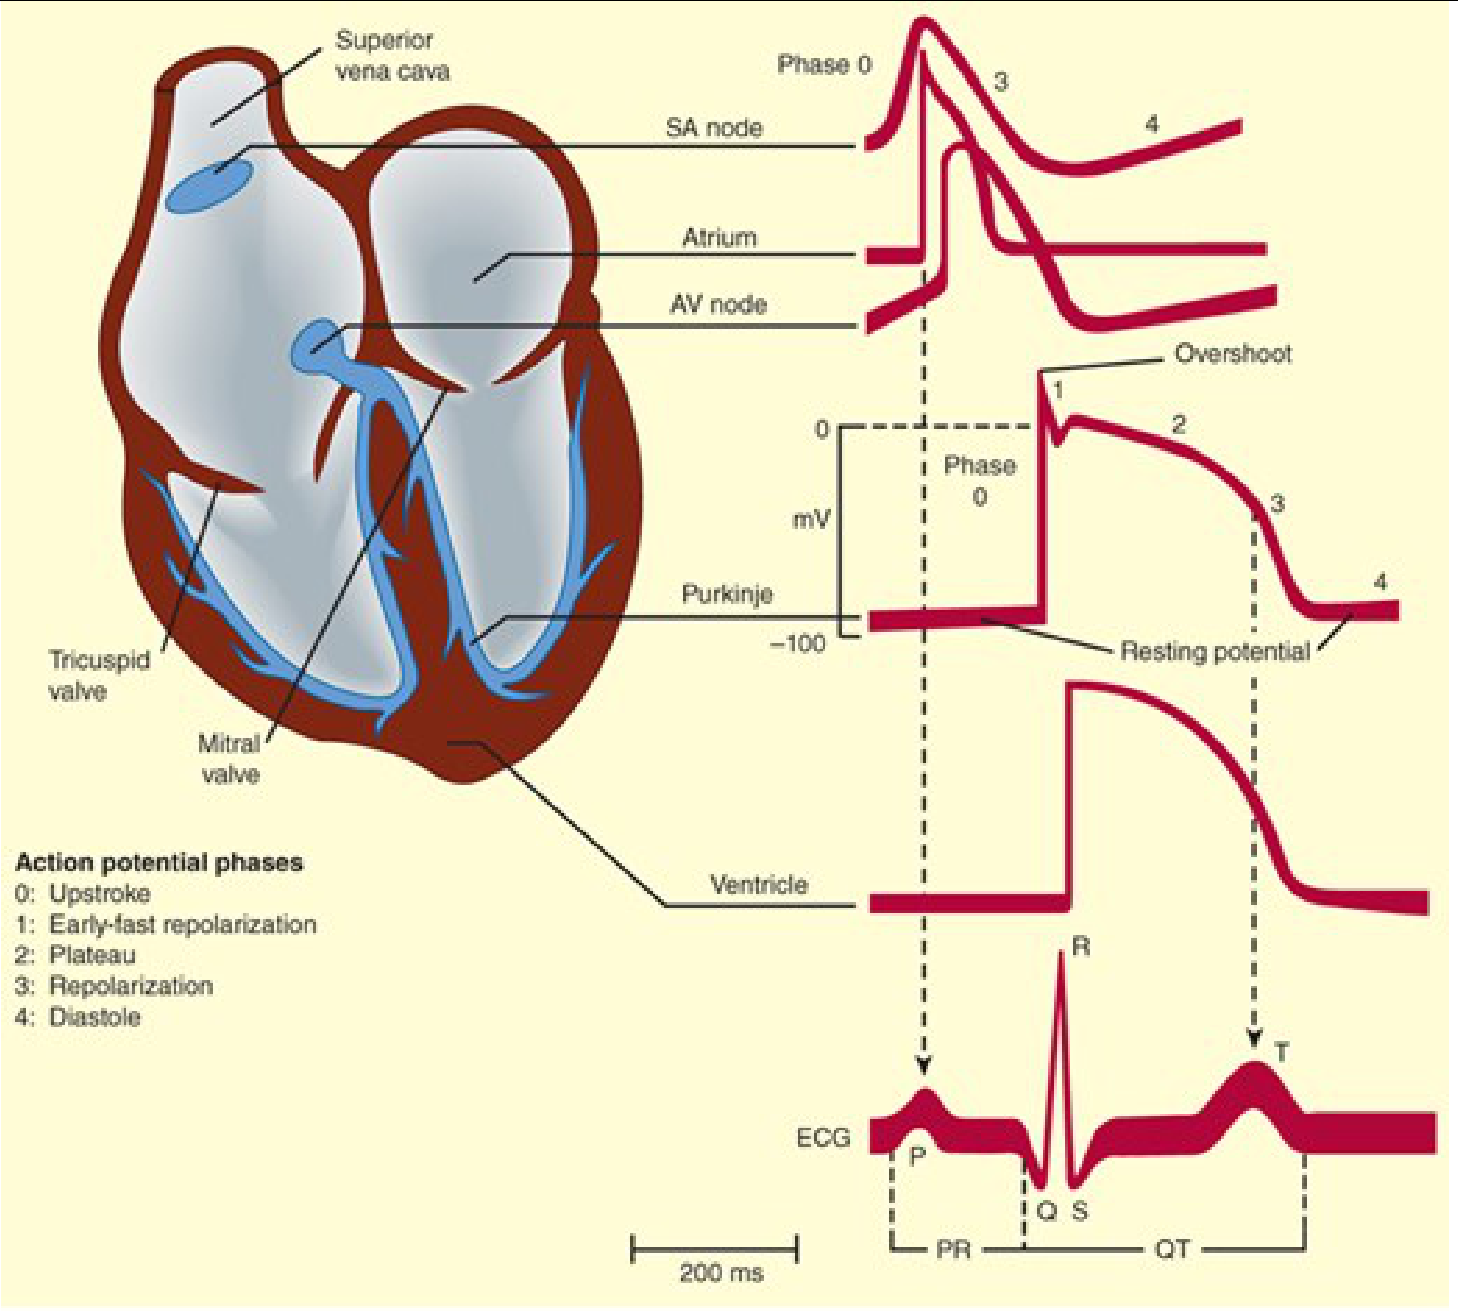
Relation between ECG and action potentials
| ECG component | Electrical event in the heart | Corresponding cellular action-potential event |
|---|---|---|
| P wave | Atrial depolarization | Phase 0 of atrial myocytes |
| PR segment / PR interval | Impulse travels through atria, then is delayed in AV node before ventricular activation | AV nodal slow-response action potential and conduction delay |
| QRS complex | Ventricular depolarization | Phase 0 of ventricular myocytes, caused by rapid Na⁺ influx |
| ST segment | Ventricles are uniformly depolarized | Mainly phase 2 plateau of ventricular action potential |
| T wave | Ventricular repolarization | Mainly phase 3, dominated by K⁺ efflux |
| QT interval | Total time of ventricular electrical systole | From onset of ventricular phase 0 to completion of phase 3 |
| TP segment | Electrical diastole | Ventricular phase 4 resting membrane potential |
Step-by-step sequence
1. P wave: atrial depolarization
The SA node initiates an impulse that spreads through both atria. As atrial muscle cells undergo phase 0 depolarization, the moving electrical wave creates the P wave.
Atrial contraction follows shortly after the P wave begins.
2. PR interval: atrial-to-ventricular conduction
The PR interval extends from the start of the P wave to the start of QRS. It includes:
- Atrial depolarization
- Conduction through the AV node
- Passage through the His bundle and bundle branches
The AV node conducts slowly, producing the delay that permits atrial contraction to complete ventricular filling before ventricular contraction.
3. QRS complex: ventricular depolarization
The QRS complex represents rapid spread of depolarization through ventricular muscle. At the cellular level, this is phase 0 of the ventricular fast-response action potential, caused primarily by rapid Na⁺ entry.
QRS is much larger than the P wave because ventricular muscle mass is much greater than atrial muscle mass.
Atrial repolarization occurs around this time but is usually hidden within the larger QRS complex.
4. ST segment: ventricular plateau
During the ST segment, nearly all ventricular cells are depolarized. Their action potentials are largely in phase 2, the plateau phase, when inward Ca²⁺ current is balanced by outward K⁺ current.
Because there is little voltage difference between regions when the ventricles are uniformly depolarized, the ST segment is normally nearly isoelectric.
5. T wave: ventricular repolarization
The T wave reflects ventricular recovery, mainly phase 3 repolarization of ventricular action potentials. K⁺ leaves ventricular cells, returning their membrane potential toward the resting value.
Although repolarization is electrically opposite to depolarization, the normal T wave is often upright in leads where the QRS is upright. This is because ventricular repolarization normally proceeds in an overall direction opposite to depolarization, and the combination of opposite process plus opposite direction produces a positive deflection.
6. QT interval: ventricular action-potential duration
The QT interval, from the start of QRS to the end of the T wave, approximates the duration of the overall ventricular action potential:
- Begins with ventricular phase 0
- Includes phases 1 and 2
- Ends when phase 3 repolarization is complete
It is therefore a measure of ventricular electrical systole. QT shortens as heart rate rises, so it is commonly interpreted using the corrected QT, or QTc.
Important distinction
- ECG waves appear while an electrical wave is moving across myocardium.
- When all cells in a region are in approximately the same electrical state, there is no net surface voltage difference, so the tracing becomes flat.
Thus:
- Uniform ventricular depolarization gives the ST segment.
- Uniform ventricular resting state gives the TP segment.
The P wave reflects atrial depolarization, QRS ventricular depolarization, and T wave ventricular repolarization. The PR interval reflects atrioventricular conduction time, while the QT interval reflects the duration of the ventricular action potential. Medical Physiology, p. 730; Guyton and Hall Textbook of Medical Physiology, pp. 577-583.
Explain Goldberg Central Terminal in ECG.
Reading File
Finding Sources
Finding Sources
Searching Images
Goldberger central terminal ECG augmented unipolar limb leads aVR aVL aVF diagram
Searching PubMed
electrocardiography AND augmented limb leads
Searching the Web
Goldberger central terminal ECG augmented unipolar limb leads aVR aVL aVF
Reading File
Reading File
Finding Sources
The correct term is Goldberger terminal, also called the Goldberger central terminal. It is used to produce the augmented unipolar limb leads: aVR, aVL, and aVF.
It is distinct from the Wilson central terminal, which is used as the reference for the precordial chest leads V1 to V6.
Basic principle
An ECG lead records a voltage difference between:
- an exploring positive electrode, and
- a reference negative electrode.
For Goldberger leads, one limb electrode is the positive exploring electrode, while the other two limb electrodes are joined to form the reference.
| Lead | Positive exploring electrode | Reference electrode |
|---|---|---|
| aVR | Right arm (RA) | Average of left arm + left leg |
| aVL | Left arm (LA) | Average of right arm + left leg |
| aVF | Left leg/foot (LL) | Average of right arm + left arm |
Mathematically:
[
aVR = RA - \frac{LA + LL}{2}
]
[
aVL = LA - \frac{RA + LL}{2}
]
[
aVF = LL - \frac{RA + LA}{2}
]
The right-leg electrode is a ground/reference for safety and noise reduction, and does not form these diagnostic leads.
Why is it called “augmented”?
Goldberger modified the original unipolar limb-lead system by disconnecting the exploring limb from the reference network.
- In the older Wilson unipolar limb lead, the reference includes all three limb electrodes, including the exploring limb.
- In Goldberger’s method, the reference contains only the other two limbs.
- This makes the recorded voltage approximately 50% larger, without changing the waveform’s shape.
Hence:
- a = augmented
- V = voltage
- R = right arm
- L = left arm
- F = foot, clinically the left-leg electrode
Relation to Wilson central terminal
Wilson central terminal
Created by connecting RA, LA, and LL via equal high resistances:
[
WCT = \frac{RA + LA + LL}{3}
]
It approximates an electrically indifferent reference point and is used for the chest leads:
[
V_1 \text{ to } V_6 = \text{chest electrode} - WCT
]
Goldberger terminal
For each augmented lead, use only the two non-exploring limbs as the reference. For example, in aVF:
[
aVF = LL - \frac{RA + LA}{2}
]
Thus, Goldberger leads are not truly unipolar in a strict physical sense. They are better understood as augmented unipolar limb leads.
Clinical viewpoint directions
The augmented leads view the heart in the frontal plane:
- aVR: looks from the right shoulder, approximately -150°
- aVL: looks from the left shoulder, approximately -30°
- aVF: looks from below, toward the feet, +90°
Together with leads I, II, and III, they form the six frontal-plane limb leads used for cardiac-axis assessment and localization of abnormalities.
High-yield summary
Goldberger terminal = average potential of the two limb electrodes other than the exploring electrode.
It generates aVR, aVL, and aVF and increases their voltage by about 50% compared with the original unipolar limb leads.
The augmented limb-lead arrangement connects two limbs to the negative terminal and the remaining limb to the positive terminal: right arm for aVR, left arm for aVL, and left leg for aVF. Guyton and Hall Textbook of Medical Physiology, pp. 147-148. The reference for Wilson chest leads combines right arm, left arm, and left-leg potentials through equal resistances. Ganong's Review of Medical Physiology, p. 526.
This is a shared conversation. Sign in to Orris to start your own chat.