
Levine theory of dental caries
Levine theory dental caries ecological plaque hypothesis
Levine triad dental caries diagram host microflora substrate time
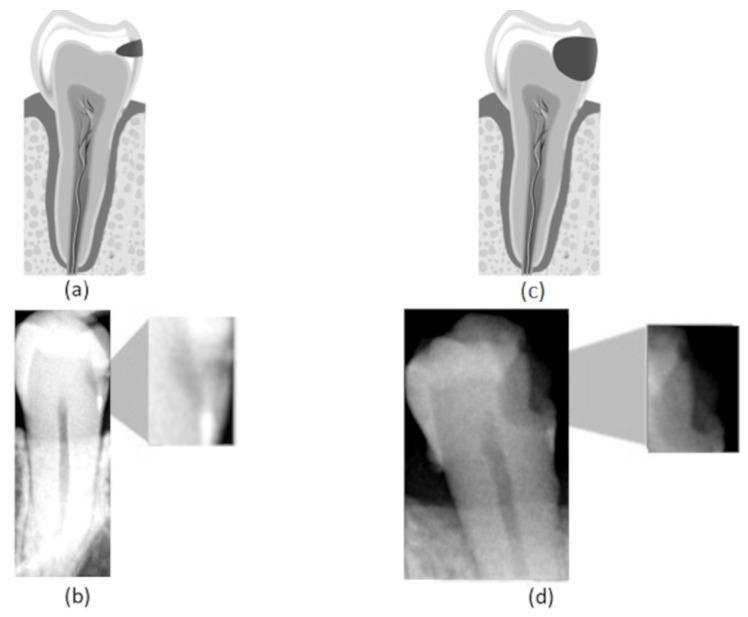
A multi-panel educational graphic illustrating dental caries progression through anatomical diagrams and diagnostic imaging. Panel (a) presents a cross-sectional anatomical diagram of a tooth showing an incipient caries lesion, depicted as a small dark area confined to the proximal enamel. Panel (b) shows a corresponding bitewing radiograph with an inset magnification, identifying a subtle radiolucency at the enamel surface, representing early-stage demineralization. Panel (c) is a diagram of an advanced caries lesion, showing a large dark area that has penetrated through the enamel and deeply into the dentin, approaching the pulp chamber. Panel (d) displays a clinical bitewing radiograph of an advanced lesion, where a significant, diffuse radiolucent area indicates extensive structural loss extending beyond the dentinoenamel junction. The composite image serves as a comparison chart for dental diagnostic training, highlighting the correlation between schematic disease models and radiological findings for both incipient and advanced interproximal caries.
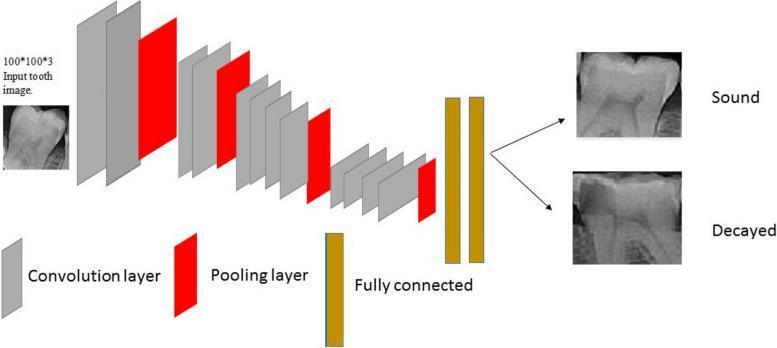
This diagram illustrates a deep learning architecture for dental diagnostic imaging, specifically a VGG18 convolutional neural network (CNN) optimized for caries detection. The workflow begins with an input dental radiograph (bitewing or periapical) resized to a 100x100x3 pixel array. The process transitions through a series of hierarchical layers represented by color-coded blocks: grey blocks signify convolution layers for feature extraction (e.g., detecting edges and textures of enamel and dentin), while red blocks represent max-pooling layers for spatial dimensionality reduction. The network architecture culminates in two yellow rectangular blocks representing fully connected layers that integrate high-level features for classification. The final output is a binary classification illustrated by radiographic images of teeth labeled 'Sound' (healthy tooth structure) or 'Decayed' (exhibiting radiolucent areas indicative of dental caries). This visualization demonstrates the application of artificial intelligence in oral and maxillofacial radiology for automated pathology detection.
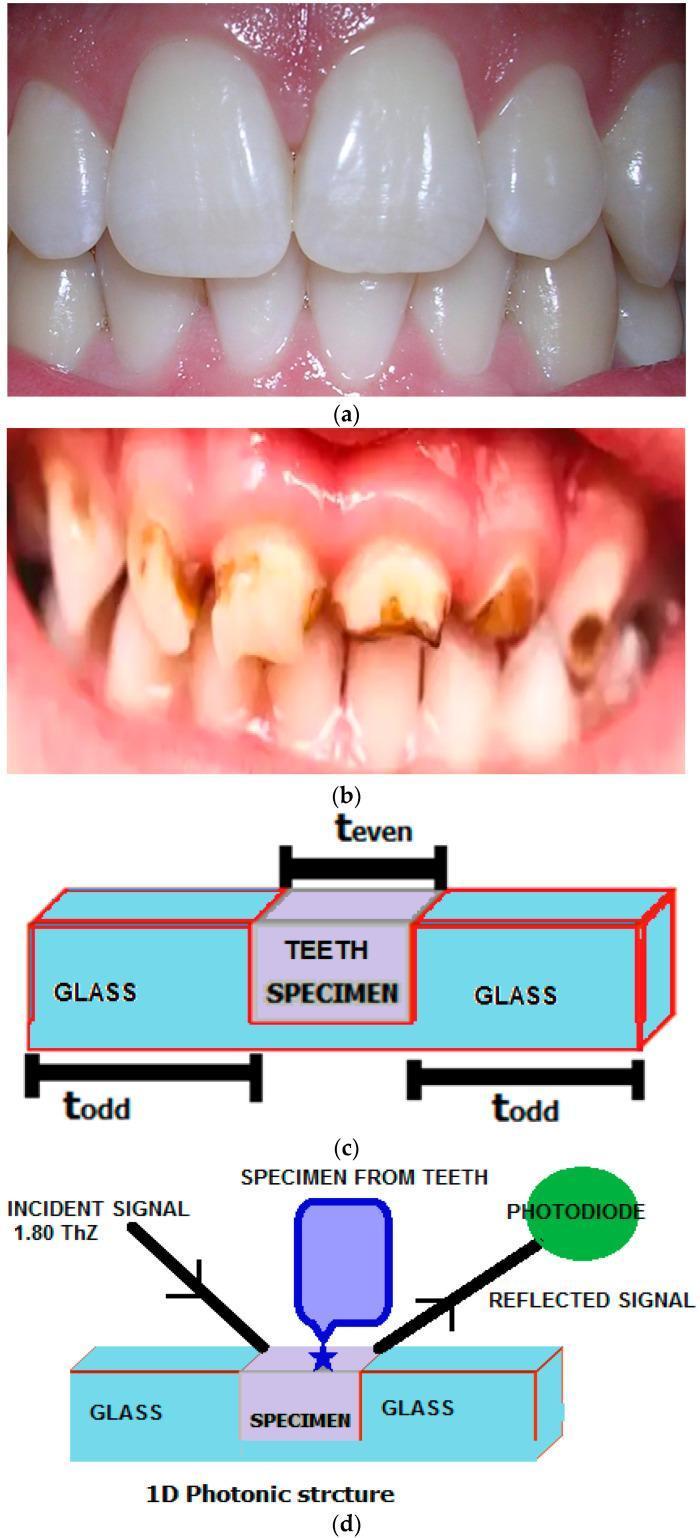
This composite educational graphic illustrates clinical and experimental aspects of dental caries. (a) A clinical photograph displays healthy permanent dentition with intact enamel, smooth white surfaces, and healthy gingival tissue. (b) A comparative clinical photograph shows abnormal teeth characterized by extensive dental caries; visible signs include significant dark brown discoloration, enamel cavitation, and irregular surface morphology across multiple anterior teeth, accompanied by gingival inflammation. (c) A schematic diagram represents a one-dimensional (1D) photonic crystal structure used for diagnostic analysis, consisting of a sandwich arrangement: two outer glass layers and a central 3 μm tooth specimen layer (enamel or dentine). (d) An experimental algorithm flowchart depicts the measurement process using an incident 1.80 THz signal. The signal interacts with the multilayered photonic structure, and the resulting reflected signal is captured by a photodiode. This setup is designed to evaluate the refractive index and reflectance of dental tissues, correlating physical optical properties with the presence and severity of tooth decay.
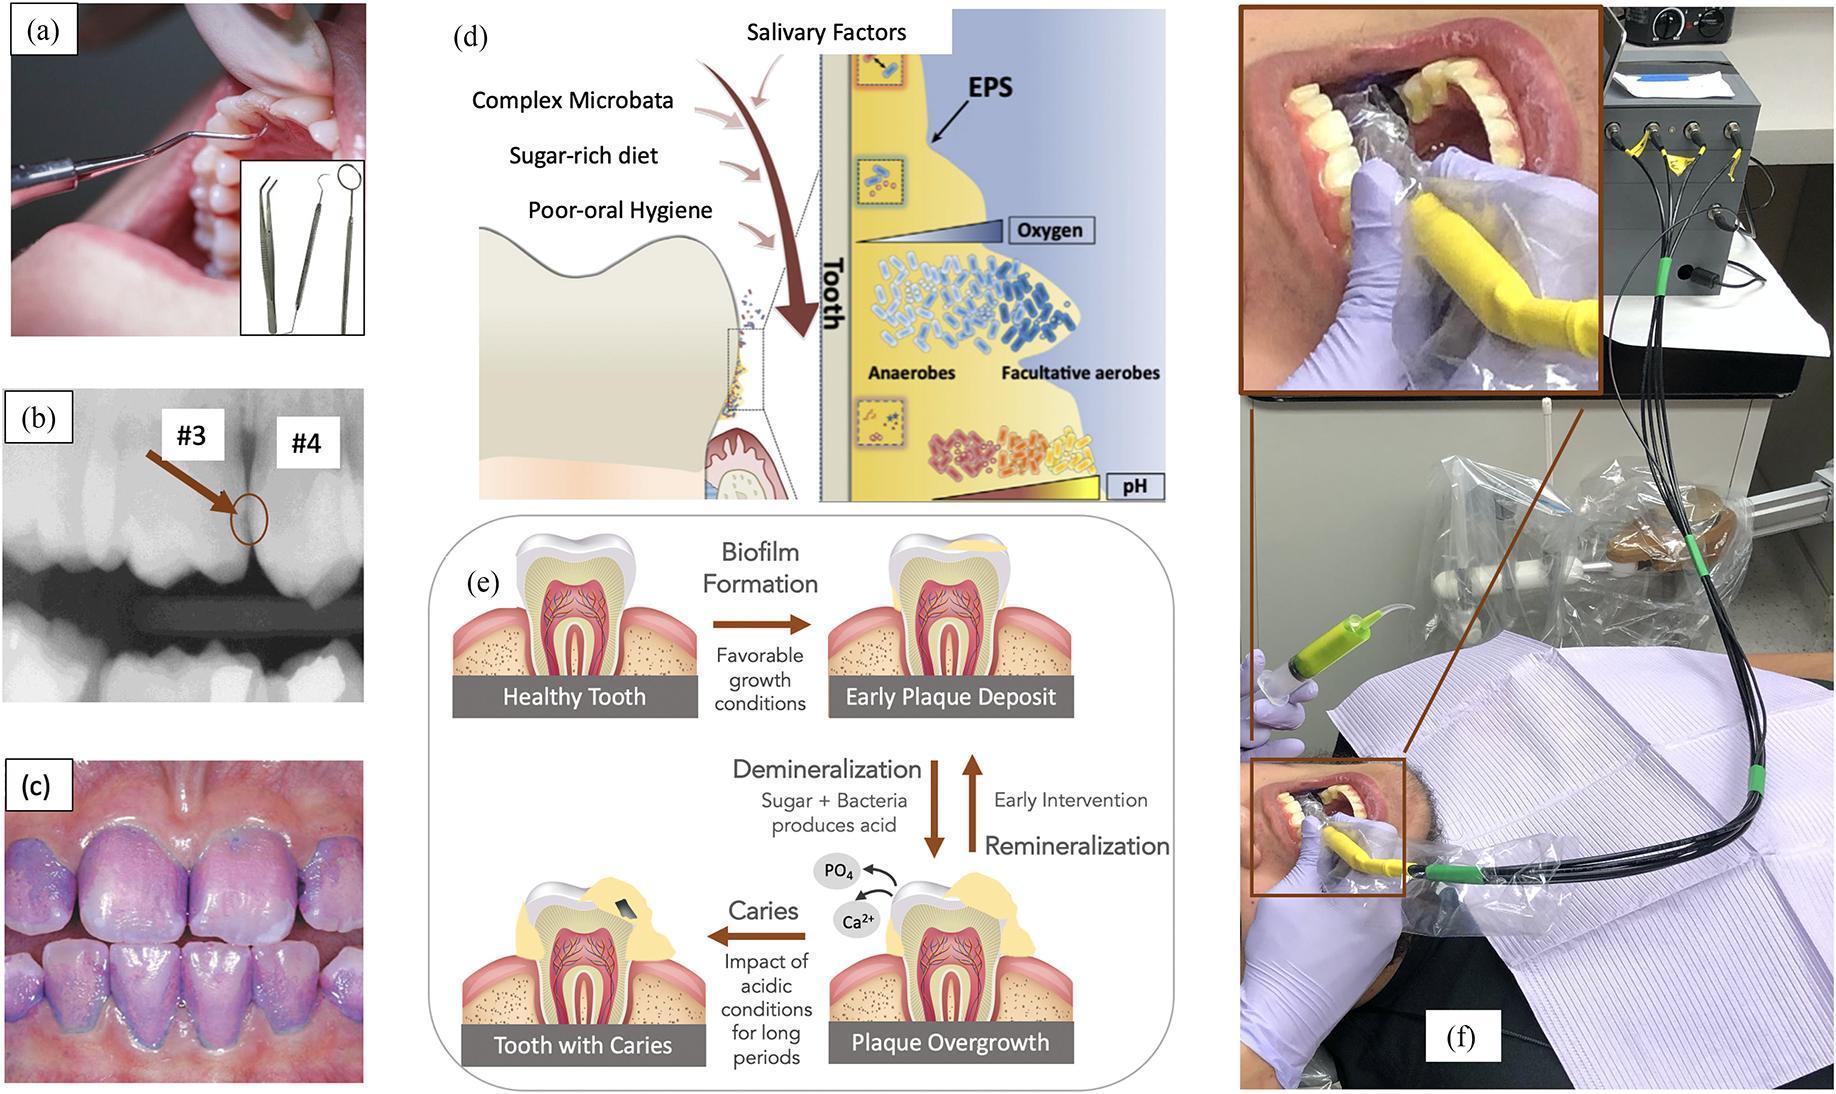
This composite educational graphic illustrates the diagnosis and pathophysiology of dental caries and biofilm. (a) Intraoral clinical photograph showing visual assessment of occlusal surfaces using a dental probe. (b) Bitewing radiograph demonstrating a radiolucent interproximal lesion between teeth #3 and #4. (c) Clinical photograph showing dental plaque visualized with a purple-pink disclosing agent, emphasizing accumulation at gingival margins. (d) Pathophysiology diagram of the biofilm micro-environment, highlighting the Extracellular Polymeric Substance (EPS) matrix, oxygen gradients, and the transition from facultative aerobes to anaerobes as pH decreases near the enamel. (e) Flowchart depicting the progression from a healthy tooth to early plaque deposit, demineralization (loss of Ca2+ and PO4 due to acid production), and finally carious cavitation. It notes the reversible nature of early lesions via remineralization and intervention. (f) Clinical demonstration of an O-pH optical sensor probe used to measure biofilm acidity in real-time. This material is designed for dental education, focusing on the interplay between oral hygiene, sugar-rich diets, and bacterial acidification in cariogenesis.
https://pmc.ncbi.nlm.nih.gov/articles/PMC4100321
Keyes triad dental caries Venn diagram overlapping circles host bacteria substrate

Summary : This image shows a sequence of four circular shapes, with the middle two pairs overlapping to form a "double-circle" or "Venn diagram" style appearance. The circles transition in color from green to blue. logo: Colour Sequence : • Four circles arranged horizontally in a row. • First circle: solid light green. • Second and third circles: each formed by two overlapping circles, creating a "double-circle" or "Venn diagram" effect. – Second pair: cyan/turquoise. – Third pair: blue. • Fourth circle: solid dark blue. Design Details : • All circles are of equal size. • Overlapping pairs are centered so that the intersection is symmetrical. • No text, company name, or tagline is visible. Analysis : • The sequence suggests a progression or transformation from green to blue, possibly representing stages, connectivity, or blending. • The use of overlapping circles may imply collaboration, integration, or transition.
Summary : This figure presents a Venn diagram estimating the number and overlap of United States patients eligible for coronary artery calcium (CAC) scans and lung scans, with explicit population counts and overlap details. venn diagram: # Groups & Counts : • Large yellow circle: "33 million CAC scan eligible". • Smaller green circle: "7 million lung scan eligible". • Overlapping region (not numerically labeled in the diagram, but described in the caption): 6.6 million lung scan patients also eligible for CAC scanning. # Design Encodings : • Yellow circle represents CAC scan eligibility. • Green circle represents lung scan eligibility. • Overlap visually indicated by intersection of circles. • Text labels inside each circle specify population counts. # Caption Details : • 33 million patients in the US estimated eligible for CAC scanning. • 7 million patients estimated eligible for lung scanning. • Excluding lung scan eligible patients with established coronary disease (5.3%), the overlap is 6.6 million lung scan patients who would benefit from CAC scanning. # Analysis : • The majority of CAC scan eligible patients are not eligible for lung scans. • Most lung scan eligible patients (6.6 out of 7 million) are also eligible for CAC scanning, indicating substantial overlap. • The diagram visually emphasizes the much larger population eligible for CAC scans compared to lung scans, with a significant intersection.
This medical infographic illustrates the therapeutic applications of nanotechnology in oral health, specifically focusing on the delivery of functional nanoparticles (NPs) to treat common dental conditions. The anatomical diagram shows several teeth affected by caries, gingival inflammation, and hypersensitivity. A legend identifies five key components: periodontal bacteria (red rod-shaped clusters), cariogenic bacteria (green chain-like structures), antimicrobial NPs (purple circles), remineralizing NPs (yellow circles), and anti-inflammatory NPs (pink circles). Curved arrows depict the targeted delivery pathways: 1) Antimicrobial and remineralizing NPs are directed toward an occlusal caries lesion on a molar. 2) Anti-inflammatory and antimicrobial NPs target gingival inflammation at the interproximal gumline, where cariogenic bacteria are localized. 3) Remineralizing NPs are directed toward the cervical region of a premolar to address dentin hypersensitivity. This educational visualization demonstrates how specialized nanomaterials can be used in restorative and periodontal treatments to counteract bacterial pathogens and promote tissue healing and remineralization.
Educational diagram of Levine's modified theory of dental caries showing four overlapping circles labeled: Host (tooth anatomy, saliva, immune response), Microorganisms (Streptococcus mutans, Lactobacillus, plaque biofilm), Substrate (fermentable carbohydrates, sucrose, diet), and a large surrounding arrow or envelope labeled TIME. The intersection of Host, Microorganisms, and Substrate circles is labeled CARIES. Clean medical illustration style with clear labels.
Levine's Theory of Dental Caries
Background and Context
- Host (susceptible tooth)
- Microorganisms (cariogenic bacteria)
- Substrate (dietary fermentable carbohydrates)
Levine's Modification (1977)
Caries = Host + Microorganisms + Substrate, all acting together over time
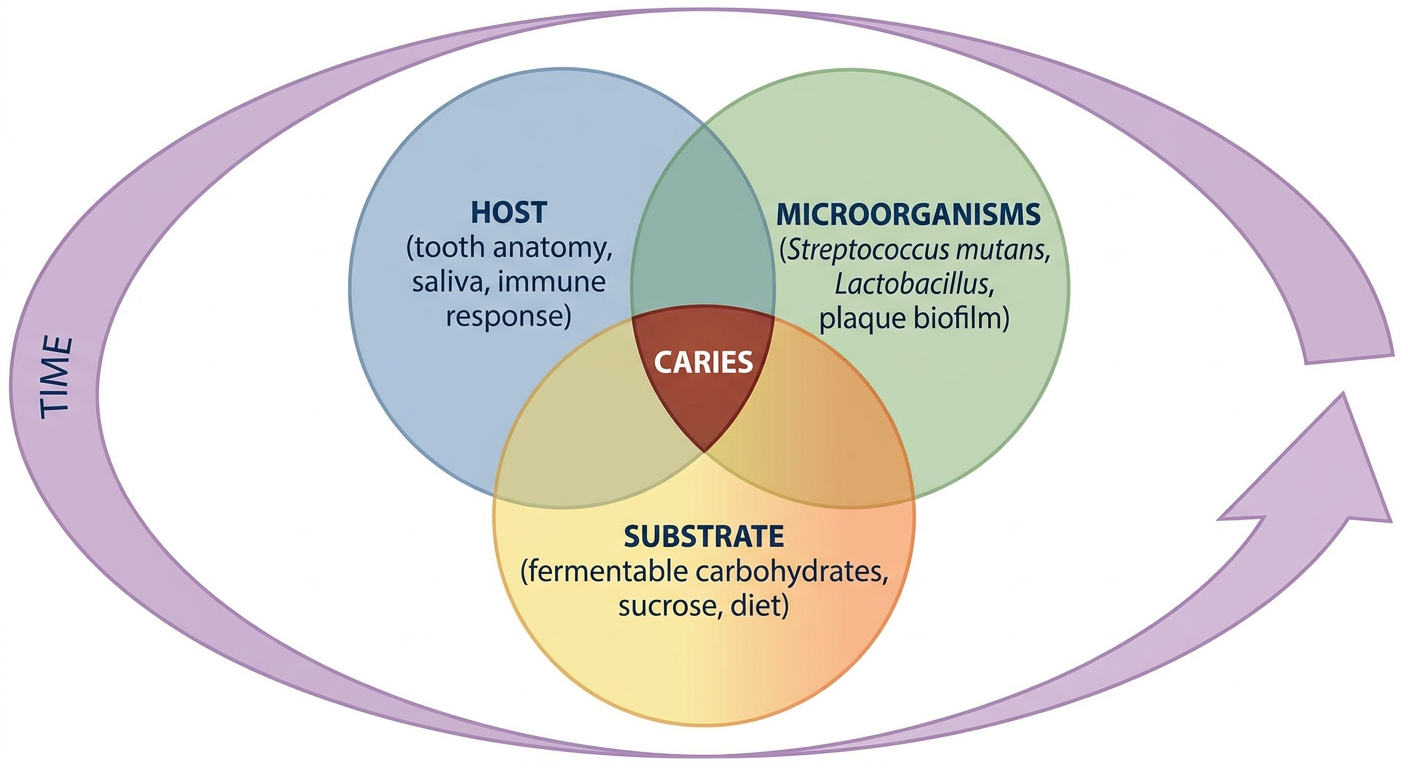
The Four Factors in Detail
1. Host (Tooth and Saliva)
| Host Factor | Caries-Promoting | Caries-Protective |
|---|---|---|
| Tooth morphology | Deep pits and fissures, crowded teeth | Well-aligned, smooth surfaces |
| Enamel composition | Hypomineralized enamel | Fluoride-rich enamel (fluorapatite) |
| Saliva - flow | Xerostomia (reduced flow) | High salivary flow (mechanical cleansing) |
| Saliva - buffering | Low buffering capacity | Good bicarbonate buffering (neutralizes acid) |
| Saliva - antibacterial | Deficient IgA | Lysozyme, lactoferrin, sIgA |
| Saliva - remineralization | Low calcium/phosphate | Rich calcium and phosphate ions |
2. Microorganisms (Cariogenic Plaque)
-
Streptococcus mutans is the principal cariogenic species. It is uniquely suited to cause caries because:
- It metabolizes sucrose via glucosyltransferases to produce insoluble glucan polymers (structural scaffold of plaque)
- It produces lactic acid as the primary end-product of fermentation, driving pH below 5.5
- It tolerates acidic environments better than commensal streptococci (aciduricity/acidogenicity)
- It adheres strongly to smooth enamel surfaces
-
Lactobacillus species (L. acidophilus, L. casei) play a role especially in dentinal caries progression and in individuals with high sucrose intake.
-
Actinomyces species are associated with root caries.
3. Substrate (Diet)
-
Sucrose is the most cariogenic dietary carbohydrate because:
- S. mutans ferments it to produce lactic acid
- Sucrose is the substrate for glucan synthesis (structural matrix of plaque)
- Even small, frequent exposures cause repeated pH drops
-
Other cariogenic substrates: glucose, fructose, cooked starch (naturally occurring sugars in fruit are also cariogenic, though slightly less so than refined sucrose)
-
Frequency matters more than quantity: Frequent snacking between meals keeps plaque pH below 5.5 for prolonged periods, preventing remineralization. This is the basis of Stephan's curve - pH drops within 2-3 minutes of sugar exposure and takes 20-30 minutes to recover.
-
Non-cariogenic or protective foods: cheese, xylitol (inhibits S. mutans), fibrous vegetables (stimulate salivary flow)
4. Time
- Prolonged bottle feeding at night is so destructive (continuous acid exposure, low salivary flow during sleep)
- Frequent snacking keeps pH suppressed, preventing recovery
- Early intervention (fluoride, dietary advice) can reverse white spot lesions
The Disease Process (Integrated View)
Comparison: Keyes vs. Levine
| Feature | Keyes Triad (1960) | Levine Modification (1977) |
|---|---|---|
| Factors | 3 (host, microorganism, substrate) | 4 (adds time) |
| Diagram | 3 overlapping circles | 3 circles + outer TIME ring |
| Emphasis | Simultaneous co-existence of factors | Sustained interaction over time |
| Clinical implication | Eliminate one factor to prevent caries | Reduce duration/frequency of interaction |
| Preventive focus | Fluoride, plaque removal, diet | Frequency of sugar exposure, sleep hygiene, sustained fluoride use |
Clinical Relevance of Time (Preventive Applications)
- Reduce snacking frequency - fewer acid challenges per day
- Avoid nocturnal feeding - saliva flow is lowest during sleep, so acid exposure is prolonged
- Fluoride (topical) - accelerates remineralization during the recovery phase, shortening effective acid exposure time
- Xylitol - non-fermentable sugar substitute; also inhibits S. mutans growth
- Dental sealants - remove the host factor (pits and fissures) from the equation
- Fissure sealants in children - interrupts the time × host susceptibility interaction
Summary
- Host (tooth morphology + saliva)
- Microorganisms (S. mutans-dominated cariogenic plaque)
- Substrate (fermentable carbohydrates, especially sucrose)
- Time (duration and frequency of the interaction of the above three)
- Scott-Brown's Otorhinolaryngology Head & Neck Surgery, Table 42.1 (Factors in dental caries)
- Jawetz, Melnick & Adelberg's Medical Microbiology, 28th ed., pp. 181-182 (Dental plaque biofilm and S. mutans)
- Park's Textbook of Preventive and Social Medicine (Dental caries - WHO definition and public health context)
Levine theory of dental caries
Levine 1977 theory dental caries four factors time host microorganism substrate
https://pocketdentistry.com/15-dental-caries
Medical educational diagram titled "Levine's Ionic See-saw Theory of Dental Caries (1977)". Show a see-saw/balance scale with two sides: LEFT side labeled "Demineralization" with arrows showing Ca2+, PO4 and H+ ions moving OUT of enamel into plaque, and factors listed: Low pH, Acid from bacteria, Low fluoride, Low calcium/phosphate. RIGHT side labeled "Remineralization" with arrows showing Ca2+, PO4 ions moving INTO enamel from saliva/plaque, and factors listed: High pH, Saliva buffering, Fluoride, High calcium/phosphate. In the MIDDLE: a tooth cross-section showing the enamel-plaque interface. Below the balance: label "Net Demineralization = Caries" when left side tips down, and "Net Remineralization = Protection" when right side tips down. Clean clinical illustration style, white background, blue and red color coding for demineralization and remineralization respectively.
Levine's Theory of Dental Caries - Ionic See-saw Theory (1977)
What the Theory States
Minerals (calcium, phosphate ions) are constantly exchanged between enamel and plaque. If over any given interval of time more ions leave the enamel than enter it, the net result is demineralization - and this marks the beginning of the carious process.
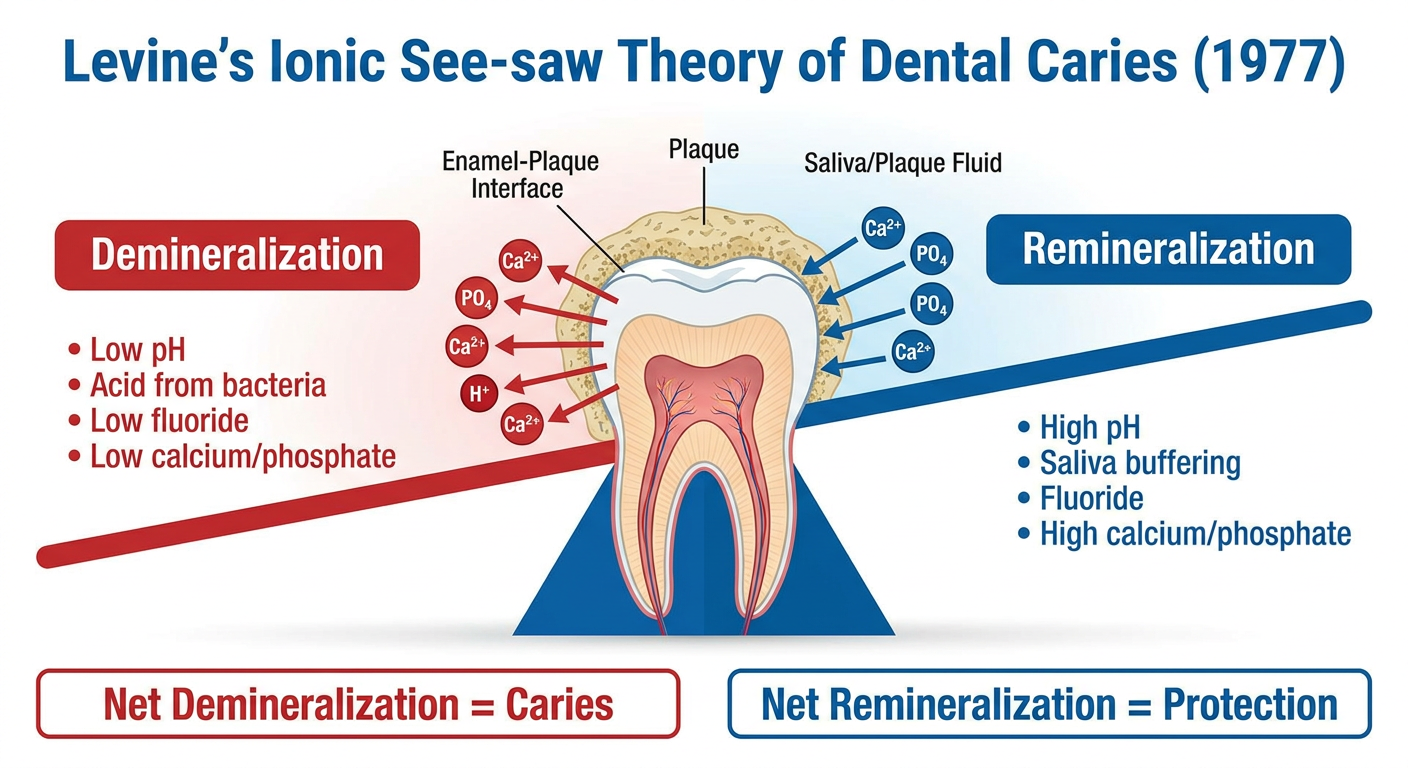
The Ionic See-saw Mechanism
Side 1: Demineralization (ions leave enamel)
- Low plaque pH (below 5.5 for enamel, the "critical pH")
- High acid production (S. mutans fermenting sucrose)
- Low fluoride concentration
- Low salivary calcium and phosphate
Side 2: Remineralization (ions re-enter enamel)
- Restored/neutral pH (above 5.5)
- High salivary flow (supplies Ca²⁺, PO₄³⁻, buffers)
- Fluoride - when present, fluorapatite (Ca₁₀(PO₄)₆F₂) forms instead of hydroxyapatite; fluorapatite is far more acid-resistant and less soluble
- Adequate salivary calcium and phosphate concentration
Key Variables the Theory Emphasizes
| Factor | Demineralization favored | Remineralization favored |
|---|---|---|
| Plaque pH | Low (< 5.5) | High (> 5.5) |
| Ca²⁺ / PO₄³⁻ concentration | Low (ions leaving enamel) | High (ions available to re-enter) |
| Fluoride ion concentration | Absent/low | Present - forms fluorapatite, which is more acid-resistant |
Stephan Curve - The See-saw in Action
- On sugar intake, plaque bacteria produce acid → pH drops within 2-3 minutes to below the critical pH (5.5)
- This triggers demineralization (ions leaving enamel)
- Over the next 20-40 minutes, saliva buffers the acid, pH gradually recovers above 5.5
- During recovery, remineralization occurs
- With frequent sugar intake, the pH stays suppressed - the see-saw is chronically tipped toward demineralization, and cumulative mineral loss leads to a white spot lesion, then cavitation
Levine's Theory vs. the Four-Factor Model
| Theory | Author | Year | Key Concept |
|---|---|---|---|
| Acidogenic theory (chemico-parasitic) | W.D. Miller | 1882 | Bacteria + carbs → acid → enamel dissolution |
| Keyes' triad | Paul Keyes | 1960 | Three-circle model: Host + Microorganism + Substrate |
| Ionic See-saw Theory | R.S. Levine | 1977 | Dynamic demineralization-remineralization equilibrium at enamel-plaque interface |
| Newburn's tetrad | Newburn | 1982 | Four-circle model: adds Time to Keyes' triad |
| Ecological Plaque Hypothesis | P.D. Marsh | 1994 | Dysbiosis of oral microbiome drives caries |
Clinical and Preventive Significance
-
Fluoride is the single most effective intervention because it shifts the equilibrium toward remineralization - fluorapatite requires a much lower pH (4.5) to dissolve than hydroxyapatite (5.5), giving the enamel greater acid resistance.
-
Reducing sugar frequency (not just quantity) keeps plaque pH above critical longer - less time for demineralization, more time for recovery.
-
Stimulating saliva flow (chewing sugar-free gum) raises Ca²⁺, PO₄³⁻, and bicarbonate, actively promoting remineralization.
-
Early (white spot) lesions are reversible - since no cavitation exists yet, shifting the see-saw back toward remineralization with fluoride + diet change can fully repair the lesion. This is the scientific basis for non-operative/preventive management of incipient caries.
-
Casein phosphopeptide-amorphous calcium phosphate (CPP-ACP) products (e.g., GC Tooth Mousse) work by directly supplying Ca²⁺ and PO₄³⁻ to the plaque environment, pushing the see-saw toward remineralization.