
Ecg made easy
Reading File
This is a broad medical/visual topic. Let me search the library for ECG content and run a parallel web search.
Finding Sources
Searching the Web
ECG interpretation made easy basics waves intervals clinical guide
Good. Let me pull the ECG content from Miller's Anesthesia and also search for more specific ECG topics in the library.
Reading File
Finding Sources
Excellent! Great hits. Let me pull the detailed ECG waveform content from Guyton & Hall and Harrison's in parallel, plus the cardiac cycle diagram.
Reading File
Reading File
Loading Image
Great content. Now let me fetch the cardiac conduction diagram from Harrison's and pull more ECG interval data.
Loading Image
Reading File
Let me fetch the ECG waveforms diagram and get more content on ECG leads and interpretation.
Loading Image
Reading File
I now have excellent textbook material, diagrams, and waveform images. Let me read a bit more on the systematic approach to interpretation, ST segment, and axis.
Reading File
I now have comprehensive material to write a thorough ECG guide. Let me compose the full answer.
ECG Made Easy - A Complete Guide
What is an ECG?
An electrocardiogram (ECG) is a recording of the electrical activity of the heart at the body surface. When a cardiac impulse passes through the heart, electrical current spreads into surrounding tissues and all the way to the skin. Electrodes placed on opposite sides of the heart detect these potential differences and trace them as waveforms on graph paper. - Guyton and Hall Textbook of Medical Physiology
Step 1 - The Conduction System (What generates the ECG)
Before reading the tracing, understand what produces it:
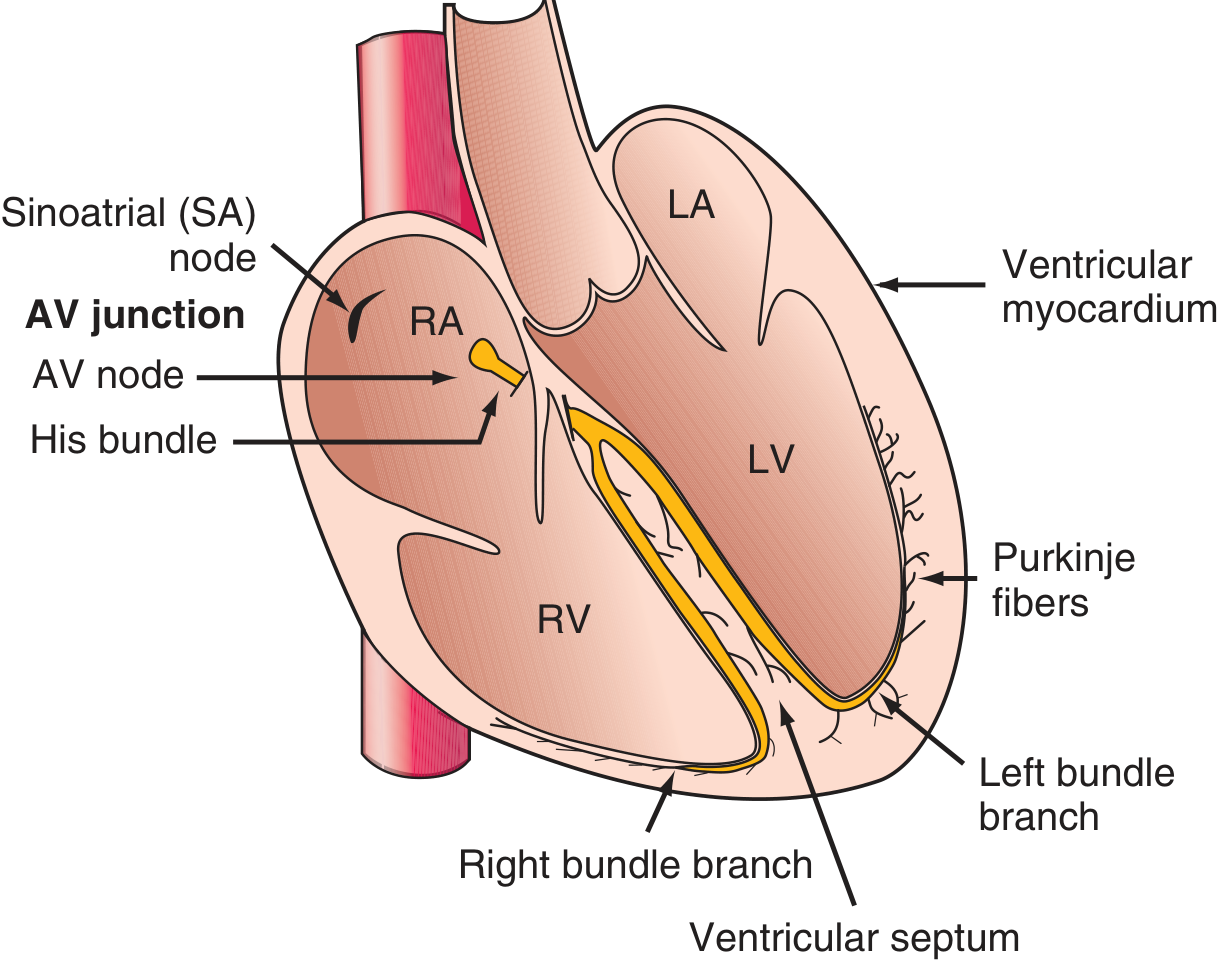
The normal heartbeat starts at the sinoatrial (SA) node in the right atrium - the natural pacemaker. The impulse travels:
- SA node → both atria (produces the P wave)
- AV node → slows the impulse (produces the PR interval delay)
- Bundle of His → splits into right and left bundle branches
- Purkinje fibers → rapidly spreads to ventricular myocardium (produces the QRS complex)
- Ventricles then repolarize (produces the T wave)
Step 2 - The ECG Paper
The paper is a grid of 1 mm squares:
| Measurement | Value |
|---|---|
| 1 small box (horizontal) | 0.04 seconds (40 ms) |
| 1 large box (5 small boxes) | 0.20 seconds (200 ms) |
| 1 small box (vertical) | 0.1 mV |
| Standard calibration | 1 mV = 10 mm |
| Paper speed | 25 mm/second |
Heart rate calculation: Count large boxes between two R waves, divide 300 by that number. (e.g., 4 large boxes = 300 ÷ 4 = 75 bpm)
Step 3 - The Waveforms
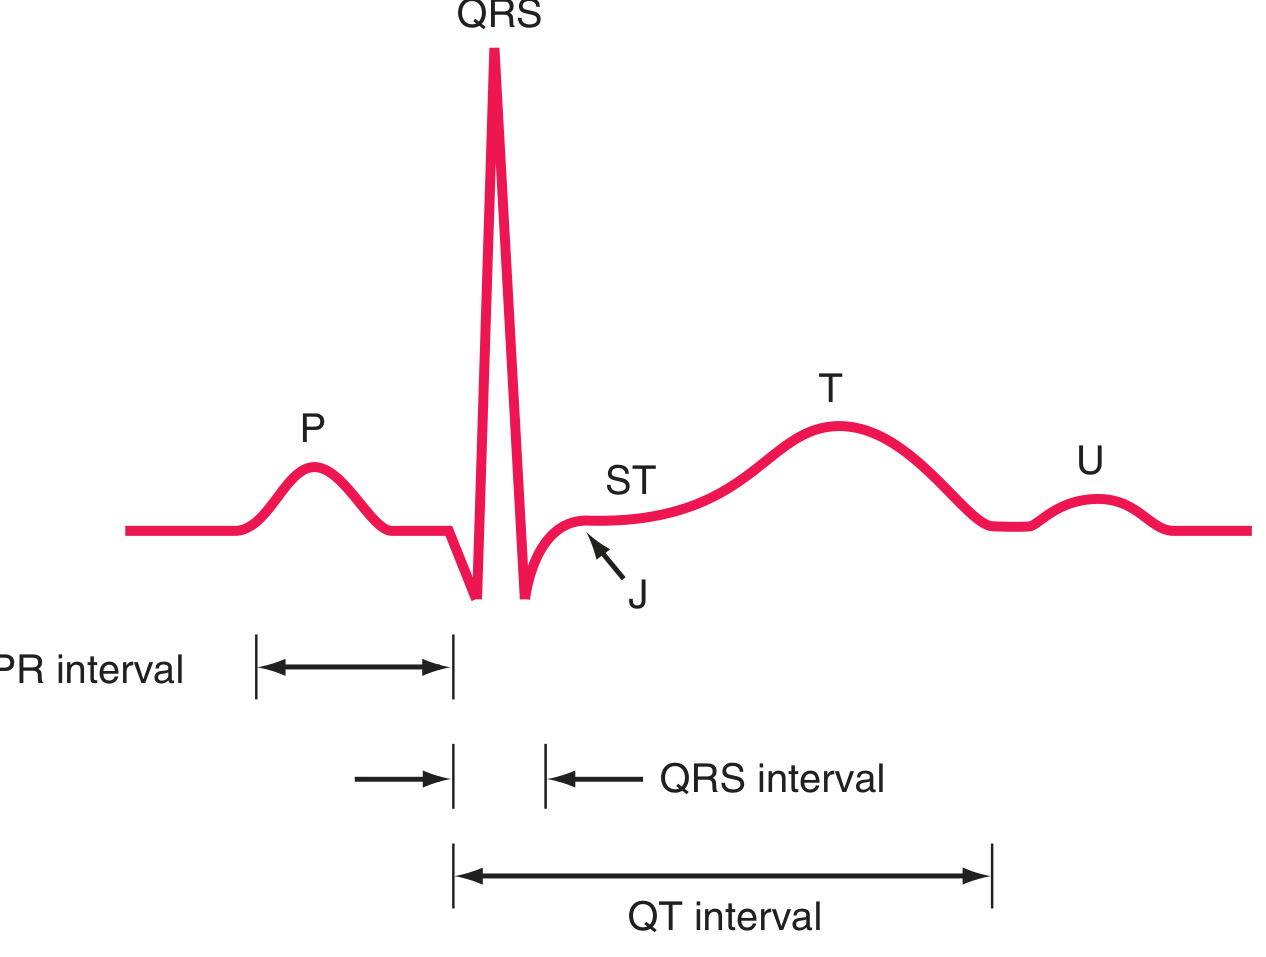
P Wave
- Represents atrial depolarization
- Caused by the spread of the depolarization wave from the SA node through both atria
- Normal: upright in lead II, inverted in aVR
- Duration: 0.06 - 0.12 sec (up to 3 small boxes)
- Amplitude: 2-3 mm
QRS Complex
- Represents ventricular depolarization
- Q wave: first downward deflection
- R wave: first upward deflection
- S wave: downward deflection after the R wave
- Normal duration: up to 0.10-0.11 sec (2.5 small boxes)
- A wide QRS (>0.12 sec) suggests bundle branch block or abnormal conduction
T Wave
- Represents ventricular repolarization
- Normally concordant with QRS (upright where QRS is predominantly positive)
- Occurs 0.25-0.35 seconds after depolarization
- Inverted T waves can indicate ischaemia, LVH, or electrolyte abnormality
U Wave
- Small wave sometimes seen after the T wave
- Represents late phases of ventricular repolarization
- Prominent U waves: seen in hypokalaemia
ST Segment and J Point
- The J point is where QRS ends and ST segment begins
- Normally isoelectric (flat, at baseline)
- ST elevation = acute injury/STEMI
- ST depression = ischaemia or reciprocal change
Step 4 - Key Intervals (Normal Values)
| Interval | What it measures | Normal value |
|---|---|---|
| PR interval | Atrial → ventricular conduction (AV node delay) | 120-200 ms (3-5 small boxes) |
| QRS interval | Ventricular depolarization | ≤ 100-110 ms (<2.5 small boxes) |
| QT interval | Total ventricular depolarization + repolarization | Varies with rate; QTc ≤ 460 ms (women), ≤ 450 ms (men) |
| RR interval | Time between beats | Used to calculate heart rate |
Prolonged PR (>200 ms) = 1st degree AV block. Prolonged QRS (>120 ms) = bundle branch block. Prolonged QT = risk of Torsades de Pointes.
Step 5 - The 12 Leads
The 12-lead ECG views the heart from 12 different angles - like 12 camera positions:
Limb leads (frontal plane):
| Lead | View of the heart |
|---|---|
| I | Lateral (left side) |
| II | Inferior |
| III | Inferior |
| aVR | Right side (often negative in normal ECG) |
| aVL | Lateral (high left) |
| aVF | Inferior (foot) |
Precordial (chest) leads (horizontal plane):
| Lead | Position | What it sees |
|---|---|---|
| V1 | Right sternal border, 4th ICS | Right ventricle |
| V2 | Left sternal border, 4th ICS | Septum |
| V3-V4 | Anterior chest | Anterior wall |
| V5-V6 | Lateral chest | Lateral wall |
A positive deflection is recorded when a depolarization wavefront moves toward the positive pole of that lead. - Harrison's Principles of Internal Medicine, 22E
Step 6 - Electrical Axis
The QRS axis is the mean direction of ventricular depolarization in the frontal plane:
| Axis | Range | Clinical meaning |
|---|---|---|
| Normal | -30° to +100° | Normal |
| Left axis deviation (LAD) | More negative than -30° | LVH, left anterior fascicular block, inferior MI |
| Right axis deviation (RAD) | More positive than +100° | RVH, left posterior fascicular block, lateral MI, pulmonary embolism |
| Extreme axis | Beyond +180° | Electrode reversal, severe RVH |
Quick trick: If QRS is positive in lead I and positive in aVF → normal axis. Positive in I, negative in aVF → LAD. Negative in I, positive in aVF → RAD.
Step 7 - The Cardiac Cycle in One Picture
This diagram shows how the ECG waveforms map to mechanical cardiac events:
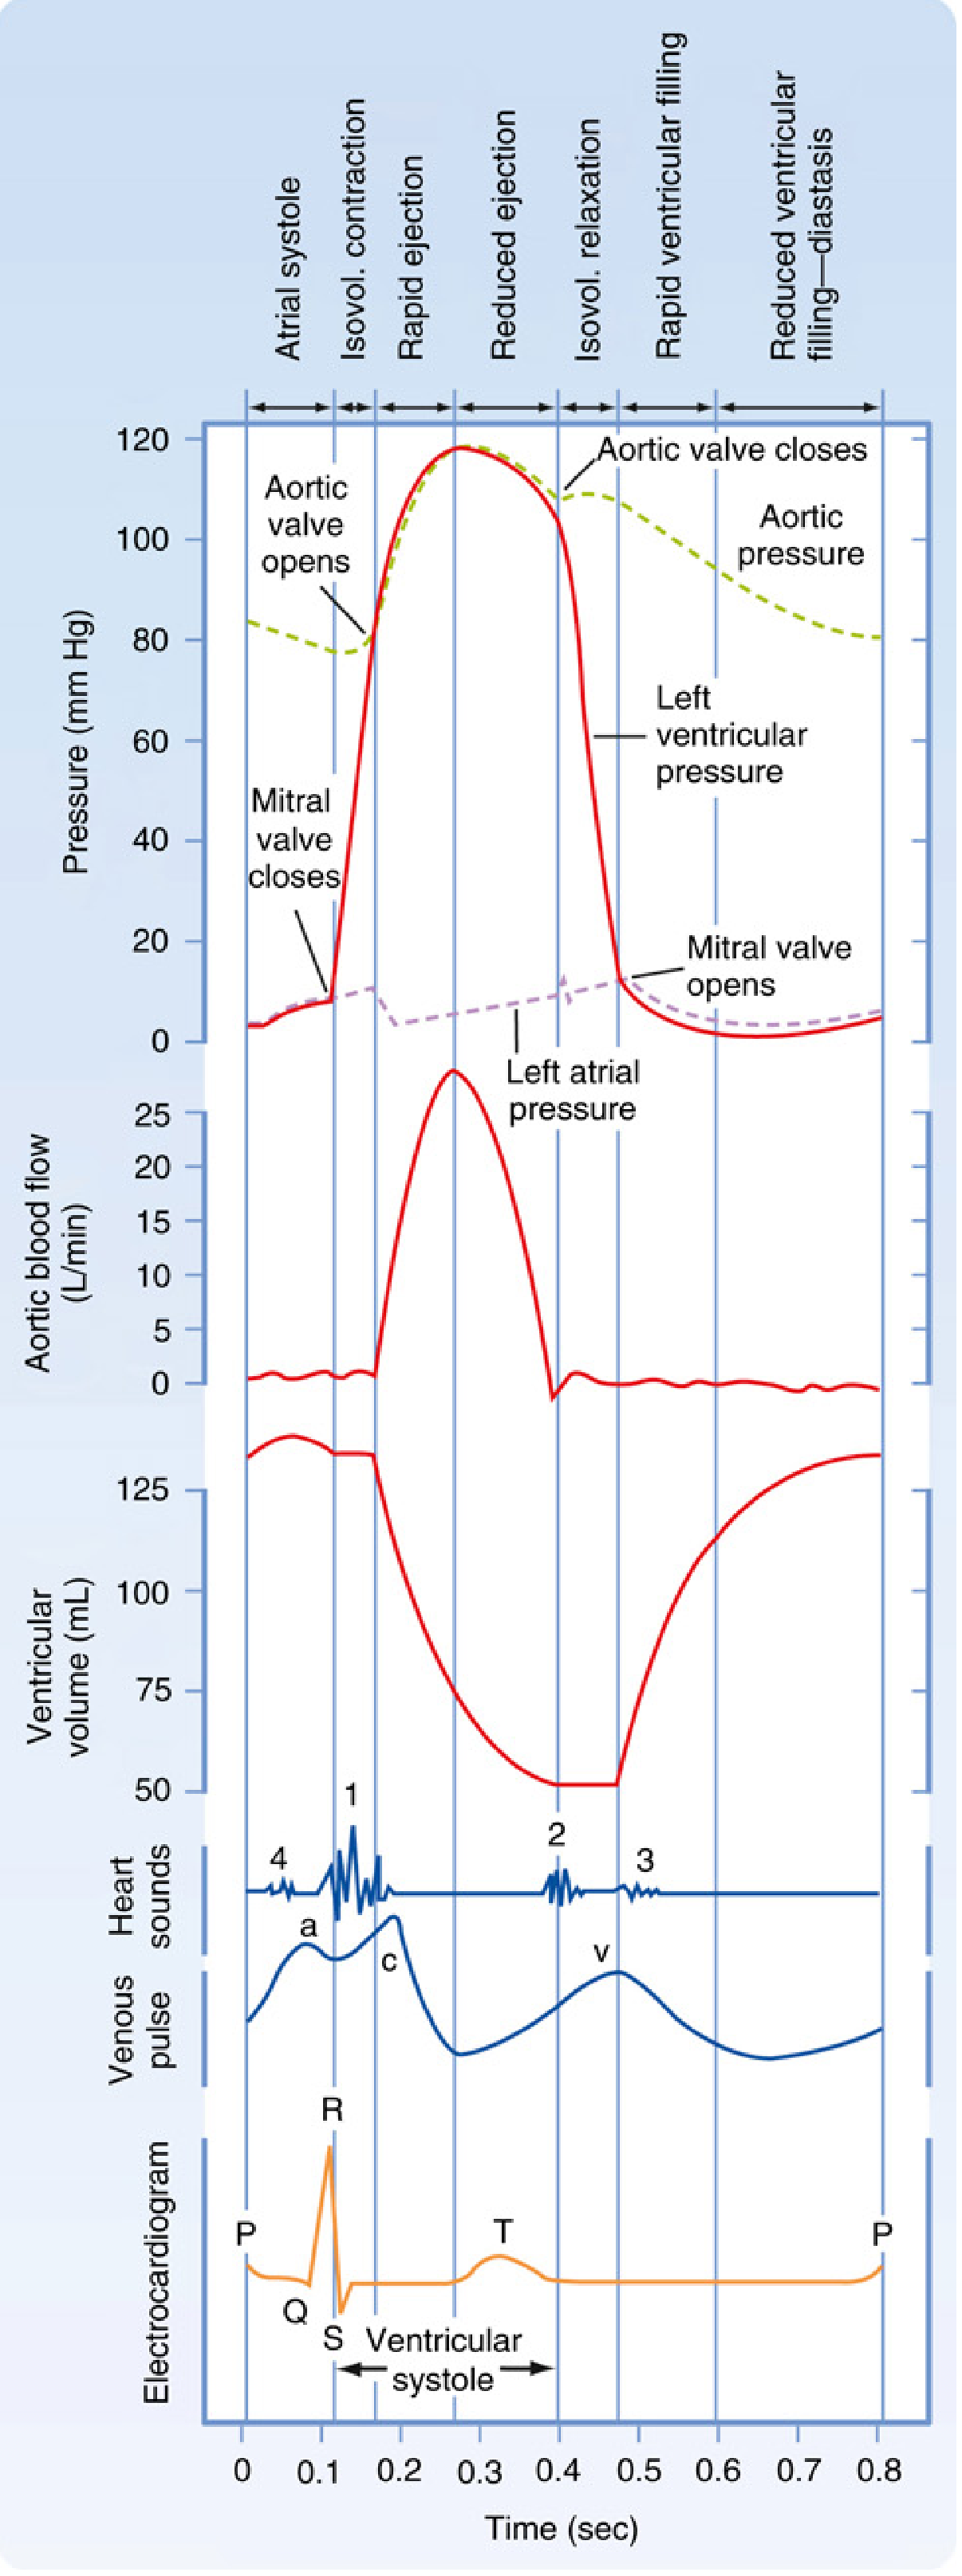
Key relationships:
- P wave = atrial systole begins (the "atrial kick")
- QRS = ventricular systole begins; mitral and tricuspid valves close (S1)
- T wave = ventricular repolarization; aortic and pulmonic valves close (S2)
Step 8 - Systematic Approach (The 6-Step Method)
Always read an ECG in order to avoid missing findings:
- Rate - fast (>100), normal (60-100), or slow (<60)?
- Rhythm - regular or irregular? Is there a P before every QRS?
- Axis - normal, left, or right deviation?
- PR interval - normal, prolonged (AV block), or short (WPW)?
- QRS - narrow (<0.12 s) or wide (BBB, ventricular rhythm)?
- ST-T changes - elevation, depression, T wave inversion?
Quick Reference Cheat Sheet
| Finding | Think of |
|---|---|
| No P waves + irregular rhythm | Atrial fibrillation |
| Sawtooth baseline, regular | Atrial flutter (rate ~300 bpm, ventricular ~150 bpm) |
| Wide QRS, RBBB pattern (RSR' in V1) | Right bundle branch block |
| Wide QRS, LBBB pattern (broad notched R in V5/V6) | Left bundle branch block |
| ST elevation (convex) | STEMI - acute MI |
| ST depression + T inversion | Ischaemia / NSTEMI |
| Tall peaked T waves | Hyperkalaemia (early sign) |
| Prolonged QT | Hypokalaemia, hypocalcaemia, drugs (e.g. amiodarone) |
| Short PR + delta wave | Wolff-Parkinson-White (WPW) |
| Electrical alternans | Cardiac tamponade |
Sources: Guyton and Hall Textbook of Medical Physiology; Harrison's Principles of Internal Medicine, 22E; Miller's Anesthesia, 10e
For a video walkthrough, this 13-minute overview by Rhesus Medicine is excellent:
Full
Finding Sources
Finding Sources
Finding Sources
Finding Sources
Finding Sources
Finding Sources
Reading File
Reading File
Reading File
Excellent data. Now let me read the Harrison's content on AV blocks, BBB, hypertrophy, and ischaemia, plus fetch key ECG images in parallel.
Reading File
Loading Image
Loading Image
Now let me get the BBB section, AV blocks, and ischaemia/infarction section from Harrison's, plus the LVH/RVH diagram and a normal ECG.
Reading File
Loading Image
Loading Image
Reading File
Loading Image
Excellent. Now let me get the AV block content and the electrolyte/drug effects section, plus an atrial flutter image.
Reading File
Finding Sources
Reading File
Reading File
Now let me get the electrolyte/drug effects on ECG and fetch the anterior/inferior MI evolution diagrams.
Reading File
Loading Image
I now have comprehensive, richly sourced content for a full ECG guide. Let me also get the atrial flutter image and the normal 12-lead ECG image.
Finding Sources
Loading Image
Here is the complete, fully sourced ECG guide drawn from Harrison's 22E, Guyton & Hall, Tintinalli's Emergency Medicine, Morgan & Mikhail, and Rosen's Emergency Medicine.
ECG Made Easy - Complete Guide
PART 1: FOUNDATIONS
What the ECG Records
When a cardiac impulse passes through the heart, electrical current spreads into surrounding tissues and all the way to the body surface. Electrodes placed on the skin detect these potential differences and trace them as waveforms on graph paper. This recording is the electrocardiogram. - Guyton and Hall Textbook of Medical Physiology
The Cardiac Conduction System
Before reading any ECG, you must understand what generates each deflection:
| Step | Structure | What it produces on ECG |
|---|---|---|
| 1 | SA node (right atrium) - the natural pacemaker | Start of P wave |
| 2 | Spread through both atria | P wave |
| 3 | AV node - deliberate slowing | PR interval delay |
| 4 | Bundle of His → right and left bundle branches | QRS begins |
| 5 | Purkinje fibers → ventricular myocardium | QRS complex |
| 6 | Ventricular repolarization | T wave |
The depolarization and repolarization wavefronts have direction and magnitude, so they can be represented as vectors. - Harrison's Principles of Internal Medicine, 22E
The ECG Paper
The grid is standardised worldwide:
| Box | Time | Voltage |
|---|---|---|
| 1 small box | 0.04 s (40 ms) | 0.1 mV |
| 1 large box (5 small) | 0.20 s (200 ms) | 0.5 mV |
| Standard calibration | - | 1 mV = 10 mm |
| Paper speed | 25 mm/second | - |
Heart rate (regular rhythm): Divide 300 by the number of large boxes between two R waves.
- 1 box = 300 bpm | 2 boxes = 150 | 3 boxes = 100 | 4 boxes = 75 | 5 boxes = 60 | 6 boxes = 50
Heart rate (irregular rhythm): Count the number of QRS complexes in a 10-second strip and multiply by 6.
PART 2: THE WAVEFORMS IN DETAIL
P Wave - Atrial Depolarization
- Represents spread of depolarization from the SA node through both atria
- Normal: upright in lead II, inverted in aVR (because the depolarization vector points toward lead II's positive pole)
- Duration: 0.06-0.12 s (up to 3 small boxes)
- Amplitude: 2-3 mm (0.2-0.3 mV)
- A retrograde (inverted in II, upright in aVR) P wave suggests an ectopic atrial or junctional pacemaker
PR Interval - AV Conduction Time
- Measured from the onset of P wave to the start of QRS
- Includes the physiologic delay at the AV node
- Normal: 120-200 ms (3-5 small boxes)
- Short PR (<120 ms): pre-excitation (WPW), junctional rhythm
- Long PR (>200 ms): 1st degree AV block
QRS Complex - Ventricular Depolarization
- Q wave: first downward deflection
- R wave: first upward deflection
- S wave: downward deflection after R wave
- Normal duration: ≤100-110 ms (<2.5 small boxes)
- Wide QRS (≥120 ms): bundle branch block, ventricular rhythm, pacing, hyperkalemia, pre-excitation
R wave progression across chest leads (V1→V6):
- V1: small r, deep S (right ventricle dominates here)
- V3/V4: transition zone where R = S
- V6: tall R, small q (left ventricle dominates here)
- Poor R wave progression (failure of R to grow V1→V4): anterior MI, LBBB, RVH
ST Segment - Early Repolarization Phase
- The J point is where QRS ends and ST begins
- Normally isoelectric (at baseline)
- The plateau of the action potential (phase 2) corresponds to this isoelectric ST segment
T Wave - Ventricular Repolarization
- Represents ventricular recovery
- Normally concordant with (same direction as) the QRS in that lead
- Occurs 0.25-0.35 seconds after depolarization - Guyton and Hall
- Normally upright in I, II, V3-V6; inverted in aVR
U Wave
- Small wave after the T wave, most visible in V2-V3
- Represents late phases of ventricular repolarization
- Prominent U waves: think hypokalaemia
- Negative U waves: may indicate ischaemia or LVH
QT Interval - Total Ventricular Electrical Activity
- Measured from start of QRS to end of T wave
- Includes both depolarization and repolarization
- Varies inversely with heart rate (faster rate = shorter QT)
- Rate-corrected QTc (Framingham formula): QTc = QT + 0.154 × (1000 - RR), values in ms
- Upper normal limits: QTc ≤ 460 ms in women; ≤ 450 ms in men - Harrison's 22E
PART 3: THE CARDIAC CYCLE - ECG and Mechanics Together
| ECG event | Mechanical event |
|---|---|
| P wave | Atrial depolarization → atrial systole ("atrial kick") |
| End of PR interval | AV valves still open; ventricles filling |
| QRS | Ventricular depolarization → mitral/tricuspid close (S1) |
| ST segment | Isovolumic contraction → aortic/pulmonic open → ejection |
| T wave | Ventricular repolarization → aortic/pulmonic close (S2) |
| After T wave | Isovolumic relaxation → diastolic filling begins |
PART 4: THE 12 LEADS
Each lead is like a different camera angle looking at the same electrical events from a different spatial orientation. A wave of depolarization moving toward a lead's positive pole produces an upright deflection; moving away produces a negative deflection. - Harrison's 22E
Limb Leads (Frontal Plane)
| Lead | View | Normal P wave | Uses |
|---|---|---|---|
| I | Lateral (0°) | Upright | Lateral MI, axis |
| II | Inferior (60°) | Upright (tallest) | Rhythm strip (best P waves) |
| III | Inferior (120°) | Variable | Inferior MI |
| aVR | Right (−150°) | Inverted | Always negative in normal ECG; aVR elevation = left main disease |
| aVL | Lateral (−30°) | Variable | High lateral MI |
| aVF | Inferior (90°) | Upright | Inferior MI |
Precordial (Chest) Leads (Horizontal Plane)
| Lead | Position | Views |
|---|---|---|
| V1 | Right sternal border, 4th ICS | Right ventricle, septum |
| V2 | Left sternal border, 4th ICS | Septum |
| V3 | Between V2 and V4 | Anterior wall |
| V4 | Midclavicular line, 5th ICS | Anterior wall |
| V5 | Anterior axillary line | Lateral wall |
| V6 | Midaxillary line | Lateral wall |
PART 5: ELECTRICAL AXIS
The QRS axis is the mean direction of ventricular depolarization in the frontal plane:
| Axis | Range | Common Causes |
|---|---|---|
| Normal | −30° to +100° | Normal heart |
| Left axis deviation (LAD) | < −30° | LVH, left anterior fascicular block, inferior MI, LBBB |
| Right axis deviation (RAD) | > +100° | RVH, left posterior fascicular block, lateral MI, PE, RBBB, dextrocardia |
| Extreme axis | > +180° | Lead reversal, severe RVH |
The Quick Axis Trick:
- Lead I positive + aVF positive = Normal axis
- Lead I positive + aVF negative = Left axis deviation
- Lead I negative + aVF positive = Right axis deviation
- Lead I negative + aVF negative = Extreme axis
PART 6: SYSTEMATIC APPROACH (USE EVERY TIME)
Rate → Rhythm → Axis → P waves → PR → QRS → ST-T
Step 1: Rate
- Regular: 300 ÷ (number of large boxes between R waves)
- Irregular: count QRS in 10 seconds × 6
Step 2: Rhythm
Ask: Is there a P wave before every QRS? Is there a QRS after every P wave? Are the R-R intervals regular?
Step 3: Axis
Use leads I and aVF (see above)
Step 4: P Wave Morphology
- Upright in II? (Confirms sinus origin)
- Absent? (AF, junctional rhythm)
- Sawtooth? (Atrial flutter)
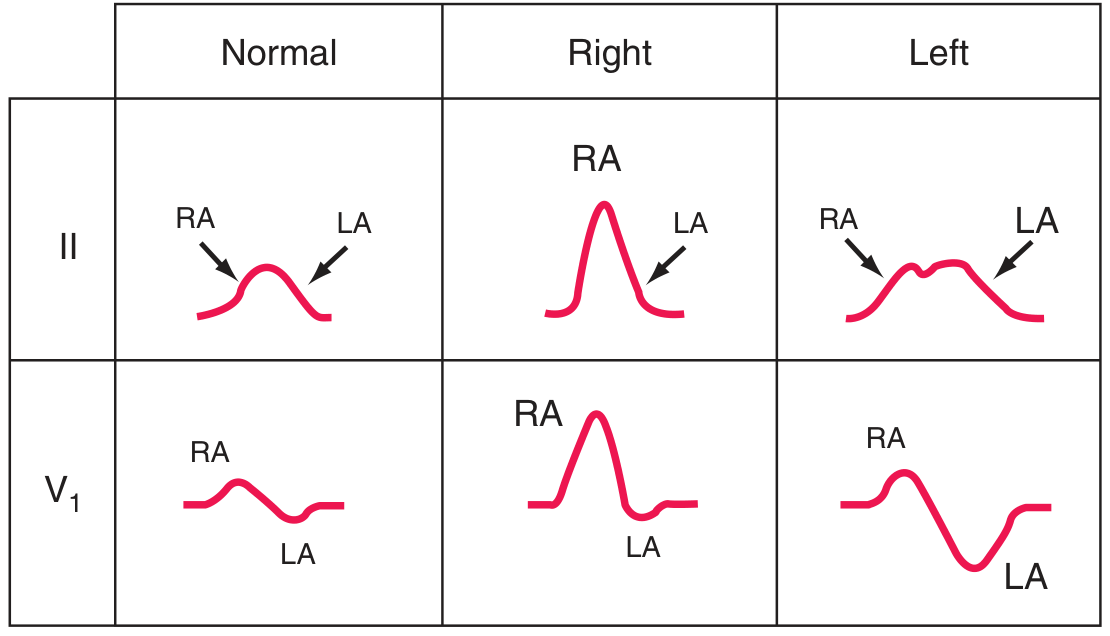
- Peaked tall (≥2.5 mm in II)? (Right atrial overload)
- Broad notched (≥120 ms)? (Left atrial abnormality)
Step 5: PR Interval
- Normal: 120-200 ms
- Prolonged: AV block (see below)
- Short + delta wave: WPW pre-excitation
Step 6: QRS Complex
- Width: narrow (<120 ms) or wide (≥120 ms)?
- Morphology in V1/V6: RBBB or LBBB pattern?
- Pathological Q waves?
- R wave progression normal?
Step 7: ST Segment and T Waves
- ST elevation or depression?
- T wave inversion?
- Leads affected? (determines territory)
PART 7: ATRIAL ARRHYTHMIAS
Atrial Fibrillation (AF)
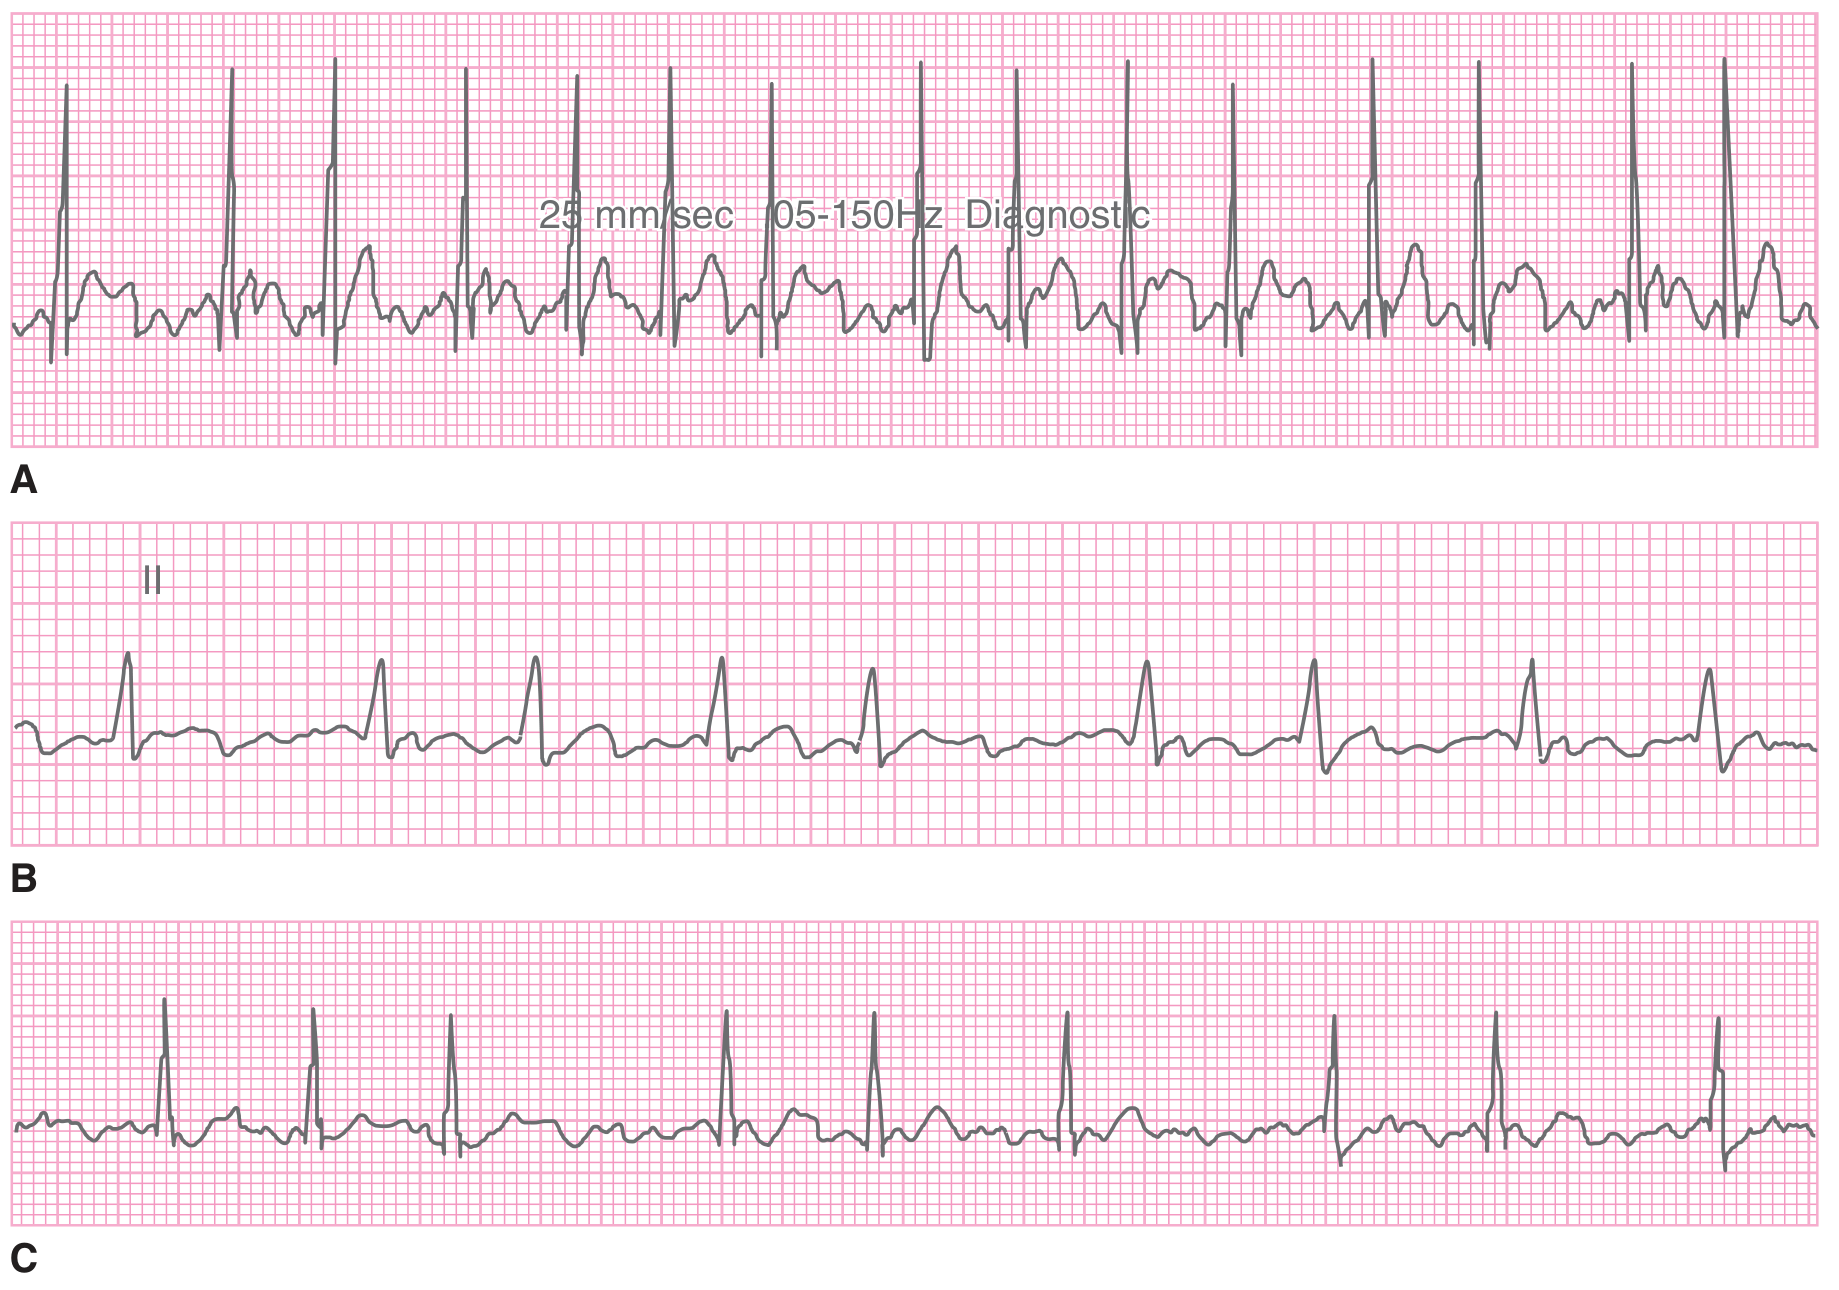
ECG features: - Tintinalli's Emergency Medicine
- Absence of discernible P waves (flat or chaotic baseline, most prominent in V1)
- Irregularly irregular ventricular rhythm (this is the hallmark)
- Narrow QRS (unless aberrant conduction or pre-existing BBB)
- Atrial rate > 600 bpm; ventricular rate typically 120-170 bpm if AV node unaffected
Causes: Ischaemic heart disease, valvular disease, hypertension, thyrotoxicosis, alcohol ("holiday heart"), cardiomyopathy
Atrial Flutter
ECG features: - Tintinalli's Emergency Medicine
- Sawtooth "flutter waves" - negative deflections best seen in II, III, aVF and V1
- Atrial rate classically ~300 bpm (range 250-350)
- Ventricular rate depends on AV block ratio:
- 2:1 block → ~150 bpm (most common)
- 3:1 block → ~100 bpm
- 4:1 block → ~75 bpm
- A regular narrow-complex tachycardia at exactly 150 bpm should always make you think flutter with 2:1 conduction
Supraventricular Tachycardia (SVT)
- Regular, narrow-complex tachycardia, rate 150-250 bpm
- P waves often buried in QRS or in ST segment (retrograde)
- Sudden onset and termination ("paroxysmal")
PART 8: AV CONDUCTION BLOCKS
AV conduction can be delayed, occasionally interrupted, or completely absent. - The Washington Manual of Medical Therapeutics
1st Degree AV Block
- PR interval > 200 ms (> 5 small boxes), prolonged but every P conducts
- Can reflect abnormal conduction anywhere from atria to distal His-Purkinje
- Rarely symptomatic alone
2nd Degree AV Block - Mobitz Type I (Wenckebach)
- PR interval progressively lengthens with each beat
- Then one P wave is suddenly NOT followed by a QRS (dropped beat)
- Then the cycle repeats
- Usually a block in the AV node itself
- Causes: digitalis toxicity, inferior MI, increased vagal tone
- Generally benign; rarely progresses to complete block
2nd Degree AV Block - Mobitz Type II
- PR interval is constant from beat to beat
- Then suddenly a P wave is not conducted (QRS dropped) without warning
- Block is in or below the His bundle
- QRS is typically wide (bundle branch block pattern)
- More dangerous - frequently progresses to complete (3rd degree) block
- Indication for pacing - Morgan and Mikhail's Clinical Anesthesiology, 7E
3rd Degree (Complete) AV Block
- Complete AV dissociation - atrial and ventricular rates are independent
- P waves and QRS complexes march through at different rates with no relation to each other
- Ventricular escape rhythm:
- Block at AV node → narrow QRS escape at 40-60 bpm (junctional)
- Block below His bundle → wide QRS escape at < 40 bpm (ventricular), unstable
- Requires urgent pacing
PART 9: BUNDLE BRANCH BLOCKS
Intrinsic impairment of conduction in either bundle system widens the QRS to ≥ 120 ms with complete block. - Harrison's 22E
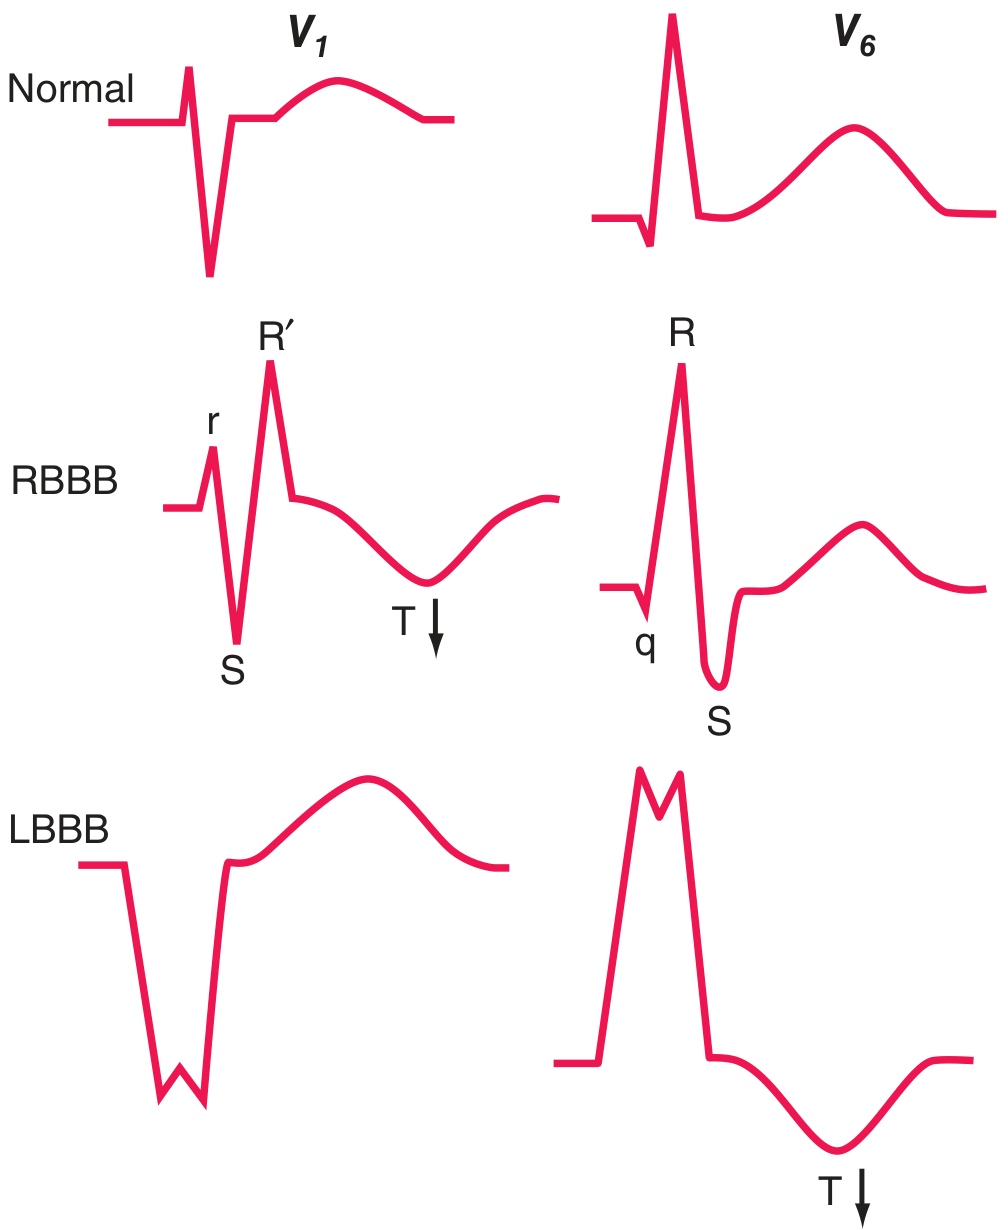
Right Bundle Branch Block (RBBB)
The terminal QRS vector is directed to the right and anteriorly:
| Lead | Pattern |
|---|---|
| V1 | rSR' (or RSR') - the classic "M shape" or "rabbit ears" |
| V6 | qRS with deep S wave |
| Lateral leads (I, V6) | Wide, slurred S wave |
| T waves | Opposite to the last QRS deflection (discordant) |
- QRS ≥ 120 ms
- Can be a normal variant (especially in young people)
- Also seen with ASD, pulmonary embolism, ischaemia
Left Bundle Branch Block (LBBB)
Early and late ventricular depolarization are both altered. Septal depolarization now proceeds right-to-left (opposite of normal):
| Lead | Pattern |
|---|---|
| V1 | Broad QS or rS (deep, wide negative complex) |
| V5/V6 | Broad, tall, notched R wave ("M" pattern) - no Q wave |
| T waves | Opposite to QRS (discordant) |
| Lateral leads (I, aVL) | Broad R wave |
- QRS ≥ 120 ms
- Almost always indicates underlying heart disease: coronary artery disease, hypertensive heart disease, aortic valve disease, cardiomyopathy
- New LBBB with chest pain = treat as MI until proven otherwise
Left Anterior Fascicular Block (LAFB)
- QRS axis < −45° (marked left axis deviation)
- QRS not significantly widened
- Most common cause of marked LAD in adults
Left Posterior Fascicular Block (LPFB)
- QRS axis > +110°
- Rare as isolated finding; requires exclusion of other causes of RAD
PART 10: VENTRICULAR HYPERTROPHY
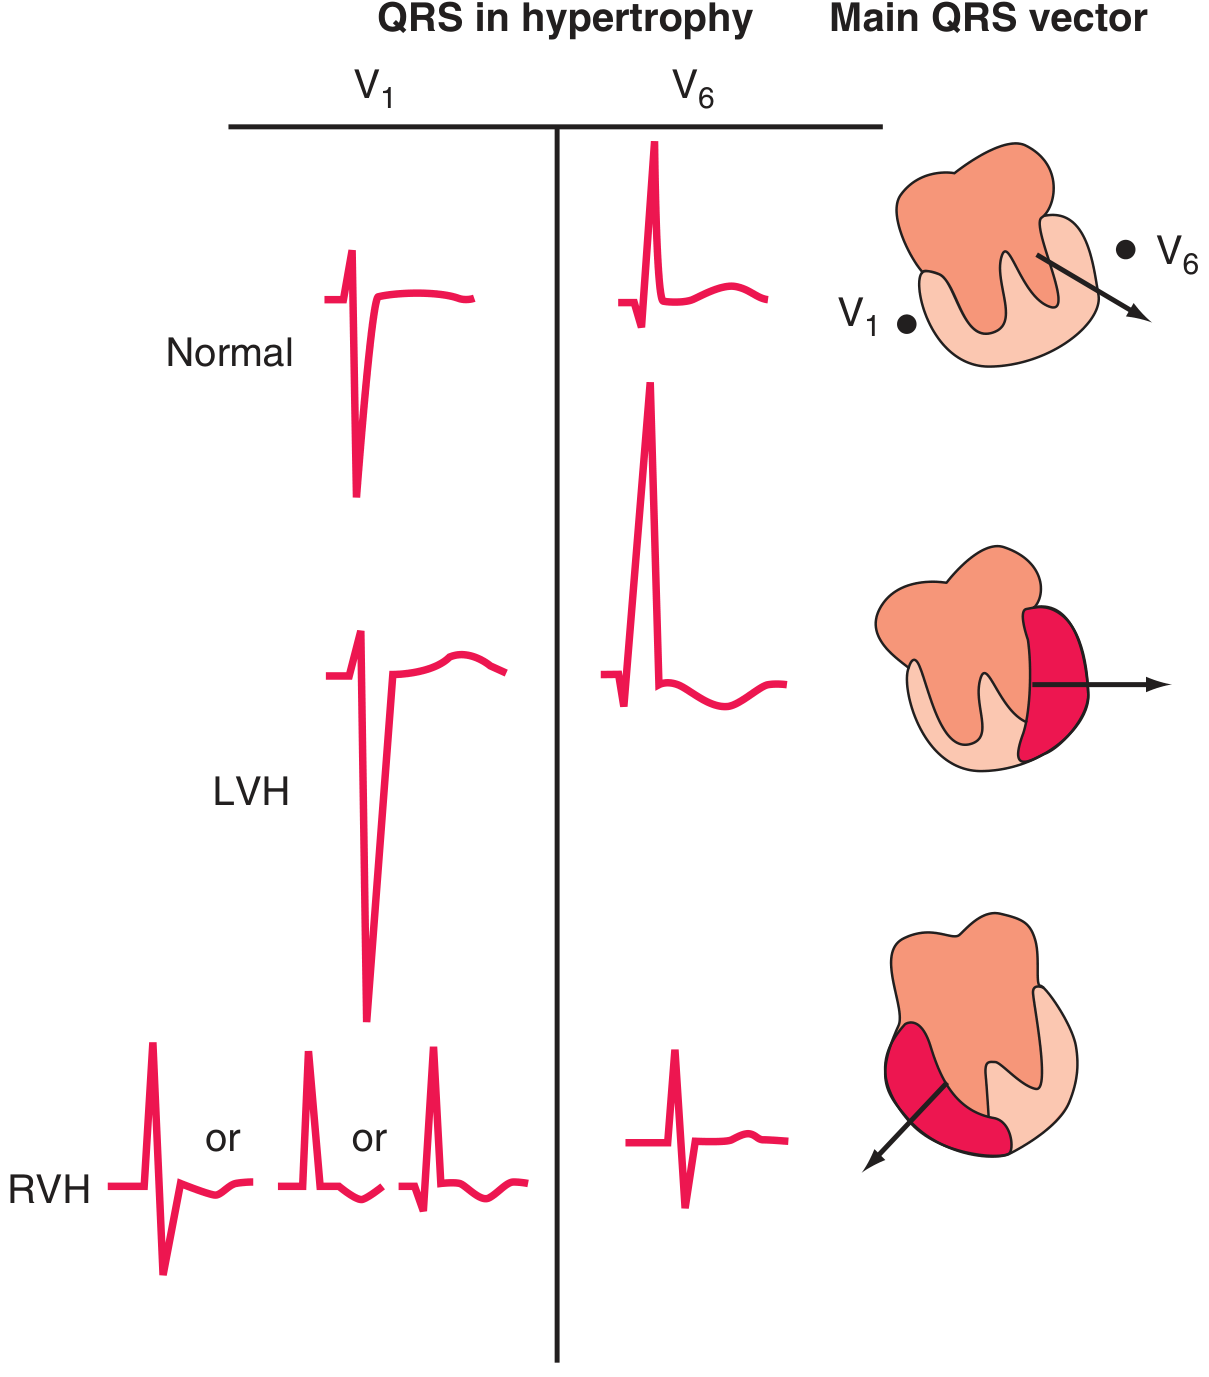
Left Ventricular Hypertrophy (LVH)
Tall left precordial R waves and deep right precordial S waves:
- Sokolow-Lyon criteria: SV1 + RV5 or RV6 > 35 mm
- RaVL > 20 mm in women, > 28 mm in men
- Left axis deviation
- Left atrial abnormality (broad notched P in II, biphasic P in V1)
- ST depression + T wave inversion in lateral leads (the "strain" pattern)
Right Ventricular Hypertrophy (RVH)
- Tall R wave in V1 (R ≥ S in V1) or qR pattern in V1
- Right axis deviation
- Dominant S waves in V5/V6
- ST depression + T wave inversion in right precordial leads (V1-V3)
- Causes: pulmonary hypertension, pulmonic stenosis, cor pulmonale
PART 11: ISCHAEMIA AND INFARCTION
The ECG is central to diagnosing acute and chronic ischaemic heart disease. Ischaemia exerts complex time-dependent effects on myocardial electrical properties. - Harrison's 22E
Subendocardial Ischaemia (NSTEMI pattern)
- ST vector shifts toward the subendocardium → ST depression in overlying leads
- ST elevation in aVR (reciprocal to widespread ST depression)
- T wave inversions
Transmural / Epicardial Ischaemia (STEMI pattern)
- ST vector shifts outward → ST elevation in overlying leads
- Reciprocal ST depression in opposite leads
- Earliest sign: hyperacute (tall, broad, peaked) T waves
Localisation of MI by ECG Leads
| Territory | Artery | Leads with STE | Reciprocal changes |
|---|---|---|---|
| Anterior | LAD | V1-V4 | II, III, aVF |
| Anterolateral | LAD + LCx | V1-V6, I, aVL | II, III, aVF |
| Lateral (high) | LCx or diagonal | I, aVL | II, III, aVF |
| Inferior | RCA (85%) / LCx | II, III, aVF | I, aVL |
| Posterior | RCA / LCx | V1-V3: ST depression + tall R | V7-V9: STE |
| Right ventricular | Proximal RCA | V4R, V1 | - |
- Rosen's Emergency Medicine; Tintinalli's Emergency Medicine
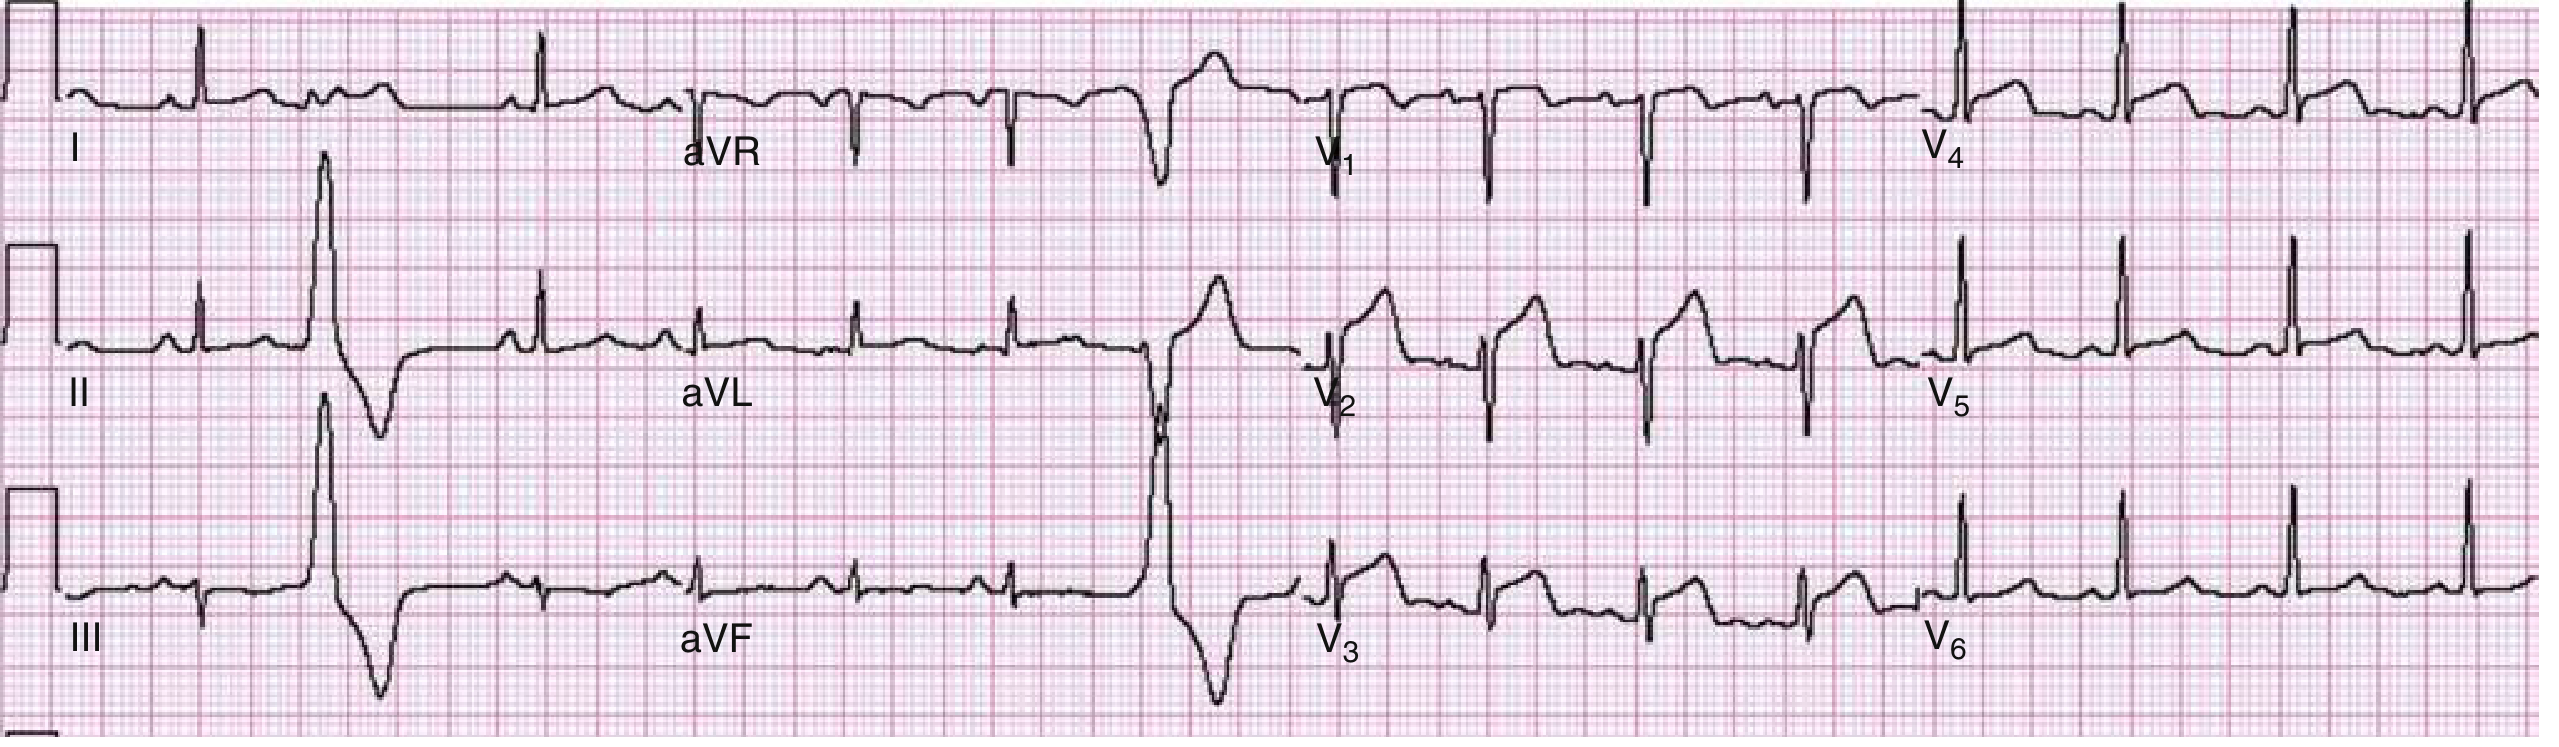
Evolution of MI over Time
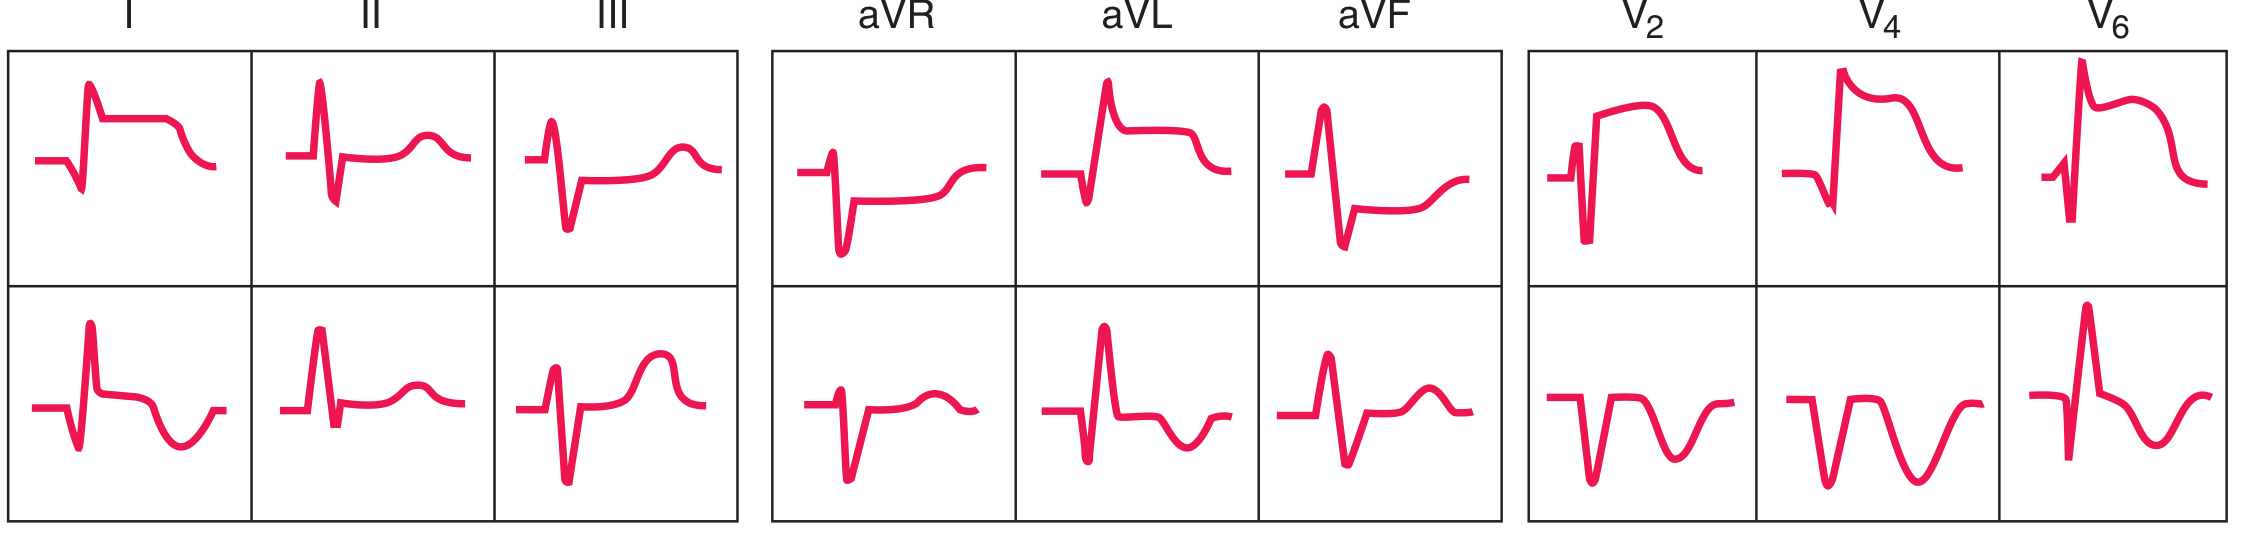
| Time | ECG Changes |
|---|---|
| Minutes (hyperacute) | Tall, broad "hyperacute" T waves |
| Hours | ST elevation (tombstone / convex shape) |
| Hours to days | T wave inversion develops |
| Hours to days | Pathological Q waves form (if transmural) |
| Weeks to months | ST normalises; Q waves and T inversions may persist |
| Chronic | Persistent Q waves; T waves may normalise |
Pathological Q Waves
- Width ≥ 40 ms (1 small box) OR
- Depth ≥ 25% of the R wave height in that lead
- Represent electrical scar from necrosis
Wellens Syndrome
- Deep symmetrical T wave inversions (or biphasic T waves) in V2-V3
- Seen in chest pain patients who are now pain-free
- Indicates critical LAD stenosis - Harrison's 22E
PART 12: HYPERTROPHY AND SPECIFIC CONDITIONS
Pulmonary Embolism (PE)
Classic pattern (seen in ~10-25%, not always present):
- S1Q3T3: prominent S wave in lead I, Q wave in III, T wave inversion in III
- Right axis deviation
- Right bundle branch block (new)
- Sinus tachycardia (most common finding)
- AF or flutter may occur
- Anterior T wave inversions (V1-V4) simulating anterior infarction
Pericarditis
- Saddle-shaped (concave upward) ST elevation in almost all leads (diffuse, not territorial)
- PR depression (particularly in II and V4-V6) - very specific sign
- No reciprocal ST depression (unlike MI)
- No Q waves
- No tall hyperacute T waves
Digoxin Effect
- "Scooping" of ST-T wave ("reverse tick" or "Salvador Dali moustache" sign)
- Short QT interval
- This is the effect of digoxin, not toxicity
- Digoxin toxicity: AV blocks, VT, bidirectional VT
PART 13: ELECTROLYTE AND DRUG EFFECTS
Harrison's 22E gives a precise sequence for hyperkalemia:
Hyperkalaemia (K⁺ rising)
| Serum K⁺ | ECG Change |
|---|---|
| 5.5-6.5 mmol/L | Tall, narrow, peaked (tented) T waves (earliest sign) |
| 6.5-7.5 mmol/L | PR prolongation, P wave flattening/disappearance |
| 7.5-8.5 mmol/L | QRS widening (sine wave pattern evolves) |
| > 8.5 mmol/L | Cardiac arrest - sine wave → asystole |
Hypokalaemia (K⁺ falling)
- Prolonged QU interval (often mistaken for long QT)
- Prominent U waves (most visible in V2-V3)
- Flat or inverted T waves
- ST depression
Hypocalcaemia
- Prolonged QT interval (lengthened ST segment specifically)
Hypercalcaemia
- Shortened QT interval
Hypothermia
- Bradycardia
- Osborn (J) wave: positive deflection at the J point, best in V3-V5 and inferior leads
- Prolonged QT
Drug Effects
| Drug | ECG Effect |
|---|---|
| Amiodarone | Prolonged QT, wide P waves, bradycardia |
| Digoxin | ST scooping, short QT (therapeutic effect) |
| Class IA agents (quinidine, procainamide) | Prolonged QT → Torsades de Pointes |
| Class IC agents (flecainide) | Wide QRS, PR prolongation |
| Tricyclics (overdose) | Wide QRS, right axis deviation, S wave in I, R' in aVR |
| Beta blockers / Ca channel blockers | Bradycardia, prolonged PR |
PART 14: VENTRICULAR ARRHYTHMIAS
Premature Ventricular Complexes (PVCs)
- Early, wide (≥ 120 ms) QRS complex without a preceding P wave
- Bizarre morphology
- Full compensatory pause after (R-R of PVC beat + following beat = 2 normal R-R intervals)
Ventricular Tachycardia (VT)
- Wide complex tachycardia (QRS ≥ 120 ms), rate > 100 bpm
- AV dissociation (independent P waves) - pathognomonic when visible
- Fusion beats and capture beats - also diagnostic
- Lead morphology:
- LBBB-like pattern in V1 = origin from right ventricle or septum
- RBBB-like pattern in V1 = origin from left ventricle free wall
Ventricular Fibrillation (VF)
- Chaotic, irregular, high-frequency undulations
- No identifiable QRS, ST, or T waves
- Cardiac arrest - requires immediate defibrillation
Torsades de Pointes
- Polymorphic VT with twisting of QRS axis around the baseline
- Triggered by long QT (drug-induced, electrolyte abnormalities)
- May self-terminate or degenerate to VF
PART 15: WOLFF-PARKINSON-WHITE (WPW)
A bypass tract (accessory pathway) bypasses the AV node:
- Short PR interval (< 120 ms) - fast conduction bypasses AV node
- Delta wave - slurred upstroke of QRS (pre-excitation of ventricle)
- Wide QRS (≥ 120 ms)
- QRS morphology can mimic LBBB, RBBB, RVH, or MI
- During AF in WPW: rapid ventricular response (> 200 bpm) with irregular wide QRS - life-threatening
PART 16: NORMAL 12-LEAD ECG
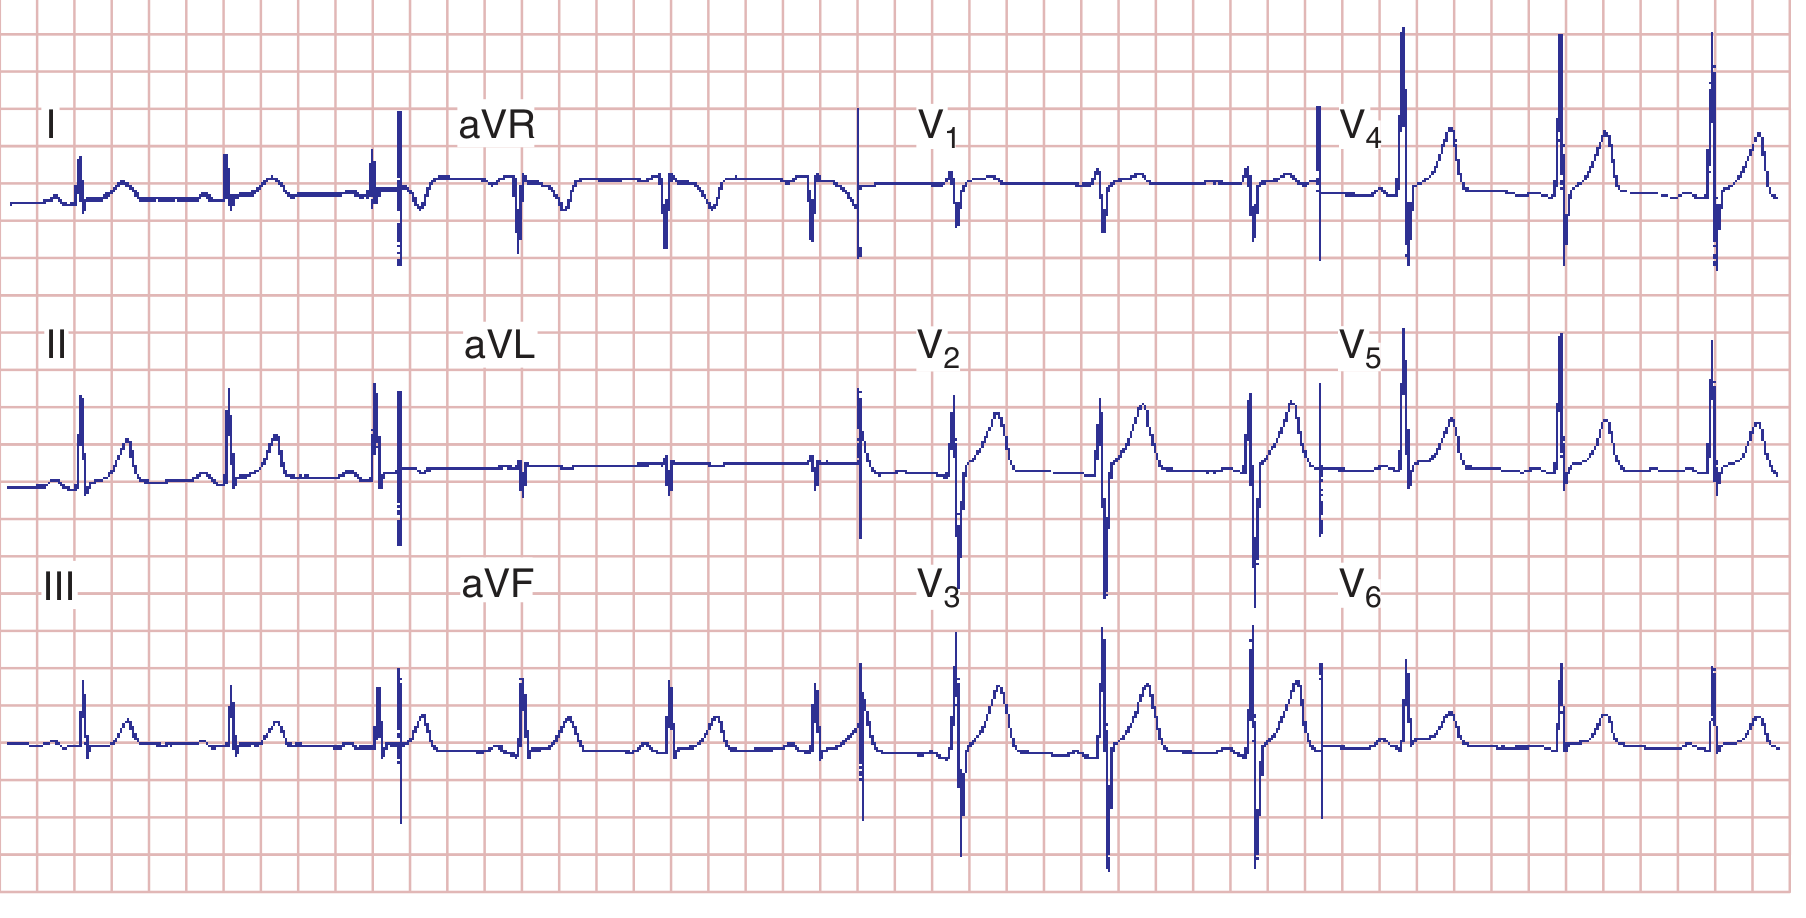
Normal values at a glance:
- HR: 60-100 bpm
- PR: 120-200 ms
- QRS: ≤ 110 ms
- QTc: ≤ 460 ms (F), ≤ 450 ms (M)
- Axis: −30° to +100°
- P wave: upright II, inverted aVR
- R wave progression: small r in V1 → tall R in V5/V6; transition at V3/V4
- ST segment: isoelectric
- T waves: upright in I, II, V3-V6; inverted in aVR
MASTER QUICK-REFERENCE TABLE
| ECG Pattern | Diagnosis |
|---|---|
| No P waves + irregularly irregular QRS | Atrial fibrillation |
| Sawtooth flutter waves, ventricular rate ~150 | Atrial flutter (2:1) |
| Regular narrow tachycardia, P in ST segment | SVT (AVNRT) |
| Short PR + delta wave + wide QRS | Wolff-Parkinson-White |
| Prolonged PR (> 200 ms) | 1st degree AV block |
| Progressive PR lengthening → dropped beat | 2nd degree AV block (Wenckebach/Mobitz I) |
| Constant PR → sudden dropped beat (wide QRS) | 2nd degree AV block (Mobitz II) |
| Complete P-QRS dissociation | 3rd degree (complete) AV block |
| rSR' in V1 + wide S in I/V6 (QRS ≥ 120 ms) | RBBB |
| QS or rS in V1 + broad notched R in V6 (QRS ≥ 120 ms) | LBBB |
| SV1 + RV5 > 35 mm + strain pattern | LVH |
| Tall R in V1 + RAD | RVH |
| ST elevation in II, III, aVF + reciprocal in I, aVL | Inferior STEMI (RCA) |
| ST elevation in V1-V4 | Anterior STEMI (LAD) |
| ST elevation I, aVL, V5-V6 | Lateral STEMI (LCx) |
| ST depression V1-V3 + tall R | Posterior MI |
| Diffuse concave ST elevation + PR depression | Pericarditis |
| Tall peaked T waves + wide QRS | Hyperkalemia |
| Prominent U waves + flat T waves | Hypokalemia |
| Short QT | Hypercalcaemia / Digoxin |
| Long QT | Hypocalcaemia / Drugs / Hypokalemia |
| S1Q3T3 + sinus tachycardia | Pulmonary embolism |
| Osborn (J) waves + bradycardia | Hypothermia |
| Electrical alternans | Cardiac tamponade |
| Deep T inversions V2-V4 in pain-free patient | Wellens syndrome (critical LAD stenosis) |
Sources:
- Harrison's Principles of Internal Medicine, 22E
- Guyton and Hall Textbook of Medical Physiology
- Tintinalli's Emergency Medicine: A Comprehensive Study Guide
- Rosen's Emergency Medicine
- Morgan and Mikhail's Clinical Anesthesiology, 7E
- Miller's Anesthesia, 10E
This is a shared conversation. Sign in to Orris to start your own chat.