
git physiology
gastrointestinal physiology diagram motility secretion absorption
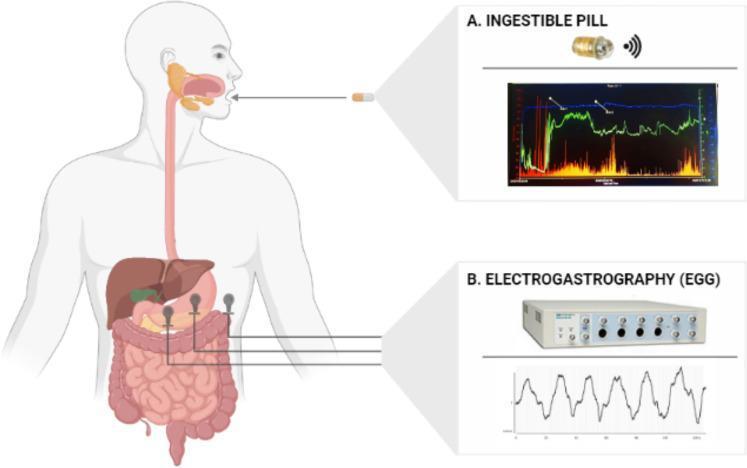
This medical infographic illustrates non-invasive methods for monitoring gastrointestinal (GI) physiology. A central anatomical diagram shows the human digestive tract, including the esophagus, stomach, and intestines. Part A highlights an ingestible wireless capsule (SmartPill) being swallowed, accompanied by a MotiliGI software graph. The graph displays real-time longitudinal monitoring of intraluminal parameters across the GI tract: temperature (blue line), pH levels (green line), and pressure (orange bars). Part B illustrates surface electrogastrography (EGG) setup. It depicts a 1-channel bipolar electrode montage with three cutaneous electrodes placed on the abdominal wall over the stomach region. This is connected to a data acquisition device (PowerLab) that records gastric myoelectric activity. Below the device, a typical EGG waveform shows rhythmic electrical oscillations corresponding to the stomach's slow-wave activity (approximately 0.05 Hz). These tools are used in clinical gastroenterology to evaluate gastric emptying, intestinal transit times, and myoelectric motility disorders such as gastroparesis.
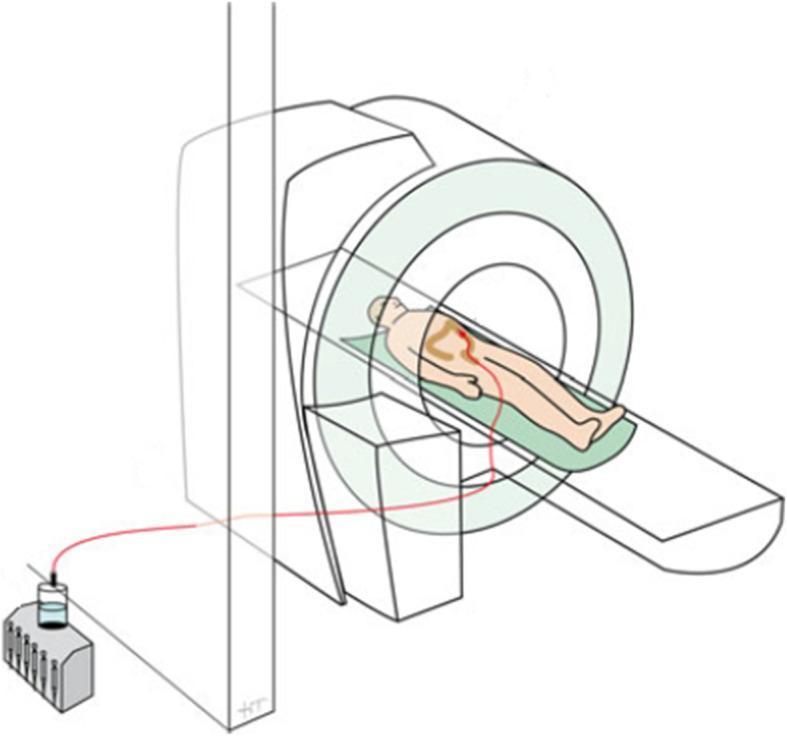
This medical schematic illustrates the experimental setup for simultaneous gastrointestinal motility assessment using cine magnetic resonance imaging (MRI) and colonic manometry. The diagram depicts a patient in the supine position on the MRI scanner bed. A colonic manometry catheter is inserted into the patient's colon, represented by a red line tracing through the abdominal cavity. The catheter extends out of the MRI bore and passes through the scanner room wall to maintain a distance from the magnetic field. Outside the scanner room, the catheter is connected to a water-perfused pneumohydraulic pump and a multichannel recording system used for pressure data acquisition. The clinical significance of this setup is to allow for the concurrent correlation of intraluminal pressure changes (manometry) with visual assessment of colonic wall motion and luminal contents (cine-MRI) in the study of motility disorders, such as functional constipation or fecal incontinence.
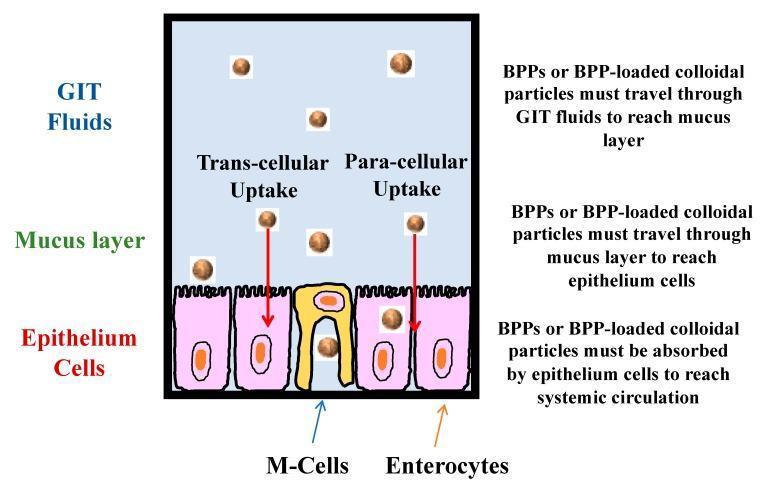
A pathophysiology diagram illustrating the absorption pathways of Bioactive Proteins and Peptides (BPPs) or BPP-loaded colloidal particles across the gastrointestinal tract (GIT) barrier. The visual depicts three distinct vertical layers: GIT Fluids (top), Mucus Layer (middle), and Epithelium Cells (bottom). Brown spherical particles represent the BPPs migrating through these layers to reach systemic circulation. The diagram highlights three specific absorption mechanisms: 1. Trans-cellular uptake, where particles enter directly through the apical membrane of pink-colored enterocytes; 2. Para-cellular uptake, where particles pass through the tight junctions between adjacent enterocytes; and 3. M-cell mediated uptake, shown via specialized yellow-colored M-cells (Microfold cells) typically found in Peyer’s patches. The enterocytes are characterized by brush-border-like projections (microvilli) on their apical surfaces. This schematic serves as an educational tool for understanding oral drug delivery challenges, emphasizing the sequential barriers of luminal fluids, the protective mucus layer, and cellular selectivity in the intestinal epithelium.
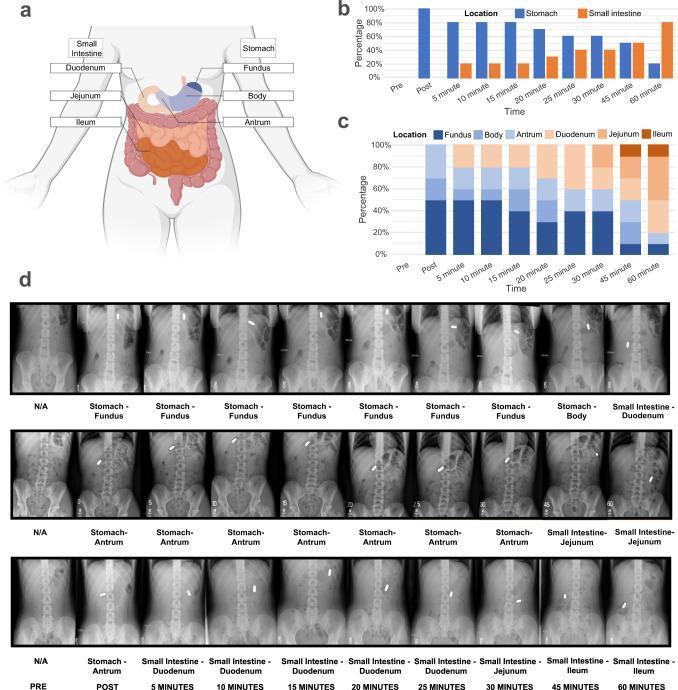
Educational medical composite illustrating gastrointestinal anatomy and capsule transit through the gut. Panel A is an anatomical diagram of the human torso showing the stomach partitioned into the fundus, body, and antrum, and the small intestine divided into the duodenum, jejunum, and ileum. Panels B and C are stacked bar charts showing the statistical distribution of capsule location across 10 participants over 60 minutes, shifting from the stomach (proximal) to the ileum (distal). Panel D displays clinical diagnostic images consisting of serial abdominal X-rays from three participants. These radiographic images track a radiopaque capsule's transit over 60 minutes in the supine position. The top row illustrates a slow transit from the fundus to the duodenum; the middle row shows movement from the antrum to the jejunum; and the bottom row demonstrates rapid transit reaching the ileum by 60 minutes. The content illustrates gastroduodenal motility and the use of ingestible capsules for studying gastrointestinal physiology and interoception.
gastric acid secretion parietal cell mechanism proton pump
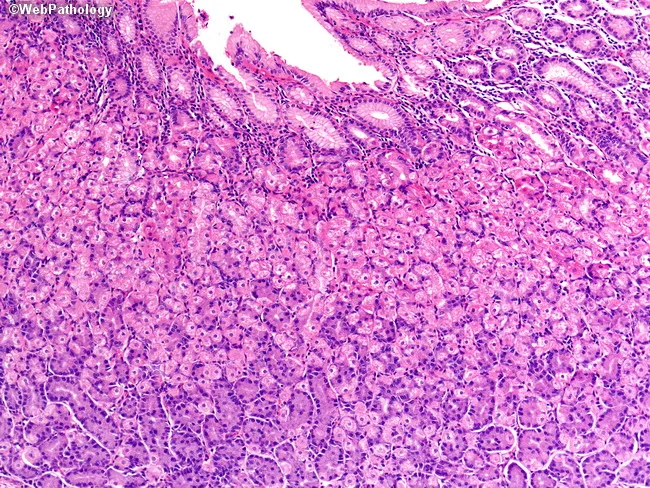
This is a bright-field light microscopy image of fixed gastric mucosa section stained with Hematoxylin and Eosin (H&E). The tissue shows gastric pits with an isthmus and neck populated by conspicuous parietal (oxyntic) cells with abundant eosinophilic cytoplasm and central nuclei. Parietal cells secrete hydrochloric acid and intrinsic factor, essential for digestion and B12 absorption. Deeper in the gland, chief (peptic) cells possess basophilic cytoplasm and secrete pepsinogen. Interspersed neuroendocrine cells release hormones; a stem cell zone resides at the neck, supporting constant epithelial renewal. The overall architecture corresponds to fundic-type oxyntic mucosa with tubular glands arranged in distinct isthmus/neck and base compartments. No overt inflammatory infiltrate or architectural distortion is evident, consistent with normal histology. This image is valuable for teaching gastric histology, differentiating mucous neck cells, parietal cells, chief cells, enteroendocrine cells, and stem cell niches, and for contextualizing pathologies affecting acid secretion, intrinsic factor production, or gastric carcinogenesis in educational and research settings.
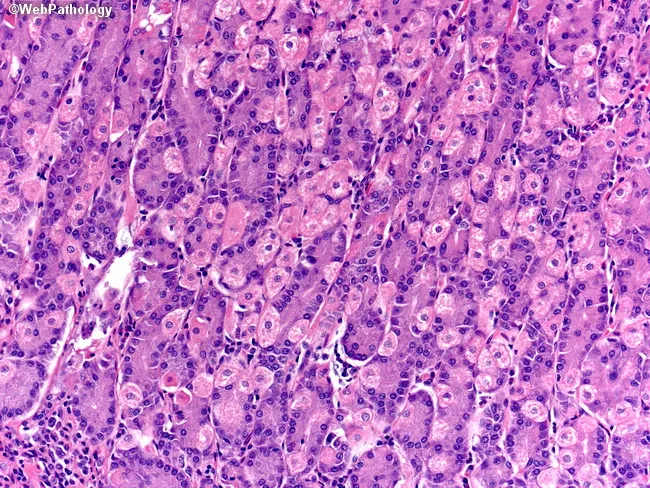
Gastric mucosal histology viewed by bright-field light microscopy on a Hematoxylin and Eosin (H&E) stained section of mucosa from the stomach, typically the oxyntic/fundic region. The glands are tubular and packed with two principal cell types: parietal (oxyntic) cells and chief (peptic) cells. Parietal cells display abundant eosinophilic (pink) cytoplasm and a central or slightly eccentric nucleus, giving a characteristic fried-egg appearance; they contribute acid secretion via gastric H+/K+-ATPase. Chief cells have basophilic (purple) cytoplasm with basal nuclei and apical zymogen granules, reflecting pepsinogen production. Neuroendocrine cells are present in minute numbers and are usually inconspicuous on routine H&E sections. Stem cells are scarce and not readily visible without special markers. The overall architecture shows intact gastric fundic glands with uniform cell density, minimal cytologic atypia, and preserved mucosal layering. The image emphasizes contrasts between cytoplasmic staining: eosinophilic parietal cells versus basophilic chief cells, as well as the densely staining nuclei. This morphology is essential for recognizing normal gastric mucosa, distinguishing parietal cell-rich areas, and identifying early metaplastic changes or inflammatory patterns in gastritis. Clinically, such images support reports of gastric biopsy evaluation, autoimmune gastritis assessment, and correlating acid-secreting cell distribution with disorders of digestion and nutrition and metabolic balance.
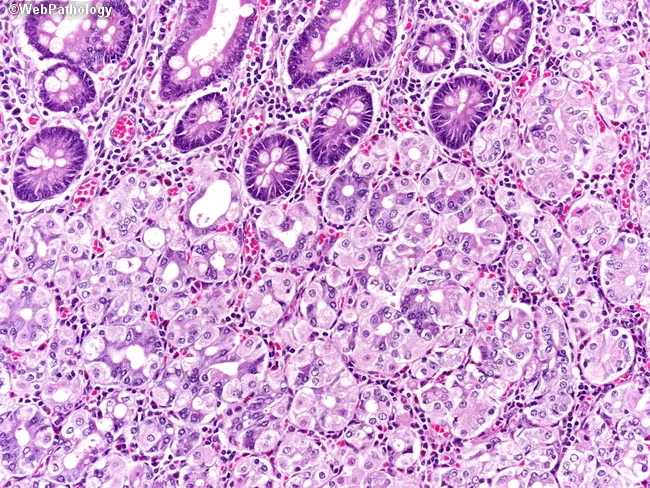
This is a high-magnification light microscopy image of gastric fundic mucosa (oxyntic glands) prepared with Hematoxylin and Eosin (H&E). The specimen represents stomach body/fundus mucosa; the image shows well-organized gastric tubular glands with prominent parietal (oxyntic) cells and abundant chief (zymogen) cells. Parietal cells appear as large, round to pyramidal cells with eosinophilic cytoplasm and intracellular canaliculi, often with a central or slightly eccentric nucleus, reflecting acid-secreting activity. Adjacent chief cells exhibit basophilic cytoplasm and basal nuclei; they contain apical zymogen granules. The glandular architecture demonstrates alternating parietal-rich regions and chief cell-rich zones within a single fundic unit, with supporting mucous cells and scattered enteroendocrine cells. The lamina propria shows a loose vascular stroma with scattered lymphocytes and capillaries; no acute or chronic inflammatory infiltrates are evident, and there is no dysplasia or metaplasia. This image captures histology suitable for educational references or diagnostic context as a normal comparator in gastritis, metaplasia, or neoplastic processes. Clinically, recognition of oxyntic glands and parietal/chief cell morphology under brightfield microscopy supports assessments of gastric acid secretion potential and helps differentiate fundic mucosa from antrum-type glands. The slide is useful for medical student teaching, histology atlases, and research focused on gastric gland physiology.
small intestine villi microvilli absorption nutrients diagram
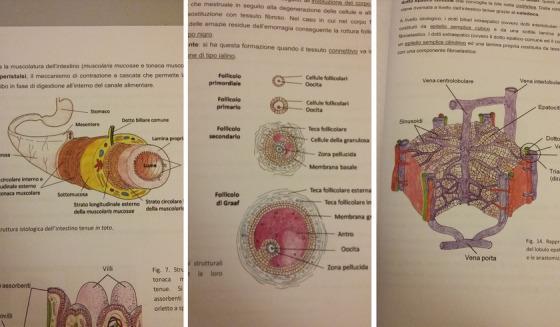
This composite educational resource consists of three histology diagrams. The first diagram illustrates the cross-sectional anatomy of the small intestine, highlighting the concentric layers: mucosa (including villi and lamina propria), submucosa, and the muscularis externa with its circular and longitudinal muscle layers. The second diagram depicts the chronological progression of oogenesis and follicular development in the ovary, identifying the primordial follicle, primary follicle, secondary follicle, and mature Graafian follicle. Key labels include the oocyte, zona pellucida, follicular cells (granulosa cells), theca layers (interna and externa), and the fluid-filled antrum. The third diagram shows a three-dimensional representation of a liver lobule, emphasizing the structural organization of hepatocytes and the microvasculature. It demonstrates the blood flow from the portal triad (interlobular veins and hepatic arteries) through the sinusoids toward the central vein (vena centrolobulare). These illustrations are designed for histology education, focusing on tissue microarchitecture and functional anatomical relationships in the gastrointestinal, reproductive, and hepatobiliary systems.
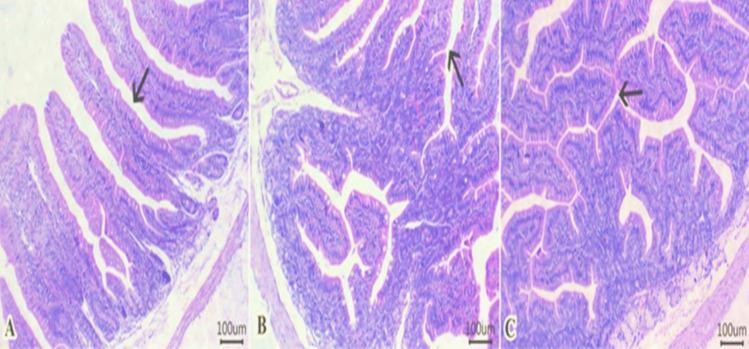
This figure presents three comparative photomicrographs (A, B, and C) of H&E-stained sections of the small intestine (duodenum) at 100 µm scale. The images illustrate histological variations in intestinal morphology under different experimental conditions. Panel A displays a control section with standard histological architecture, including columnar epithelial-lined villi, lamina propria, and a distinct submucosal layer containing Brunner's glands, muscularis, and serosa. Panels B and C demonstrate dose-dependent histological adaptations, characterized by a significant increase in villous height and a higher frequency of branching villi compared to the control. The villous epithelium in these treated groups appears more elongated and complex. This comparison is used to evaluate the impact of dietary additives on mucosal surface area and intestinal health, focusing on parameters such as villus morphometry and epithelial branching, which are critical for assessing nutrient absorption capacity in gastrointestinal studies.
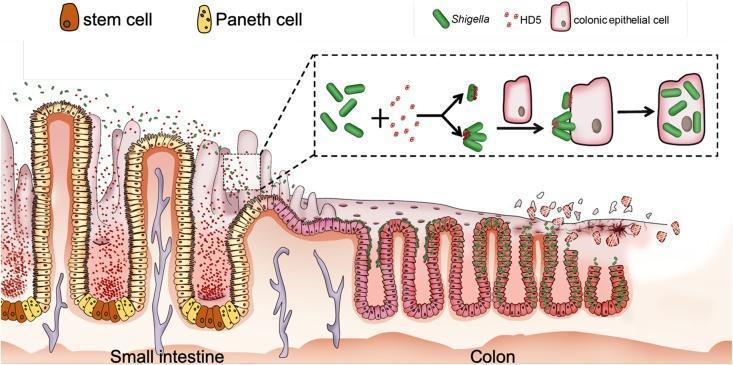
This pathophysiology diagram illustrates the proposed mechanism by which human alpha-defensin 5 (HD5) promotes Shigella infection in the colonic epithelium. The visual is divided into two main sections: the small intestine and the colon. In the small intestine section, the epithelium is characterized by long villi containing stem cells (brown) and Paneth cells (yellow) at the crypt bases. Paneth cells are shown secreting HD5 (red dots) into the intestinal lumen, where they encounter rod-shaped Shigella bacteria (green). A detailed inset shows the molecular interaction: HD5 binds to the bacterial surface, acting as a molecular bridge or causing bacterial clustering to enhance adhesion. In the colon section, the epithelium transitions to a flatter structure with shorter crypts. The HD5-coated Shigella are depicted adhering to the apical surface of colonic epithelial cells (pink), followed by cellular invasion and intracellular replication. The rightmost portion of the diagram shows resulting tissue damage, epithelial sloughing, and loss of mucosal integrity, highlighting the clinical significance of defensins as unintended facilitators of bacterial pathogenicity in certain gastrointestinal infections.
Gastrointestinal (GIT) Physiology
1. Overview and Purpose
- Motility - move ingesta along the tract
- Secretion - enzymes, acid, bile, mucus
- Digestion - break macromolecules into monomers
- Absorption - selective uptake of nutrients, water, electrolytes
- Excretion - eliminate waste and lipid-soluble metabolites via bile
2. Oral Phase: Mastication and Swallowing
Mastication (Chewing)
- Anterior teeth (incisors) cut; posterior teeth (molars) grind
- Jaw forces: up to 55 lb on incisors, 200 lb on molars
- Chewing muscles innervated by CN V (trigeminal); rhythmic control from brainstem reticular centers and hypothalamus
- The chewing reflex: bolus in mouth → inhibits jaw muscles → jaw drops → stretch reflex → rebound closure → cycle repeats
- Especially critical for fruits/vegetables (breaks cellulose membranes) and increases enzyme-accessible surface area
Swallowing (Deglutition)
- Voluntary stage - tongue squeezes bolus posteriorly against palate
- Pharyngeal stage (involuntary, <2 seconds):
- Soft palate elevates → closes posterior nares
- Palatopharyngeal folds approximate → filter incompletely chewed food
- Vocal cords close + larynx rises → epiglottis swings back over larynx (airway protection)
- Upper esophageal sphincter (UES/pharyngoesophageal sphincter) relaxes
- Pharyngeal peristalsis propels bolus into esophagus
- Controlled by the deglutition center in medulla/lower pons via CN V, IX, X, XII
- Esophageal stage - primary peristalsis (initiated by swallow) and secondary peristalsis (initiated by esophageal distension if primary fails)
3. Stomach
Anatomy and Motility
- Fundus - reservoir, generates slow waves (3/min)
- Body/Corpus - mixing, early digestion
- Antrum/Pylorus - grinding, regulates emptying
- Receptive relaxation - fundus relaxes as food enters (vagally mediated)
- Tonic contractions - body generates pressure to push chyme toward antrum
- Antral peristalsis - strong waves grind food; pylorus retropels large particles back for further mixing (retropulsion)
Gastric Acid Secretion
| Stimulus | Source | Receptor on Parietal Cell |
|---|---|---|
| Gastrin | G cells (antrum) | CCK-B/gastrin receptor |
| Histamine | ECL cells (paracrine) | H2 receptor |
| Acetylcholine | Vagal/enteric neurons | M3 muscarinic receptor |
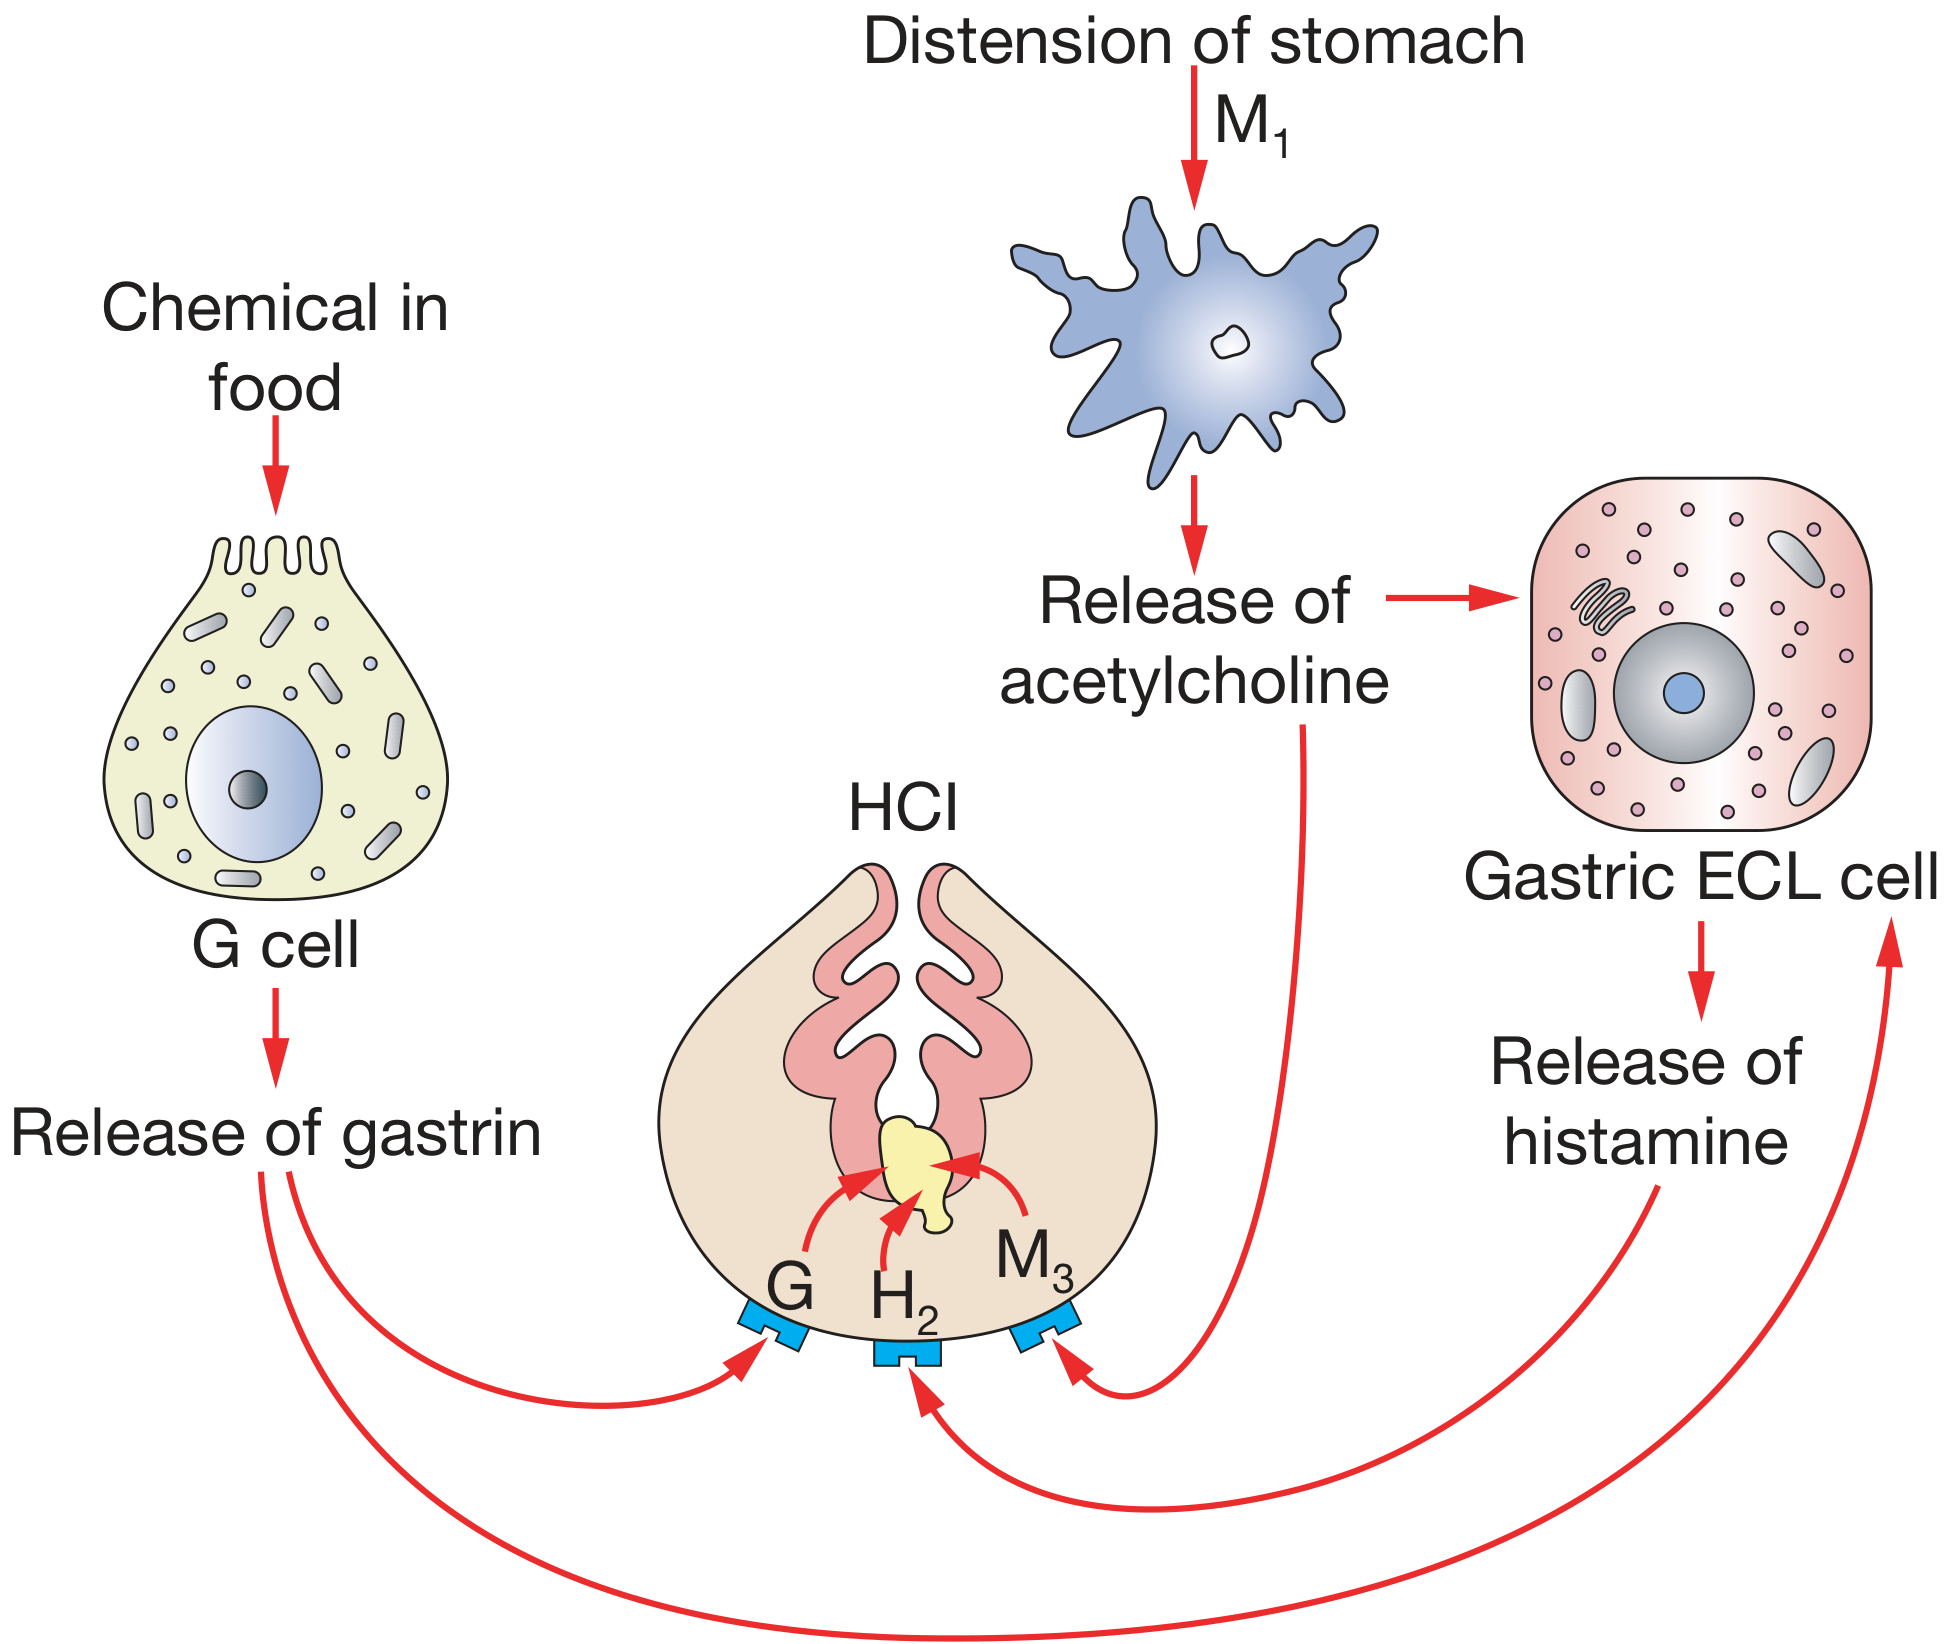
- Cephalic phase (~30% of total) - sight, smell, taste, thought of food → vagal activation → ACh → ECL/G cells → acid. First demonstrated by Pavlov.
- Gastric phase (~60%) - food distension of stomach + amino acids/peptides → G cells release gastrin → ECL cells release histamine → parietal cell stimulated. Gastrin is inhibited by luminal pH <2 (negative feedback).
- Intestinal phase (~10%) - chyme in duodenum → secretin, GIP, CCK, somatostatin → inhibit gastric acid and slow gastric emptying.
- Somatostatin from D cells (acts on G cells, ECL cells, and parietal cells)
- Secretin (released when duodenal pH <4.5)
- GIP (gastric inhibitory peptide/glucose-dependent insulinotropic peptide)
- Pepsinogen from chief cells → activated to pepsin by HCl (pH <2); initiates protein digestion
- Intrinsic factor from parietal cells → essential for B12 absorption in terminal ileum
- Mucus from surface mucous cells → protects mucosa (bicarbonate-rich layer, prostaglandin-maintained)
4. The Enteric Nervous System (ENS)
- Myenteric plexus (Auerbach's) - between circular and longitudinal muscle layers; controls motility
- Submucosal plexus (Meissner's) - regulates secretion, blood flow, and mucosal transport
- Parasympathetic (vagus/pelvic nerves) - generally pro-motility and pro-secretion
- Sympathetic (splanchnic nerves) - inhibits motility, reduces secretion, vasoconstricts
5. Small Intestine
Structural Adaptations for Absorption
- Plicae circulares (valves of Kerckring) - circular folds, 3× amplification
- Villi - finger-like projections, further ×10
- Microvilli (brush border) - further ×20
Intestinal Motility
- Segmentation - the dominant movement; rhythmic contractions divide and mix chyme with digestive juices (not net propulsion)
- Peristalsis - slow net propulsion toward the colon
- Migrating Motor Complex (MMC) - occurs between meals; sweeps residue and bacteria toward the colon ("intestinal housekeeper"); driven by motilin
Digestion and Absorption
- Salivary and pancreatic amylase cleave starch to oligosaccharides/disaccharides
- Brush-border enzymes (lactase, sucrase-isomaltase, maltase) cleave to monosaccharides
- Glucose/galactose absorbed via SGLT-1 (Na+-coupled cotransport)
- Fructose absorbed via GLUT-5 (facilitated diffusion)
- All exit via GLUT-2 on the basolateral side
- Gastric pepsin (partial); pancreatic proteases (trypsin, chymotrypsin, elastase, carboxypeptidases) cleave to oligopeptides/amino acids
- Trypsin activates all other pancreatic proteases (cascade)
- Brush-border peptidases complete hydrolysis
- Amino acids absorbed by Na+-coupled and H+-coupled transporters
- Di/tripeptides absorbed intact via PepT1 (H+-coupled)
- Lingual/gastric lipases provide initial hydrolysis
- Pancreatic lipase + colipase (essential cofactor) cleave triglycerides to monoglycerides + fatty acids
- Bile salts emulsify fat and form micelles to solubilize lipid products
- Monoglycerides/FAs diffuse into enterocytes → re-esterified into triglycerides in smooth ER → packaged as chylomicrons (with apoB-48) → secreted into lacteals (lymphatics), not portal blood
- Fat-soluble vitamins (A, D, E, K) absorbed with micelles
- Cholesterol absorbed via NPC1L1 transporter (target of ezetimibe)
- ~9 L/day enters gut (2 L diet + 7 L secretions); ~1.5 L enters colon; ~150 mL excreted in stool
- Na+ absorption drives water absorption osmotically
- CFTR channel secretes Cl- (and thus fluid) - defective in cystic fibrosis → thick secretions
- Vitamin B12 - bound to intrinsic factor; absorbed in terminal ileum via cubilin receptors
- Folate - jejunum via proton-coupled folate transporter (PCFT)
- Iron - absorbed as Fe2+ (reduced from Fe3+ by duodenal cytochrome b reductase/ascorbate) via DMT-1; exported by ferroportin; regulated by hepcidin
- Calcium - active transport in duodenum/jejunum (vitamin D-dependent via TRPV6 and calbindin); passive paracellular in ileum
6. Pancreatic and Biliary Secretion
Pancreas
- Acinar cells secrete digestive enzymes (as inactive zymogens - trypsinogen, chymotrypsinogen, proelastase)
- Ductal cells secrete bicarbonate-rich fluid (up to 120 mEq/L HCO3-) to neutralize gastric acid in duodenum
- CCK (from I cells of duodenum) - major stimulus for enzyme secretion; triggered by fat and protein in duodenum
- Secretin (from S cells) - major stimulus for bicarbonate secretion; triggered by duodenal acidification
Bile
- Hepatocytes continuously synthesize and secrete bile (~600-1000 mL/day)
- Primary bile acids (cholic, chenodeoxycholic) synthesized from cholesterol; conjugated with glycine/taurine
- Stored and concentrated in the gallbladder (up to 10×); CCK triggers gallbladder contraction + sphincter of Oddi relaxation
- Enterohepatic circulation: ~95% of bile salts reabsorbed in terminal ileum → portal blood → re-secreted by hepatocytes; only ~5% lost in feces
7. Large Intestine
- Haustral shuttling - bidirectional short-distance movements for mixing
- Mass movements (1-3×/day) - high-amplitude propagating contractions that drive content toward rectum; triggered by the gastrocolic reflex (eating → colon activity) and distension
- Rectal filling → stretch receptors → urge to defecate
- Internal anal sphincter (smooth muscle, involuntary) - reflexly relaxes (rectoanal inhibitory reflex)
- External anal sphincter (striated, voluntary, pudendal nerve CN S2-S4) - voluntarily contracts to defer, or relaxes to defecate
- Valsalva maneuver increases intra-abdominal pressure to assist defecation
8. GI Hormones Summary
| Hormone | Source | Stimulus | Main Actions |
|---|---|---|---|
| Gastrin | G cells (antrum) | Protein/peptides, distension, vagus | Stimulates acid, pepsin, gastric growth |
| CCK | I cells (duodenum) | Fat, protein | Pancreatic enzyme secretion, gallbladder contraction, slows gastric emptying |
| Secretin | S cells (duodenum) | Acid (pH <4.5) | Pancreatic HCO3- secretion, inhibits gastric acid |
| GIP | K cells (duodenum) | Glucose, fat | Inhibits gastric acid; stimulates insulin (incretin) |
| GLP-1 | L cells (ileum/colon) | Nutrients | Incretin, slows gastric emptying, reduces appetite |
| Motilin | M cells (duodenum) | Fasting | Initiates MMC (phase III) |
| Somatostatin | D cells | Acid, fat | Inhibits gastrin, histamine, acid, pancreatic secretion |
| VIP | Enteric neurons | Distension | Intestinal secretion, smooth muscle relaxation |
9. Key Regulatory Concepts
- Negative feedback on acid: Luminal pH <2 → somatostatin from D cells → suppresses G cells and ECL cells
- Ileal brake: Fat/protein in ileum → PYY + GLP-1 → slows gastric emptying and small bowel transit
- Liver as first-pass organ: All absorbed substances (except chylomicrons) pass through portal blood to the liver before entering systemic circulation. Hepatocytes detoxify, metabolize drugs, and clear bacteria.
- ENS redundancy: Extensive overlap of neural, hormonal, and paracrine controls ensures GI function even after vagotomy.
- Ganong's Review of Medical Physiology, 26e (overview, GI system introduction)
- Guyton & Hall Textbook of Medical Physiology (mastication, swallowing, motility)
- Bailey & Love's Short Practice of Surgery, 28e (gastric acid secretion phases)
- Sleisenger & Fordtran's GI and Liver Disease (acid-pepsin injury, gastric acid and GERD)
- Yamada's Textbook of Gastroenterology, 7e (ENS, vascular regulation)
Gi physiology
GI Physiology - Topics Covered Above
| Section | Key Points |
|---|---|
| Oral Phase | Mastication (CN V), swallowing (3 stages, deglutition center in medulla) |
| Stomach | Receptive relaxation, antral peristalsis, retropulsion |
| Gastric Acid Secretion | Parietal cell H+/K+-ATPase; 3 stimuli (gastrin, histamine, ACh); 3 phases (cephalic, gastric, intestinal) |
| Enteric Nervous System | Myenteric + submucosal plexuses; peristaltic reflex; "second brain" |
| Small Intestine | Plicae/villi/microvilli (200 m²); CHO/protein/fat digestion; SGLT-1, GLUT-5, chylomicrons, DMT-1 |
| Pancreas & Bile | CCK → enzymes; secretin → HCO3-; enterohepatic circulation of bile salts |
| Large Intestine | Water absorption, mass movements, SCFA production, defecation reflex |
| GI Hormones | Gastrin, CCK, secretin, GIP, GLP-1, motilin, somatostatin, VIP |
- Gastric secretion - detailed parietal cell molecular mechanisms
- Fat absorption - micelle formation, chylomicron assembly
- GI hormones - clinical correlations (Zollinger-Ellison, VIPoma, carcinoid)
- Colonic physiology - microbiome, SCFAs, motility disorders
- Liver/biliary physiology - bile synthesis, hepatocyte function
- Pancreatic secretion - enzyme activation cascade, pancreatitis pathophysiology