
Stage of hepatic encephalopathy
stages of hepatic encephalopathy grading table
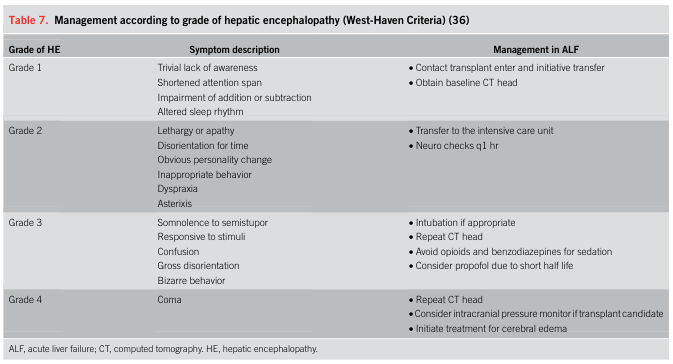
Table 7. Management according to grade of hepatic encephalopathy (West-Haven Criteria) (36) <table><thead><tr><th>Grade of HE</th><th>Symptom description</th><th>Management in ALF</th></tr></thead><tbody><tr><td>Grade 1</td><td>Trivial lack of awareness<br>Shortened attention span<br>Impairment of addition or subtraction<br>Altered sleep rhythm</td><td>• Contact transplant enter and initiative transfer<br>• Obtain baseline CT head</td></tr><tr><td>Grade 2</td><td>Lethargy or apathy<br>Disorientation for time<br>Obvious personality change<br>Inappropriate behavior<br>Dyspraxia<br>Asterixis</td><td>• Transfer to the intensive care unit<br>• Neuro checks q1 hr</td></tr><tr><td>Grade 3</td><td>Somnolence to semistupor<br>Responsive to stimuli<br>Confusion<br>Gross disorientation<br>Bizarre behavior</td><td>• Intubation if appropriate<br>• Repeat CT head<br>• Avoid opioids and benzodiazepines for sedation<br>• Consider propofol due to short half life</td></tr><tr><td>Grade 4</td><td>Coma</td><td>• Repeat CT head<br>• Consider intracranial pressure monitor if transplant candidate<br>• Initiate treatment for cerebral edema</td></tr></tbody></table> ALF, acute liver failure; CT, computed tomography. HE, hepatic encephalopathy.
![This Comparison Chart and Timeline illustrates the progression of chronic liver disease (CLD) through four distinct clinical stages, emphasizing the relationship between histology, hemodynamics, and the potential for regression. The illustration features liver icons with circular histological insets and a data table. Stage 1 (Non-cirrhotic): Characterized by steatohepatitis (F1-F3 fibrosis), HVPG <5mmHg, necroinflammation, and endothelial dysfunction. Stage 2 (Compensated, no esophageal varices [EV]): Displays thin fibrous septa, large regenerative nodules, HVPG 5-10mmHg, and fibrogenesis with cross-linking and angiogenesis. Stage 3 (Compensated, with EV): Shows broad septa, HVPG ≥10mmHg (clinically significant portal hypertension), and parenchymal extinction. Stage 4 (Decompensated): Manifests as ascites, variceal hemorrhage, and hepatic encephalopathy (HE). Histologically, it shows very broad septa, small nodules (micronodular), and an insoluble acellular scar, with HVPG ≥12mmHg. A bottom gradient bar indicates that the probability of 'Spontaneous regression' decreases as the disease advances toward the decompensated stage. This infographic is designed for hepatology education, linking pathophysiology to clinical staging and portal hypertension (PH) severity.](https://cdn.orris.care/cdss_images/pmc_clinical_VQA_9d01130d569bd9b7e77c38276f63c0315581b70be1160718e7924fa61c33b574.jpg)
This Comparison Chart and Timeline illustrates the progression of chronic liver disease (CLD) through four distinct clinical stages, emphasizing the relationship between histology, hemodynamics, and the potential for regression. The illustration features liver icons with circular histological insets and a data table. Stage 1 (Non-cirrhotic): Characterized by steatohepatitis (F1-F3 fibrosis), HVPG <5mmHg, necroinflammation, and endothelial dysfunction. Stage 2 (Compensated, no esophageal varices [EV]): Displays thin fibrous septa, large regenerative nodules, HVPG 5-10mmHg, and fibrogenesis with cross-linking and angiogenesis. Stage 3 (Compensated, with EV): Shows broad septa, HVPG ≥10mmHg (clinically significant portal hypertension), and parenchymal extinction. Stage 4 (Decompensated): Manifests as ascites, variceal hemorrhage, and hepatic encephalopathy (HE). Histologically, it shows very broad septa, small nodules (micronodular), and an insoluble acellular scar, with HVPG ≥12mmHg. A bottom gradient bar indicates that the probability of 'Spontaneous regression' decreases as the disease advances toward the decompensated stage. This infographic is designed for hepatology education, linking pathophysiology to clinical staging and portal hypertension (PH) severity.
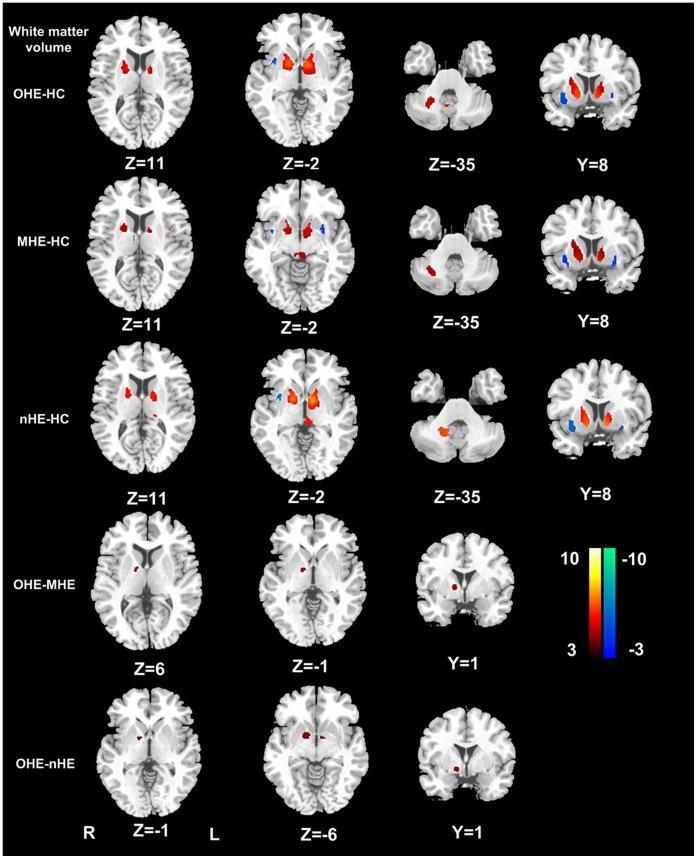
This diagnostic image display consists of axial and coronal MRI brain slices demonstrating voxel-based morphometry (VBM) results of white matter volume (WMV) changes in patients with cirrhosis and varying stages of hepatic encephalopathy (HE). The rows categorize comparisons between overt hepatic encephalopathy (OHE), minimal hepatic encephalopathy (MHE), and non-hepatic encephalopathy (nHE) groups against healthy controls (HC), as well as inter-group comparisons (OHE-MHE and OHE-nHE). A color-coded T-score scale indicates increased WMV in warm colors (red/yellow) and decreased WMV in cool colors (blue). Key findings include significantly increased WMV in the bilateral internal capsules and cerebellum crus (red clusters) across all cirrhotic groups compared to controls, specifically visible at axial slices Z=11, Z=-2, and Z=-35. Decreased WMV is observed in the external capsules (blue clusters), most prominently at slice Y=8. The OHE-MHE and OHE-nHE comparisons highlight localized increases in the internal capsule, suggesting that WMV expansion in these regions correlates with the progression and severity of hepatic encephalopathy.
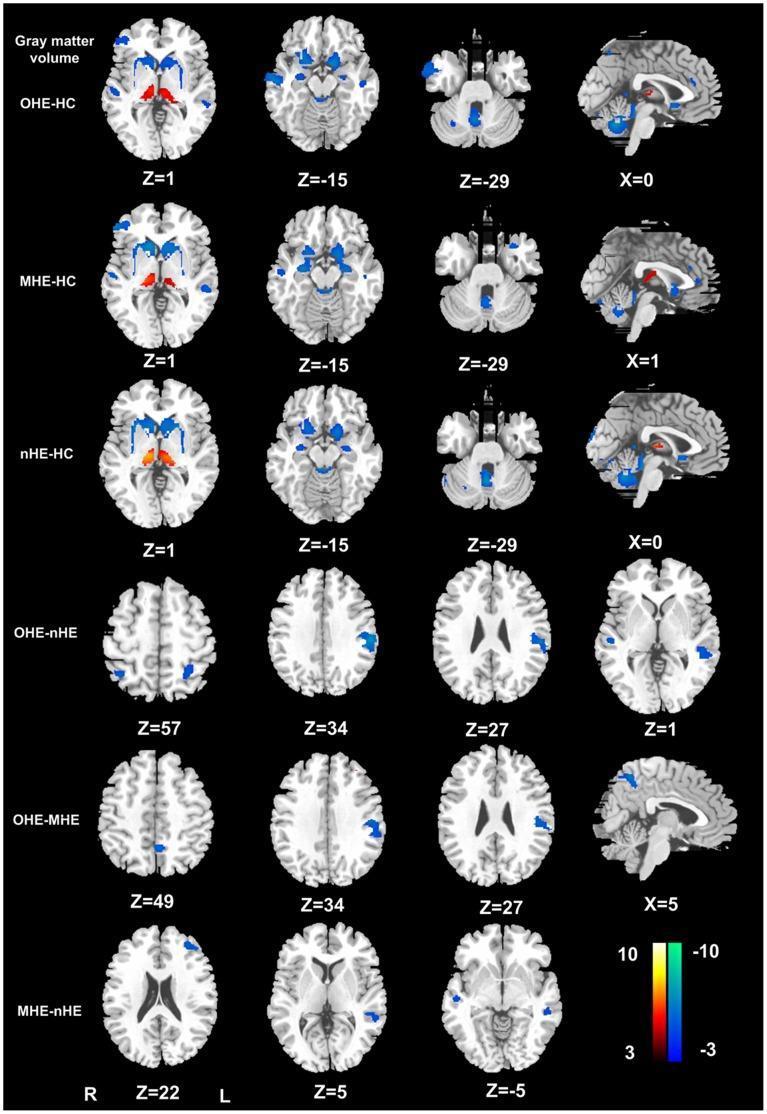
This diagnostic image displays voxel-based morphometry (VBM) results of gray matter volume changes in cirrhotic patients across different stages of hepatic encephalopathy (HE). The figure contains six rows of axial and sagittal brain MRI slices with color-coded statistical parametric maps. Rows 1-3 compare Overt HE (OHE), Minimal HE (MHE), and non-HE (nHE) patients against Healthy Controls (HC). Red/yellow clusters indicate increased gray matter volume, prominently visible in the bilateral thalami across all patient groups compared to controls. Blue clusters signify volume loss, localized primarily in the frontal, parietal, and temporal cortices, as well as the cerebellar vermis. Rows 4-6 present direct inter-group comparisons (OHE-nHE, OHE-MHE, and MHE-nHE), illustrating a progressive reduction in gray matter volume—specifically in frontal and parietal regions—as HE severity increases. A color scale is provided indicating T-values, where positive values (red/yellow) range from 3 to 10 and negative values (blue/cyan) range from -3 to -10. Slices are labeled with Z and X coordinates for anatomical localization, with L and R markers denoting laterality.
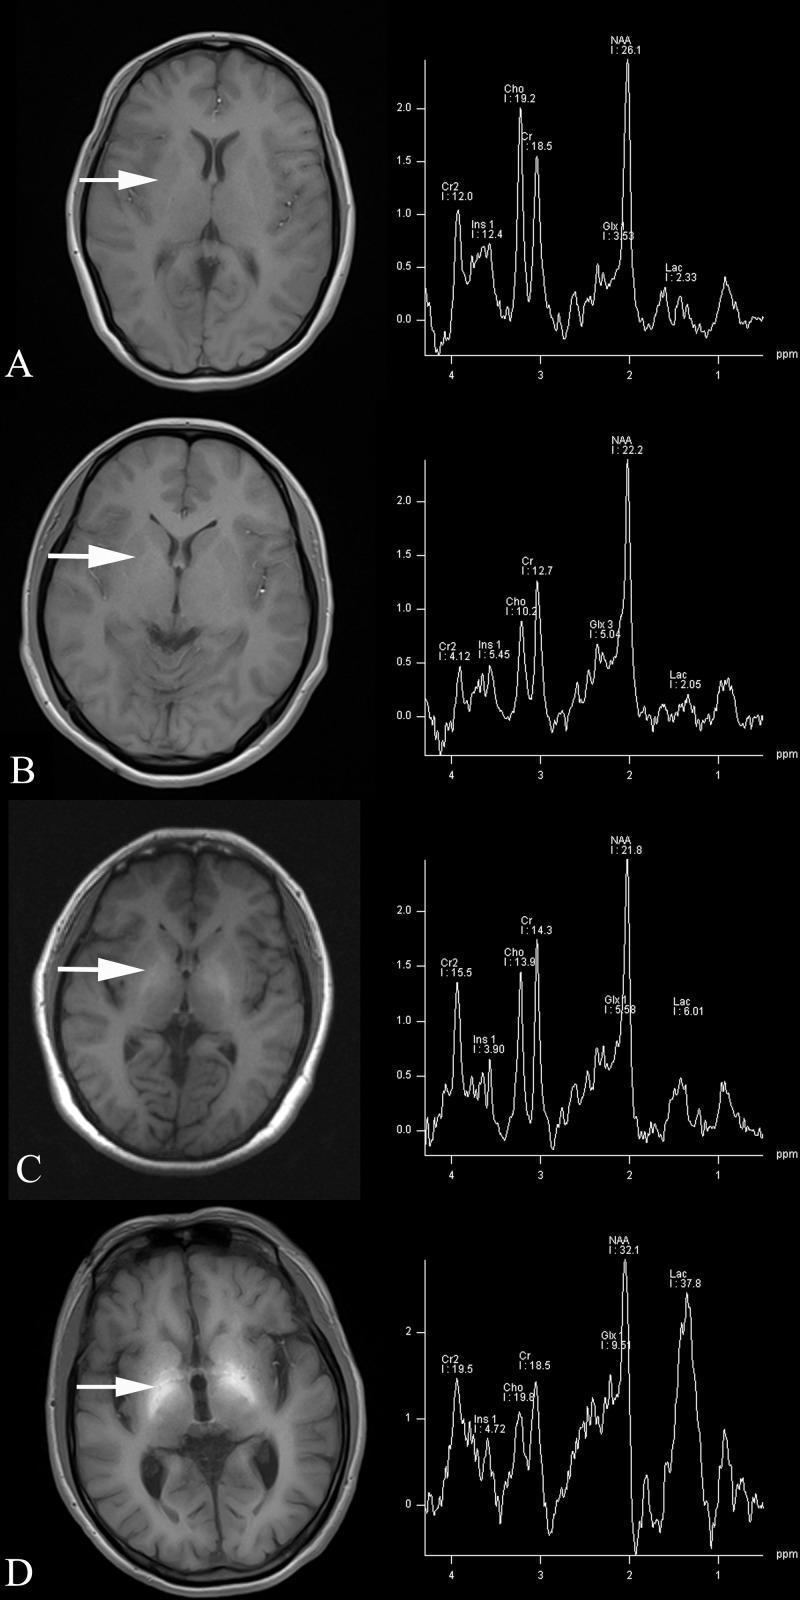
This diagnostic image set compares four axial T1-weighted MRI scans of the brain (A-D) with corresponding Magnetic Resonance Spectroscopy (MRS) plots. The sequence illustrates the progression of portal-systemic encephalopathy (PSE) in patients with chronic hepatic schistosomiasis japonicum (HSJ). In the T1-weighted images, a white arrow indicates the globus pallidus. As pathology progresses from a healthy control (A) to non-PSE (B), covert PSE (C), and overt PSE (D), there is a marked increase in bilateral globus pallidus hyperintensity, often associated with manganese deposition in hepatic failure. The corresponding MRS spectra, with a region of interest in the globus pallidus, demonstrate quantitative metabolic shifts: a progressive increase in glutamate/glutamine (Glx) and lactate (Lac) peaks, alongside a significant reduction in the myo-inositol (mI) peak. These neuroimaging biomarkers reflect osmotic adjustments and metabolic dysfunction characteristic of hepatic encephalopathy stages, providing a visual and biochemical correlation of disease severity.
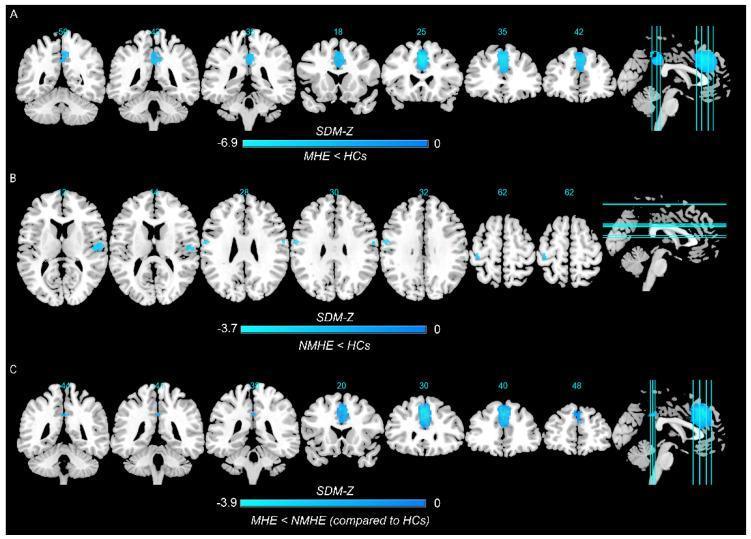
This diagnostic image displays three rows (A, B, C) of axial and sagittal brain fMRI maps illustrating altered spontaneous brain activity in patients with hepatic encephalopathy. The visualization utilizes seed-based d mapping (SDM-Z) scores. Row A compares patients with minimal hepatic encephalopathy (MHE) to healthy controls (HCs), showing significant clusters of decreased activity (represented by cold blue colors) in the left superior frontal gyrus and median cingulate gyri. Row B compares non-MHE cirrhotic patients (NMHE) to HCs, highlighting more localized decreases in activity within the fronto-parietal regions, including the right rolandic operculum and bilateral postcentral gyrus. Row C displays a conjunction analysis between MHE and NMHE patients relative to HCs, emphasizing the progression of neurological impairment. Each row includes multiple axial slices with specific MNI coordinates and a corresponding sagittal reference view indicating slice orientation. These findings serve as neuroimaging biomarkers for detecting and differentiating stages of hepatic encephalopathy in clinical neurology and hepatology.
Stages of Hepatic Encephalopathy
Classification Framework: Four Axes (AASLD/EASL 2014)
| Axis | Categories |
|---|---|
| I - Underlying Disease | Type A (Acute liver failure) / Type B (Portosystemic shunts only) / Type C (Cirrhosis) - most common |
| II - Severity | Minimal HE → Grade 1 → Grade 2 → Grade 3 → Grade 4 |
| III - Time Course | Episodic (>6 months apart) / Recurrent (<6 months apart) / Persistent (chronic low-grade) |
| IV - Precipitant | Precipitated (identifiable trigger) / Non-precipitated |
West Haven Criteria (WHC) - The Standard Grading System
| WHC Grade | Clinical Description | Operative Definition / Key Features |
|---|---|---|
| Minimal (MHE) | Clinically normal mentation; only detectable on formal testing | Abnormal psychometric/neuropsychological tests (e.g., EncephalApp Stroop, PHES score ≤-4, ICT). No asterixis. |
| Grade 1 | Trivial lack of awareness; euphoria or anxiety; shortened attention span; impaired basic arithmetic; altered sleep rhythm | Oriented to time and place; change in baseline cognition/behavior noted by caregivers |
| Grade 2 | Lethargy or apathy; obvious personality change; inappropriate behavior; dyspraxia; asterixis | Oriented to place and person; disoriented to time (≥3 items: day of week, date, month, year) |
| Grade 3 | Somnolence to semi-stupor; responsive to stimuli; gross disorientation; bizarre behavior | Disoriented to place (≥2 items: country, city, state) in addition to time disorientation |
| Grade 4 | Coma | Unresponsive to painful stimuli |
SONIC Classification (Spectrum of Neurocognitive Impairment in Cirrhosis)
| SONIC Category | Corresponds To | Special Tests | Asterixis |
|---|---|---|---|
| Unimpaired | Grade 0 | Normal | Absent |
| Covert HE (CHE) | Minimal HE + Grade 1 | Abnormal (Grade 1) / Abnormal (MHE) | Absent |
| Overt HE (OHE) | Grade 2, 3, 4 | Abnormal | Present (Grade 2+) |
Key distinction: Disorientation to time marks the transition from Covert to Overt HE (Grade 1 → Grade 2). This is the clinically important dividing line.
Management by Grade (in Acute Liver Failure)
- Grade 1: Contact transplant center; baseline CT head
- Grade 2: ICU transfer; neuro checks every hour
- Grade 3: Consider intubation; avoid opioids/benzodiazepines; propofol preferred
- Grade 4: Repeat CT head; consider intracranial pressure monitoring if transplant candidate; treat cerebral edema
Pathophysiology Summary
- Ammonia (gut-derived neurotoxin) metabolized by astrocytes to glutamine, causing astrocyte swelling and cerebral edema
- Abnormal neurotransmission (excess GABA, altered glutamate signaling)
- Altered blood-brain barrier permeability
- Inflammatory cascade (IL-17, oxidative stress)
- Morphologic change: Alzheimer type-2 astrocytes in chronic liver disease
Clinical Pearls
- Mild HE can fluctuate markedly and mimic psychiatric disturbances or acute alcoholism
- In comatose HE patients, pupillary and caloric responses are normal - this distinguishes it from structural brainstem disease (e.g., subdural hematoma, basilar thrombosis)
- Hyperventilation with respiratory alkalosis is a hallmark at all depths of HE coma
- Asterixis (liver flap) appears at Grade 2 and above
- HE is generally reversible with liver transplantation
Cirrhosis Treatment with ASITIS, CAPUT MEDUSA, GRADE 3 ENCEPHALOPATHY, TELENGAECTASIA , ESOPHAGUS VARICOSE, HEPATOMEGALY, SPLENOMEGALY
caput medusae spider telangiectasia cirrhosis clinical signs
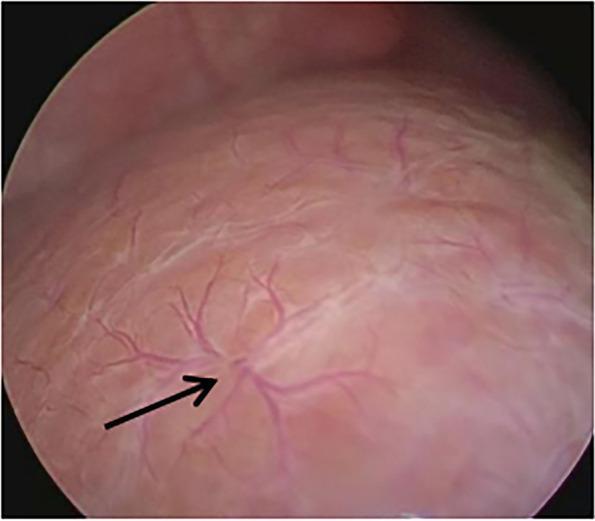
This clinical photograph is a laparoscopic image of the liver surface in a pediatric patient. The imaging demonstrates the 'Hepatic Surface Spider-like Telangiectasia' (HSST) sign, a key diagnostic visual marker for biliary atresia (BA). The liver surface appears relatively smooth and reddish-pink, without overt signs of advanced cirrhosis or nodular fibrosis. A black arrow points to a distinct, tortuous vascular plexus on the capsule. This vascular formation is characterized by a centralized pattern where three or more small, prominent radial branches emerge from a common central point, resembling a spider-like configuration. These telangiectatic vessels are distributed across the liver capsule and are significant clinical indicators used during diagnostic laparoscopy to differentiate BA from other causes of neonatal cholestasis, such as idiopathic neonatal hepatitis or Alagille syndrome, where these specific vascular plexuses are typically absent.
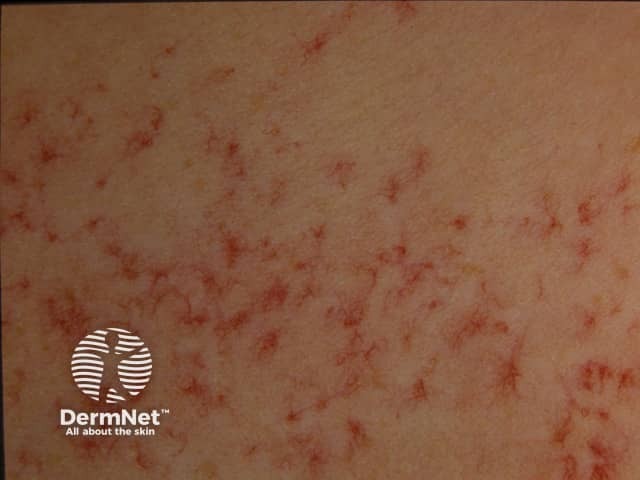
Clinical photography of the cutaneous surface reveals multiple spider telangiectases (spider angiomas) on the trunk. The lesions are characterized by central arteriolar dilation with radiating fine capillaries, producing a red, star-like or spider-web appearance. These blanch with pressure and tend to be bright red to pink. This pattern is typical for telangiectatic cutaneous vascular lesions and is commonly associated with estrogen-dominant states, pregnancy, hormonal therapy, and chronic liver disease with cirrhosis. In the dermatologic context, such findings are important clinical clues; in hepatology, their presence correlates with hyperestrinism and portal hypertension. Differential diagnoses include benign spider nevi vs cherry angiomas, rosacea-related telangiectasia, and congenital vascular malformations. For patients with suspected cirrhosis, these findings warrant clinical correlation and liver function assessment, including AST/ALT, bilirubin, albumin, INR, and imaging as indicated. Overall, spider telangiectases serve as a non-invasive cutaneous biomarker that informs risk stratification for liver disease, guides differential diagnosis, and supports multidisciplinary evaluation for hepatic pathology. In educational and research contexts, this photograph illustrates how cutaneous signs reflect systemic pathology. It may be used to teach correlation between liver disease and dermatologic manifestations, to train natural language processing and image recognition algorithms for vascular lesions, and to support patient counseling about prognosis and monitoring.
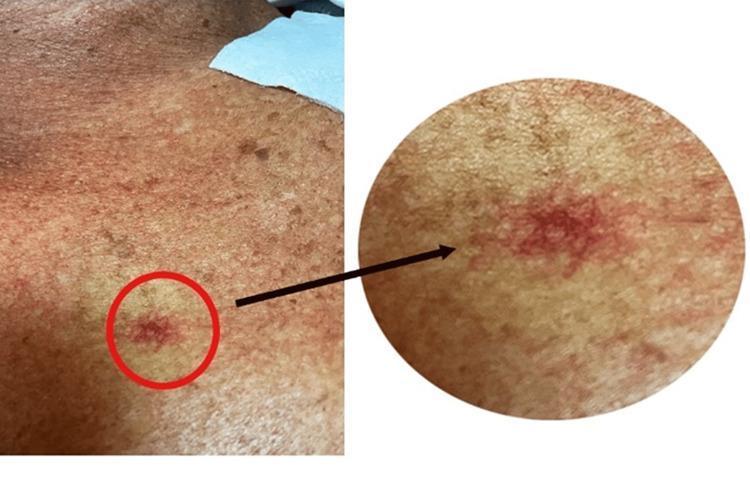
This clinical photograph displays a spider angioma located on the anterior chest wall. The visual consists of a wide-angle view of the skin and a circular magnified inset highlighting the vascular lesion. The spider angioma (also known as spider telangiectasia or nevus araneus) is characterized by a central, prominent red punctum from which small, tortuous capillary vessels radiate outward, mimicking the legs of a spider. The surrounding skin appears tanned and mottled with secondary sun damage and various small hyperpigmented macules. This finding is clinically significant as a cutaneous marker often associated with hyperestrogenic states, such as chronic liver disease (cirrhosis) or pregnancy. The lesion demonstrates blanching upon central pressure, a key diagnostic feature of this vascular malformation. This image is suitable for medical education regarding the physical examination of dermatologic signs of systemic disease and hepatology-related cutaneous manifestations.
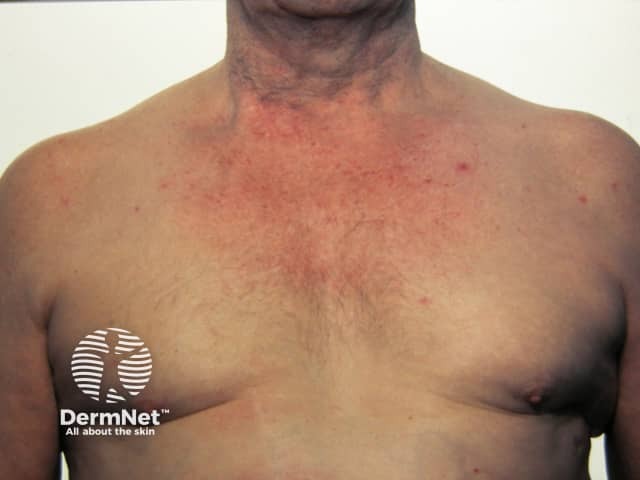
Clinical photography of the anterior chest and neck shows multiple erythematous, pinpoint lesions with radiating fine vessels consistent with spider naevi (spider angiomas). The lesions are small (approximately 1–3 mm), with a central red dot and a starburst pattern of telangiectatic capillaries that blanch on gentle compression. Distribution is predominantly on the upper chest and anterior neck, with some involvement of the shoulders. Surrounding skin is otherwise unremarkable, without edema or induration. This in vivo image demonstrates classic cutaneous telangiectasia arising from dilation of preexisting arterioles and capillary beds, producing the characteristic radiating vascular spokes. Spider naevi are benign vascular lesions commonly seen in young individuals but their multiplicity or new appearance in adults can indicate hormonal influences (estrogen excess) or underlying liver disease (cirrhosis, portal hypertension), pregnancy, or robust sun exposure in combination with vascular fragility. Clinically, identification should prompt correlation for systemic conditions, especially in patients with signs of liver dysfunction or heavy alcohol use. Differential diagnoses include cherry angioma, venous lake, capillary malformation, or telangiectasia related to hereditary hemorrhagic telangiectasia. This image is a useful educational reference for dermatology and internal medicine, illustrating recognition, documentation, and the clinical significance of vascular skin lesions in clinical practice today.
caput medusae abdominal veins portal hypertension
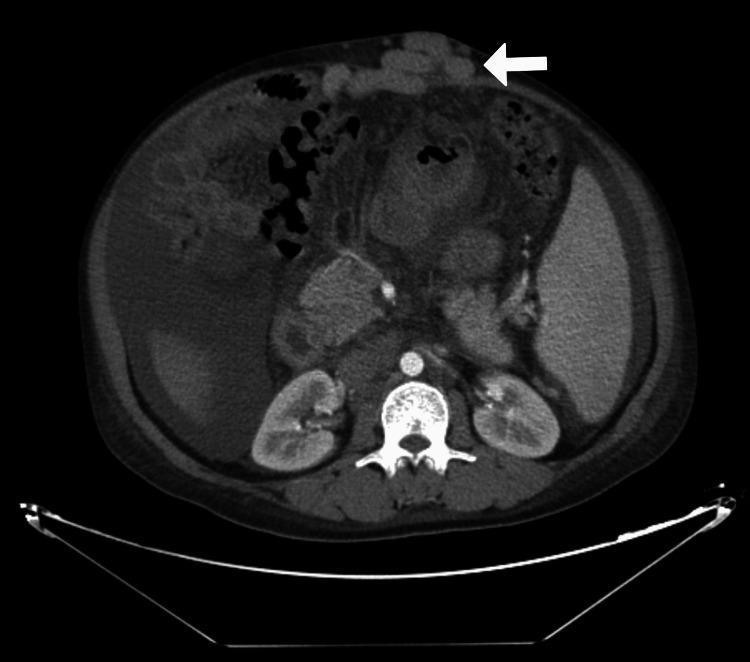
Axial contrast-enhanced CT scan of the abdomen at the level of the kidneys. A prominent white arrow points to significantly dilated, tortuous periumbilical (paraumbilical) veins located within the anterior abdominal wall, representing a 'caput medusae' appearance typical of portal hypertension. The image shows moderate to large volume ascites, visualized as low-attenuation fluid surrounding the liver and spleen. The spleen is noticeably enlarged (splenomegaly). Other visualized structures include the liver, both kidneys, the vertebral column with the adjacent abdominal aorta and inferior vena cava, and bowel loops. This diagnostic image is characteristic of chronic liver disease with secondary portal hypertension and established collateral venous circulation.
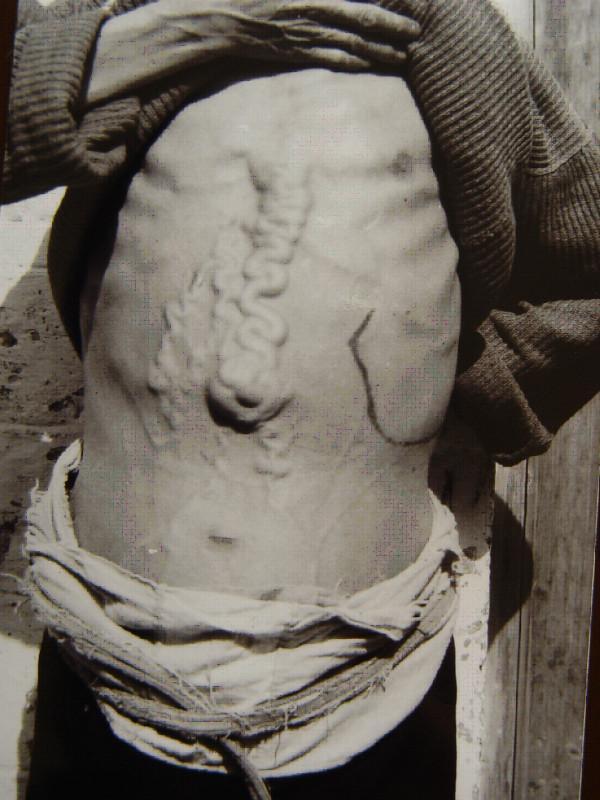
This clinical photograph displays the abdominal region of a patient with advanced schistosomiasis, illustrating severe portal hypertension. The most prominent feature is the presence of massively dilated and tortuous abdominal collateral veins (caput medusae) originating from the epigastric region and extending toward the umbilicus. A central, large, rope-like vein exhibits extreme serpentine morphology along the midline. On the left side of the abdomen (patient's left), an ink marking outlines the margin of a significant megalosplenia (enlarged spleen), extending well below the costal margin. The abdomen appears distended, suggestive of underlying ascites. These clinical signs—prominent venous collaterals and splenomegaly—are classic manifestations of late-stage hepatic schistosomiasis, where fibrotic changes in the liver obstruct portal blood flow, forcing the development of systemic-portal shunts and causing congestive splenomegaly. This image serves as an educational example of the physical examination findings associated with chronic hepatosplenic parasitic infections and secondary portal hypertensive syndrome.
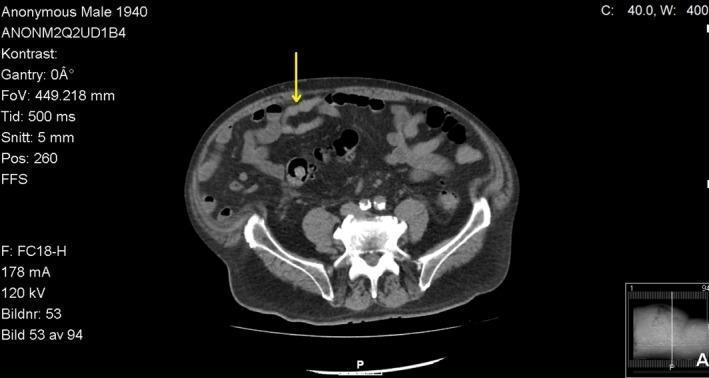
This diagnostic image is an axial non-contrast computerized tomography (CT) scan of the lower abdomen and upper pelvis. The scan demonstrates significant pathology consistent with portal hypertension. A prominent yellow arrow indicates dilated, tortuous paraumbilical veins (caput medusae) located within the anterior abdominal wall. These collateral vessels appear as tubular, soft-tissue density structures protruding through the subcutaneous fat near the midline. Key anatomical landmarks visible include the iliac wings, the sacrum, the vertebral body, and loops of both small and large bowel with intraluminal gas. The abdominal wall musculature is clearly defined. This image serves as a clinical illustration of portosystemic shunting, specifically the recanalization of the ligamentum teres, commonly seen in advanced liver cirrhosis. It is intended for intermediate to advanced medical learners studying hepatology, gastroenterology, and diagnostic radiology.
Understanding the Clinical Signs
1. Caput Medusae
2. Telangiectasia (Spider Angiomata)
The Major Complications Requiring Treatment
A. ASCITES
| Step | Intervention | Details |
|---|---|---|
| 1. Sodium restriction | Low-sodium diet | <2000 mg Na/day |
| 2. Diuretics | Spironolactone + Furosemide | Spironolactone 100 mg/day (aldosterone antagonist, first-line) + Furosemide 40 mg/day PO. Titrate in 100:40 mg ratio to maintain normokalemia |
| 3. Large-volume paracentesis (LVP) | Remove ≥5 L of fluid | Standard for refractory/tense ascites. Albumin replacement: 8 g per liter removed to prevent paracentesis-induced circulatory dysfunction (PICD) |
| 4. TIPS (Transjugular Intrahepatic Portosystemic Shunt) | Radiological shunt | For refractory ascites unresponsive to diuretics |
| 5. Liver transplantation | Definitive | All patients with ascites should be evaluated - 5-year survival without transplant is only 30-40% |
B. ESOPHAGEAL VARICES
Acute Bleeding Management:
- Airway - Intubation if Grade 3-4 encephalopathy or active hematemesis (aspiration risk)
- Resuscitation - IV access, blood transfusion (target Hb ~7-8 g/dL; over-transfusion worsens portal pressure)
- Vasoactive drugs (start immediately, continue 3-5 days):
- Octreotide: 50 µg IV bolus, then 50 µg/hr continuous infusion for up to 5 days - Sleisenger and Fordtran's, p. 318
- Alternatives: Somatostatin, Terlipressin (not available in USA)
- Endoscopic Variceal Ligation (EVL) - Gold standard; band ligation at time of diagnostic endoscopy
- Antibiotics - Ceftriaxone or norfloxacin for 7 days (reduces SBP risk and mortality in cirrhotics with variceal bleed)
- Coagulopathy correction:
- Platelets if count <50,000/mm³
- Cryoprecipitate (1 unit/10 kg) if fibrinogen <100 mg/dL
- Recombinant Factor VIIa for severe ongoing bleeding with irreversible coagulopathy
- TIPS - Rescue therapy for uncontrolled bleeding or early rebleed
Primary and Secondary Prophylaxis (Non-Bleeding):
- Non-selective beta-blockers (propranolol or nadolol) - reduce portal pressure; first-line for primary prophylaxis of variceal bleeding
- EVL - repeated sessions every 2-4 weeks until varices eradicated
- TIPS - for refractory varices
C. GRADE 3 HEPATIC ENCEPHALOPATHY
Immediate Priorities:
- Airway assessment first - Grade 3 HE carries high aspiration risk; consider intubation
- Avoid CNS depressants - no opioids, no benzodiazepines; if sedation needed, prefer propofol (short half-life)
- Identify and correct precipitating factors: - Rosen's Emergency Medicine, p. 1249
- GI bleeding (most common)
- Hypokalemia, alkalosis
- Infections (SBP, UTI, pneumonia)
- Constipation
- Dehydration / azotemia
- Medications (diuretics, narcotics, sedatives)
Pharmacological Treatment:
| Drug | Dose | Mechanism |
|---|---|---|
| Lactulose (first-line) | 30-60 g oral (or 200 g rectal enema in obtunded patients); titrate to 2-3 loose stools/day | Osmotic cathartic + reduces colonic pH → traps NH₃ as NH₄⁺ in stool |
| Rifaximin (preferred antibiotic) | 550 mg PO twice daily | Minimally absorbed; reduces ammonia-producing gut bacteria; preferred over neomycin |
| Neomycin (if rifaximin unavailable) | 250 mg PO q6-12h (max 4g/day) | Kills urease-producing bacteria; risk of oto/nephrotoxicity |
| Branched-chain amino acids (BCAA) | IV infusion | Benefit shown in trials; reduces encephalopathy without increasing mortality |
| L-Ornithine L-Aspartate (LOLA) | IV or oral | Lowers postprandial ammonia; useful post-TIPS |
| Zinc supplementation | Oral | Ammonia metabolism requires zinc; deficient in cirrhosis |
| Probiotics (adjunct) | e.g., Lactobacillus acidophilus | Replaces urease-producing bacteria; Cochrane review shows benefit for overt HE |
Grade 3 HE generally requires ICU admission with close neurological monitoring.
D. HEPATOMEGALY AND SPLENOMEGALY
- Hepatomegaly in cirrhosis may actually give way to a shrunken liver as disease progresses
- Splenomegaly causes hypersplenism (thrombocytopenia, leukopenia) - relevant for coagulopathy management during variceal bleeding
- TIPS can partially reduce splenomegaly by lowering portal pressure
Overall Management Framework
DECOMPENSATED CIRRHOSIS
        │
        ├── Treat precipitants (infection, bleeding, drugs, electrolytes)
        │
        ├── Calculate MELD score → guides transplant priority
        │   (uses: creatinine + bilirubin + INR + sodium)
        │
        ├── Ascites → Na restriction + spironolactone/furosemide → LVP + albumin → TIPS
        │
        ├── Varices (bleeding) → Octreotide + EVL + antibiotics → TIPS if failure
        │
        ├── Grade 3 HE → Airway → Lactulose + Rifaximin → Correct precipitant
        │
        └── Liver Transplant Evaluation (definitive therapy for all)
Key Drug Summary
| Drug | Indication | Dose |
|---|---|---|
| Spironolactone | Ascites | 100 mg/day PO (up to 400 mg) |
| Furosemide | Ascites (with spironolactone) | 40 mg/day PO (up to 160 mg) |
| Albumin | Post-LVP, SBP | 8 g/L fluid removed; 1.5 g/kg on day 1 of SBP |
| Octreotide | Acute variceal bleeding | 50 µg IV bolus → 50 µg/hr x 5 days |
| Propranolol/Nadolol | Variceal prophylaxis | Titrate to reduce HR by 25% |
| Lactulose | Hepatic encephalopathy | 30-60 g PO or 200 g PR; target 2-3 stools/day |
| Rifaximin | HE (maintenance/recurrence prevention) | 550 mg PO twice daily |
| Ceftriaxone | SBP prophylaxis (variceal bleed) | 1 g IV daily x 7 days |