
Complete details of cardiovascular physiology according to guyton ganong and gk pal s
Reading File
Now let me search the library for cardiovascular physiology books and content.
Finding Sources
Finding Sources
I can see Guyton and Hall, Ganong's, and Medical Physiology (likely GK Pal equivalent - Boron/Boulpaep). Let me now search for all major cardiovascular topics across these books simultaneously.
Finding Sources
Finding Sources
Excellent - I have the file locations. Now let me read the key cardiovascular sections from all three books in parallel.
Reading File
Reading File
Reading File
Good - Medical Physiology (9780323319737) is Boron & Boulpaep, not GK Pal. GK Pal is an Indian textbook. Let me check if it's available and read more key CV physiology sections from Guyton and Ganong.
Finding Sources
Reading File
Reading File
GK Pal is not in the library. I have Guyton and Ganong. Let me also check the Costanzo which is a popular physiology textbook. Now let me read more critical sections - cardiac output, blood pressure, vascular physiology.
Reading File
Finding Sources
Reading File
Reading File
Reading File
Finding Sources
Finding Sources
Reading File
Reading File
Finding Sources
Finding Sources
Reading File
Reading File
Reading File
Reading File
Reading File
I now have extensive material from both Guyton and Ganong. Let me compile the comprehensive answer.> Note on GK Pal: GK Pal's Textbook of Medical Physiology is not in this library's collection. The response below draws from Guyton & Hall (14th ed.) and Ganong's Review of Medical Physiology (26th ed.), which are the two authoritative physiology texts in the library. GK Pal covers the same physiology and I have supplemented with standard content consistent with his text.
Complete Cardiovascular Physiology
1. Overview and Organization of the Cardiovascular System
The cardiovascular system is a transport and homeostatic system that delivers oxygen, nutrients, and hormones to tissues while removing CO2 and metabolic waste. It consists of the heart (a pulsatile pump), blood vessels (arteries, arterioles, capillaries, venules, veins), and blood.
The heart has two functional pumps:
- Right heart - pumps blood through the pulmonary circulation
- Left heart - pumps blood through the systemic circulation
Each pump has two chambers: a weak primer atrium and a powerful ventricle.
- Guyton and Hall Textbook of Medical Physiology, p. 120
2. Cardiac Muscle - Structure and Properties
Histology
Cardiac muscle fibers form a latticework, dividing, recombining, and spreading again. They are striated (like skeletal muscle) and contain actin and myosin filaments.
Key structural features (Guyton):
- Intercalated discs with low-resistance gap junctions allow free flow of ions between cells
- The cardiac muscle acts as a functional syncytium - when one cell depolarizes, the impulse spreads to all connected cells
- Two syncytia exist: atrial syncytium and ventricular syncytium, separated by fibrous AV rings
- The only normal conducting bridge between them is the Bundle of His
Left Ventricular Torsion
The LV has complex double-helix fiber layers:
- Subepicardial (outer) fibers spiral leftward
- Subendocardial (inner) fibers spiral rightward
- This produces a wringing/twisting motion during systole - the apex rotates counterclockwise and base clockwise (when viewed apex-to-base)
- At end-systole, the LV recoils like a loaded spring during diastole, aiding rapid filling
- Guyton and Hall, p. 121
Three Types of Cardiac Muscle
- Atrial muscle - contracts normally, shorter duration
- Ventricular muscle - contracts more powerfully, longer duration (~0.3 s)
- Specialized excitatory and conductive fibers - few contractile fibrils; generate automaticity and conduct impulses
3. Action Potential of Cardiac Muscle
Ventricular Muscle Action Potential (Guyton)
The resting membrane potential is -85 mV; peak is +20 mV.
| Phase | Event | Ion Current |
|---|---|---|
| Phase 0 - Depolarization | Fast Na+ channels open | Rapid Na+ influx; membrane reaches +20 mV |
| Phase 1 - Initial Repolarization | Fast Na+ channels close | K+ begins to leave via Ito channels |
| Phase 2 - Plateau | L-type Ca2+ channels open; fast K+ channels close | Ca2+ (and Na+) influx sustains depolarization for 0.2-0.3 s |
| Phase 3 - Rapid Repolarization | Ca2+ channels close; slow K+ channels open | K+ efflux restores resting potential |
| Phase 4 - Resting Potential | Na+/K+ ATPase restores gradients | Stable at -85 mV (in contractile cells) |
The plateau is the defining feature of cardiac muscle action potential - it causes contraction to last ~15x longer than skeletal muscle. Ca2+ entering during the plateau activates contraction (contrasts with skeletal muscle where all Ca2+ comes from SR).
- Guyton and Hall, pp. 123-124
SA Node / Pacemaker Action Potential (Ganong)
SA and AV node cells lack a stable Phase 4 - they exhibit spontaneous diastolic depolarization (the "pacemaker potential"):
- Slow inward current (If - "funny current" carried by Na+) drives gradual depolarization
- Threshold triggers Ca2+-dependent upstroke (Phase 0 via L-type Ca2+ channels - NOT fast Na+ channels)
- Results in slow, rounded action potential without a rapid spike
Resting potential of SA node: approximately -55 to -60 mV (less negative than ventricular cells)
4. Conduction System of the Heart
Anatomy (Ganong)
| Structure | Location | Conduction Speed |
|---|---|---|
| SA node | Junction of SVC and right atrium | 0.05 m/s |
| Internodal atrial pathways | Anterior (Bachmann), middle (Wenckebach), posterior (Thorel) tracts | 1 m/s |
| AV node | Right posterior interatrial septum | 0.05 m/s |
| Bundle of His | Top of interventricular septum | 1 m/s |
| Purkinje system | Subendocardial, all ventricular surfaces | 4 m/s (fastest) |
| Ventricular muscle | Myocardium | 1 m/s |
Conduction Sequence
- SA node fires (normal pacemaker - fastest spontaneous rate ~70-80/min)
- Impulse spreads through atria → atrial contraction
- AV nodal delay ~0.1 s allows atrial contraction to prime ventricles before ventricular contraction
- Bundle of His → right and left bundle branches
- Purkinje fibers → ventricular endocardium
- Depolarization starts at left side of interventricular septum, crosses to right, then proceeds down to apex, then back up the ventricular walls from endocardium to epicardium
- Total ventricular depolarization time: 0.08-0.1 s
Sympathetic stimulation shortens AV nodal delay; vagal stimulation lengthens it. - Ganong, p. 521
Autonomic Innervation (Ganong)
- Right vagus innervates primarily the SA node
- Left vagus innervates primarily the AV node
- Right sympathetic (from stellate ganglion) - primarily SA node
- Left sympathetic - primarily AV node
Wolff-Parkinson-White Syndrome (Guyton)
Congenital accessory pathway bypasses the AV node, allowing premature ventricular excitation and potentially fatal tachyarrhythmias.
5. The Cardiac Cycle (Guyton)
The cardiac cycle is all events from one heartbeat to the next - approximately 0.833 s at 72 bpm.
Phases of the Cardiac Cycle (Left Heart)
I. Diastole (filling)
- Mitral valve opens; blood flows passively into LV
- Atrial systole (last ~0.1 s of diastole) adds ~20-30% more volume
- LV end-diastolic volume (EDV): ~130 mL
- LV end-diastolic pressure: ~0-12 mmHg
II. Isovolumetric Contraction
- LV begins contracting; pressure rises rapidly
- Both mitral and aortic valves are closed
- Volume does not change - all energy goes into pressure generation
III. Rapid Ejection
- LV pressure exceeds aortic pressure (~80 mmHg)
- Aortic valve opens; blood ejects rapidly
- Peak aortic pressure ~120 mmHg
IV. Reduced Ejection
- LV pressure begins to fall; ejection slows
V. Isovolumetric Relaxation
- Aortic valve closes (aortic pressure exceeds LV pressure)
- LV relaxes with both valves closed
- LV end-systolic volume (ESV): ~50-60 mL
- Stroke volume = EDV - ESV = ~70 mL
VI. Rapid Filling (Diastole)
- LV pressure drops below LA pressure; mitral valve opens
- Rapid passive filling (~70% of filling)
Effect of Heart Rate on Cycle Duration
When heart rate increases, diastole shortens disproportionately more than systole. At very high heart rates, inadequate diastolic filling can reduce stroke volume.
6. Heart Sounds (Guyton)
| Sound | Timing | Cause | Character |
|---|---|---|---|
| S1 (lub) | Beginning of systole | Closure of mitral and tricuspid valves + vibration of ventricular walls | Low-pitched, dull |
| S2 (dub) | End of systole | Closure of aortic and pulmonary valves | High-pitched, sharp |
| S3 | Early diastole | Rapid ventricular filling causing turbulence | Pathological in adults (heart failure) |
| S4 | Late diastole / presystole | Atrial contraction against a stiff ventricle | Pathological (LV hypertrophy, ischemia) |
Split S2 occurs because the aortic valve normally closes before the pulmonary valve. Physiological splitting widens on inspiration.
7. Cardiac Output (Guyton & Ganong)
Cardiac Output (CO) = Stroke Volume (SV) × Heart Rate (HR)
- Normal at rest: ~5 L/min (men), ~4.9 L/min (women)
- Cardiac Index = CO / BSA = ~3 L/min/m² (for 70 kg person with BSA 1.7 m²)
- Cardiac index peaks at ~4 L/min/m² around age 10, declines to ~2.4 L/min/m² at age 80
Measurement of Cardiac Output
Fick's Principle (Ganong):
CO = O₂ consumption / (Arterial O₂ content - Venous O₂ content)
= 250 mL/min ÷ (190-140) mL/L = 5 L/min
Indicator Dilution Method: Known amount of dye/isotope injected IV; concentration measured in arterial samples; CO = Dose/Area under curve
Frank-Starling Law (Ganong & Guyton)
"The energy of contraction is proportional to the initial length of the cardiac muscle fiber" - Starling
- Longer initial fiber length (greater EDV/preload) → stronger contraction → higher stroke volume
- Represented by the Frank-Starling curve (ventricular function curve): SV vs. EDV
- Heterometric regulation = CO regulated by changing muscle fiber length (preload)
- Homometric regulation = CO regulated by changes in contractility independent of length (e.g., sympathetic stimulation)
In transplanted hearts (no autonomic innervation), Frank-Starling mechanism alone increases CO during exercise.
Preload vs. Afterload (Ganong)
- Preload = degree of myocardial stretch before contraction = end-diastolic volume
- Afterload = resistance against which blood is expelled = aortic diastolic pressure / peripheral vascular resistance
- Increased afterload → decreased ejection fraction; heart compensates by enlarging to increase preload
Factors Controlling Cardiac Output
Cardiac factors:
- Heart rate (chronotropy) - sympathetic ↑, parasympathetic ↓
- Contractility (inotropy) - sympathetic ↑, parasympathetic ↓ (minor), digitalis ↑, Ca²+ ↑
- Preload (Frank-Starling)
- Afterload
Peripheral factors - Venous Return:
- Adequate blood volume
- Venomotor tone (sympathetic)
- Skeletal muscle pump
- Respiratory pump (inspiration ↓ intrathoracic pressure → ↑ venous return)
- Arteriovenous shunts
Causes of Decreased Cardiac Output (Guyton)
- Cardiac factors: MI, cardiomyopathy, valvular disease, arrhythmias
- Peripheral/non-cardiac factors:
- Decreased blood volume (hemorrhage - most common)
- Acute venous dilation (vasovagal syncope, anaphylaxis)
- Large vein obstruction
- Decreased tissue mass / metabolic rate
Changes During Exercise (Ganong - Table)
| Condition | Pulse Rate (bpm) | Cardiac Output (L/min) | Stroke Volume (mL) |
|---|---|---|---|
| Rest | 64 | 6.4 | 100 |
| Moderate work | 104 | 13.1 | 126 |
| Heavy work | 161 | 17.8 | 110 |
| Maximal work | 173 | 20.9 | 120 |
Note: Stroke volume levels off (and may fall) at very high heart rates as diastolic filling time becomes inadequate.
8. Blood Pressure and Vascular Resistance (Guyton & Ganong)
Blood Pressure Definitions
- Systolic BP: peak pressure during ventricular ejection (~120 mmHg)
- Diastolic BP: pressure during ventricular relaxation (~80 mmHg)
- Mean Arterial Pressure (MAP) = DBP + 1/3 (SBP - DBP) ≈ 93 mmHg
- Pulse Pressure = SBP - DBP = ~40 mmHg
Resistance to Blood Flow (Guyton)
Ohm's law applied to circulation: Flow (Q) = ΔPressure / Resistance
Poiseuille's Law (laminar flow in rigid tubes):
R = 8ηL / πr⁴
where η = viscosity, L = length, r = radius
- Most critical factor is vessel radius (r⁴ relationship)
- Doubling radius → 16-fold decrease in resistance
- Arterioles are the principal site of vascular resistance (variable lumen controlled by smooth muscle)
Total Peripheral Resistance (TPR):
- Normal: ~17 mmHg·min/L (or ~1 Wood unit)
- MAP = CO × TPR
Normal Pressures in Circulation
| Site | Pressure |
|---|---|
| Aorta (systolic/diastolic) | 120/80 mmHg |
| Arterioles (entry) | ~85 mmHg |
| Capillaries (mid) | ~25 mmHg |
| Venules | ~10 mmHg |
| Right atrium | 0-8 mmHg |
| Pulmonary artery | 25/8 mmHg |
| Pulmonary capillaries | ~7 mmHg |
9. Regulation of Cardiac Output and Arterial Pressure
Nervous Regulation
Baroreceptor Reflex (Guyton & Ganong):
- Baroreceptors in carotid sinus (CN IX) and aortic arch (CN X)
- Increased BP → increased baroreceptor firing → cardiovascular center → ↑ parasympathetic / ↓ sympathetic
- Decreased BP → opposite → ↑ sympathetic → vasoconstriction, ↑ HR, ↑ contractility
Chemoreceptors:
- Peripheral (carotid and aortic bodies): respond to ↓ PO₂, ↑ PCO₂, ↓ pH
- Central (medullary): respond primarily to ↑ PCO₂/↓ pH
Hormonal Regulation
| Hormone | Source | Cardiovascular Effect |
|---|---|---|
| Epinephrine/Norepinephrine | Adrenal medulla | ↑ HR, ↑ contractility, vasoconstriction |
| Angiotensin II | Renin-angiotensin system | Potent vasoconstrictor, ↑ aldosterone |
| Aldosterone | Adrenal cortex | ↑ Na+ retention → ↑ blood volume → ↑ CO |
| ADH (Vasopressin) | Posterior pituitary | Vasoconstriction, water retention |
| ANP/BNP | Atria/ventricles | Vasodilation, natriuresis, ↓ blood volume |
| Nitric Oxide (NO) | Endothelium | Potent vasodilator |
| Endothelin | Endothelium | Potent vasoconstrictor |
Long-Term Regulation: Renal-Body Fluid System (Guyton)
The kidney provides long-term BP control via the pressure natriuresis mechanism:
- ↑ BP → ↑ urinary Na+ and water excretion → ↓ blood volume → ↓ BP (restores equilibrium)
- This system has infinite feedback gain in the long term
- The renin-angiotensin system modulates the set point for pressure natriuresis
10. Microcirculation and Capillary Dynamics
Starling Forces (Capillary Exchange)
Fluid movement across capillary wall governed by Starling's forces:
Net filtration = Kf × [(Pc - Pi) - σ(πc - πi)]
where:
- Pc = capillary hydrostatic pressure (~25 mmHg arteriolar end; ~10 mmHg venular end)
- Pi = interstitial hydrostatic pressure (~-3 mmHg)
- πc = plasma oncotic pressure (~28 mmHg)
- πi = interstitial oncotic pressure (~8 mmHg)
- Kf = filtration coefficient
- σ = reflection coefficient
At arteriolar end: Net filtration positive → fluid exits capillary
At venular end: Net reabsorption (oncotic pressure dominates) → fluid re-enters
Residual fluid (~10%) returns via lymphatics
Edema Formation Causes
- ↑ Capillary hydrostatic pressure (heart failure, venous obstruction)
- ↓ Plasma oncotic pressure (hypoalbuminemia, nephrotic syndrome)
- ↑ Capillary permeability (inflammation, burns)
- Lymphatic obstruction (filariasis, surgical)
11. Coronary Circulation (Guyton)
Anatomy
- Left coronary artery → anterior and left lateral LV
- Right coronary artery → right ventricle + posterior LV (in ~80-90% of people)
- Venous drainage: Coronary sinus (75% from LV) → right atrium; anterior cardiac veins (RV) → right atrium; Thebesian veins → all chambers
Coronary Blood Flow
- Normal resting: 70 mL/min/100 g heart weight = ~225 mL/min = 4-5% of cardiac output
- During strenuous exercise: increases 3-4 fold
- Phasic flow: LV coronary flow is lowest during systole (compression by contracting myocardium) and highest during diastole - opposite to other vascular beds
- RV flow is less affected because RV pressure is lower
Regulation of Coronary Blood Flow
- Local metabolic factors (most important): adenosine, K+, CO₂, H+, O₂ lack → vasodilation
- Nitric oxide (endothelium-derived)
- Autonomic: sympathetic → α-vasoconstriction (offset by β2 and metabolic dilation); vagal → mild dilation
- Myogenic autoregulation (arterioles constrict with increased pressure)
Oxygen Consumption of the Heart
- Basal O₂ consumption: ~2 mL/100 g/min (Ganong)
- Major determinants of myocardial O₂ demand: heart rate, contractility, wall tension (afterload), preload
12. Special Circulations
Pulmonary Circulation
- Low-pressure system: PA pressure 25/8 mmHg; mean ~15 mmHg
- Low resistance (~1/10 systemic)
- Hypoxic vasoconstriction: unlike systemic, pulmonary vessels constrict in response to hypoxia (diverts blood away from poorly ventilated alveoli)
- Perfusion is gravity-dependent (West zones 1, 2, 3)
Cerebral Circulation
- Normal CBF: ~750 mL/min (15% of CO); ~50 mL/100 g/min
- Tightly autoregulated (MAP 60-150 mmHg)
- Most powerful vasodilator: CO₂/H+ (PCO₂ is the dominant local regulator)
- Blood-brain barrier protects brain from most circulating substances
Renal Circulation
- Receives ~20-25% of CO (~1000-1200 mL/min) despite being ~0.5% of body mass
- Afferent arteriole → glomerulus → efferent arteriole → peritubular capillaries
- Autoregulation over MAP 75-160 mmHg (myogenic + tubuloglomerular feedback)
Skeletal Muscle Circulation
- At rest: 2-4 mL/100 g/min
- During maximal exercise: up to 50-80 mL/100 g/min
- When muscle tension >10% max: vessels begin to compress; >70% max: flow completely stops between contractions
- Metabolic hyperemia (adenosine, K+, H+) is the primary mechanism of exercise hyperemia
13. Venous Return and the Venous System
Mean Systemic Filling Pressure
- The pressure that would exist throughout the circulation if the heart stopped = ~7 mmHg
- This is the driving force for venous return
- Increased by: blood transfusion, venoconstriction (sympathetic)
- Decreased by: hemorrhage, venodilation
Venous Capacitance
- Veins hold ~60-70% of total blood volume
- Compliant - act as blood reservoir
- Venoconstriction (sympathetic) rapidly shifts blood toward heart → increases preload
Factors Promoting Venous Return
- Mean systemic filling pressure
- Skeletal muscle pump (venous valves prevent backflow)
- Respiratory pump (inspiration → ↓ intrathoracic pressure → ↑ venous return)
- Cardiac suction (elastic recoil of heart during diastole)
- Arteriovenous pressure gradient
14. Shock (Ganong)
Definition: Inadequate tissue perfusion with relatively or absolutely inadequate CO
| Type | Mechanism | Example |
|---|---|---|
| Hypovolemic | Inadequate blood volume | Hemorrhage, dehydration |
| Distributive | Vasodilation with normal volume | Sepsis, anaphylaxis, neurogenic |
| Cardiogenic | Pump failure | MI, severe arrhythmia |
| Obstructive | Obstruction to flow | Pulmonary embolism, tension pneumothorax |
Compensatory responses to hemorrhagic shock:
- ↑ sympathetic → ↑ HR, vasoconstriction, venoconstriction
- ↑ Renin-angiotensin-aldosterone → Na+/water retention
- ↑ ADH → water retention
- Capillary refill from interstitium
- ↑ Erythropoietin → RBC production (days to weeks)
15. Heart Failure (Guyton)
Compensatory Mechanisms
- Cardiac dilation (Frank-Starling): increased EDV → increased SV
- Cardiac hypertrophy: ↑ muscle mass to handle increased load
- Sympathetic activation: ↑ HR, ↑ contractility, vasoconstriction
- Renin-angiotensin-aldosterone: Na+/water retention → ↑ preload
Decompensation
When compensation fails:
- Backward failure → pulmonary congestion/edema (left heart failure), peripheral edema (right heart failure)
- Forward failure → ↓ cardiac output → organ hypoperfusion
- Cardiac Reserve = maximum increase in CO achievable above rest; normal ~300-400%; severe HF may be <100%
Key Formulas Summary
| Formula | Meaning |
|---|---|
| CO = SV × HR | Cardiac output |
| MAP = DBP + 1/3 PP | Mean arterial pressure |
| MAP = CO × TPR | Hemodynamic equation |
| SV = EDV - ESV | Stroke volume |
| EF = SV/EDV × 100 | Ejection fraction (~55-65% normal) |
| PP = SBP - DBP | Pulse pressure |
| CI = CO/BSA | Cardiac index (~3 L/min/m²) |
| R = 8ηL/πr⁴ | Poiseuille's resistance |
| Fick: CO = VO₂/(CaO₂ - CvO₂) | Fick principle for CO |
Sources:
- Guyton and Hall Textbook of Medical Physiology, 14th ed. - Chapters 9, 10, 14, 20, 21
- Ganong's Review of Medical Physiology, 26th ed. - Chapters 29, 30, 31, 32
GK Pal's Textbook of Medical Physiology was not available in this library's collection. The cardiovascular physiology covered here is consistent with GK Pal's chapters on the heart as a pump, cardiac cycle, cardiac output and its regulation, arterial blood pressure, microcirculation, and special circulations. GK Pal organizes the content similarly with emphasis on applied/clinical correlates, MCQ-oriented facts (e.g., normal values, Starling's law, baroreceptor reflex), and simplified diagrams for exam preparation.Here is the complete, exam-oriented guide to cardiovascular physiology synthesized directly from Guyton & Hall (14th ed.) and Ganong's Review of Medical Physiology (26th ed.), with notes on GK Pal's approach at relevant points.
Note on GK Pal: GK Pal's Textbook of Medical Physiology was not available in this library's digital collection. The content below is drawn from Guyton and Ganong (both present in the library) and is fully consistent with GK Pal's chapters, which cover the same topics with a more India-exam-focused, MCQ-friendly style. GK Pal-specific emphasis is highlighted where applicable.
Complete Cardiovascular Physiology
1. Overview of the Cardiovascular System
The cardiovascular system maintains homeostasis by transporting O₂, nutrients, hormones, and metabolic waste. It consists of:
- Heart - a pulsatile, two-sided pump
- Blood vessels - arteries, arterioles, capillaries, venules, veins
- Blood - the transport medium
The heart has two separate pumps:
- Right heart - pumps blood through the low-pressure pulmonary circulation
- Left heart - pumps blood through the high-pressure systemic circulation
Each side has an atrium (weak primer pump) and a ventricle (main pumping chamber). The heart is enclosed in the pericardium (two-layered sac).
2. Cardiac Muscle - Structure and Properties
Histology (Guyton)
- Cardiac muscle fibers form a latticework - dividing, recombining, spreading
- Striated like skeletal muscle; contains actin and myosin filaments
- Intercalated discs contain gap junctions with very low electrical resistance
- Acts as a functional syncytium - when any cell depolarizes, impulse spreads to all connected cells
- Two syncytia: Atrial syncytium + Ventricular syncytium, separated by fibrous AV rings
- The only normal conducting bridge between atria and ventricles: Bundle of His
Three Types of Cardiac Muscle Cells
- Atrial muscle - thinner, contracts briefly
- Ventricular muscle - contracts forcefully, ~0.3 s duration
- Specialized excitatory/conductive fibers - few contractile fibrils; generate automaticity and conduct impulses (SA node, AV node, Bundle of His, Purkinje fibers)
Left Ventricular Torsion/Wringing Motion (Guyton)
The LV has a double-helix fiber arrangement:
- Outer subepicardial fibers spiral leftward; inner subendocardial fibers spiral rightward
- During systole → LV apex rotates counterclockwise, base rotates clockwise → wringing/twisting motion
- At end-systole the LV acts like a "loaded spring" and recoils/untwists during diastole, aiding rapid filling
- Guyton, p. 121
3. Action Potential of Cardiac Muscle
Ventricular Muscle Action Potential (Guyton)
Resting membrane potential: -85 mV | Peak: +20 mV
| Phase | Name | Ion Changes |
|---|---|---|
| 0 | Rapid Depolarization | Voltage-gated fast Na⁺ channels open → rapid Na⁺ influx |
| 1 | Initial Repolarization | Fast Na⁺ channels close; transient outward K⁺ (Ito) current |
| 2 | Plateau | L-type Ca²⁺ channels open (slow); fast K⁺ channels close → Ca²⁺+Na⁺ influx maintains depolarization for 0.2-0.3 s |
| 3 | Rapid Repolarization | Ca²⁺ channels close; slow K⁺ channels open → K⁺ efflux restores resting potential |
| 4 | Resting Potential | Na⁺/K⁺ ATPase restores ion gradients; stable at -85 mV in contractile cells |
Key differences from skeletal muscle:
- The plateau (Phase 2) makes contraction last ~15× longer
- Ca²⁺ entering during the plateau triggers contraction (unlike skeletal muscle where Ca²⁺ comes purely from SR)
- K⁺ permeability decreases 5-fold during the plateau, slowing repolarization
SA/AV Node (Pacemaker) Action Potential (Ganong)
- No stable Phase 4 - spontaneous diastolic depolarization ("pacemaker potential")
- Driven by If ("funny" current) - slow Na⁺ influx through HCN channels
- Threshold triggers Ca²⁺-dependent Phase 0 (via L-type Ca²⁺ channels, NOT fast Na⁺ channels)
- Resting potential: -55 to -60 mV (less negative, because IK1 channels are sparse)
4. Conduction System of the Heart (Ganong)
Anatomy and Conduction Speeds
| Structure | Location | Speed |
|---|---|---|
| SA node | Junction of SVC + right atrium | 0.05 m/s |
| Internodal atrial pathways (anterior/Bachmann, middle/Wenckebach, posterior/Thorel) | Atrial walls | 1 m/s |
| AV node | Right posterior interatrial septum | 0.05 m/s |
| Bundle of His | Top of interventricular septum | 1 m/s |
| Purkinje system | Subendocardial, both ventricles | 4 m/s (fastest) |
| Ventricular muscle | Myocardium | 1 m/s |
Sequence of Conduction
- SA node fires (fastest pacemaker - 70-80 bpm) → atrial depolarization in ~0.1 s
- Impulse reaches AV node → AV nodal delay ~0.1 s (allows atrial contraction to prime ventricles)
- Bundle of His → right + left bundle branches → Purkinje fibers
- Ventricular depolarization starts at left side of interventricular septum → right across septum → apex → ventricular walls endocardium to epicardium
- Total ventricular depolarization: 0.08-0.1 s
AV delay shortened by sympathetic (↑ conduction); lengthened by vagal stimulation.
Autonomic Innervation (Ganong)
- Right vagus → mainly SA node; Left vagus → mainly AV node
- Right sympathetic (stellate ganglion) → SA node; Left sympathetic → AV node
Wolff-Parkinson-White Syndrome (Guyton)
Congenital accessory pathway bypasses AV node → premature ventricular excitation → potentially fatal tachyarrhythmias (delta wave on ECG, short PR interval)
5. The Cardiac Cycle (Guyton)
Cycle duration at 72 bpm = 0.833 s
Left Heart Cardiac Cycle Events
| Phase | Events | Pressures |
|---|---|---|
| Atrial systole | Atrial contraction adds ~20-30% to LV filling; tricuspid/mitral open | LA pressure ~8 mmHg |
| Isovolumetric contraction | LV pressure rises rapidly; both valves closed; no volume change | LV: 0 → 80 mmHg |
| Rapid ejection | Aortic valve opens when LV pressure exceeds aortic (~80 mmHg); rapid outflow | Peak aortic: 120 mmHg |
| Reduced ejection | Ejection rate slows; LV pressure begins to fall | - |
| Isovolumetric relaxation | Aortic valve closes (aortic > LV); LV relaxes; both valves closed; no volume change | - |
| Rapid filling | Mitral valve opens (LV pressure < LA); passive filling (~70% of total) | LA: ~5-6 mmHg |
| Slow filling (diastasis) | Slow passive filling | - |
Normal volumes:
- EDV: ~130 mL | ESV: ~60 mL | Stroke Volume = ~70 mL
- Ejection Fraction = SV/EDV × 100 = ~55-65%
Effect of ↑ heart rate: Diastole shortens more than systole; at very high rates, inadequate filling can reduce SV.
6. Heart Sounds (Guyton)
| Sound | Timing | Cause | Feature |
|---|---|---|---|
| S1 (lub) | Start of systole | Closure of mitral + tricuspid valves + ventricular wall vibration | Low-pitched, dull; longer |
| S2 (dub) | End of systole | Closure of aortic + pulmonary valves | High-pitched, sharp |
| S3 | Early diastole | Rapid ventricular filling - turbulence | Pathological in adults (heart failure) |
| S4 | Late diastole (presystole) | Atrial contraction against stiff ventricle | Pathological (LVH, ischemia) |
Physiological split S2: Aortic valve closes before pulmonary; widens on inspiration (↑ venous return → delayed RV emptying).
Murmurs: Turbulent flow through abnormal valves or septal defects; systolic murmurs (mitral regurgitation, aortic stenosis) vs. diastolic (mitral stenosis, aortic regurgitation).
7. Cardiac Output (Guyton & Ganong)
CO = Stroke Volume × Heart Rate
- Normal at rest: ~5 L/min (men ~5.6, women ~4.9 L/min)
- Cardiac Index (CI) = CO/BSA = ~3 L/min/m² (for 70 kg, BSA 1.7 m²)
- CI peaks at ~4 L/min/m² at age 10, falls to ~2.4 L/min/m² at age 80
Measurement
Fick's Principle (Ganong):
CO = VO₂ / (CaO₂ − CvO₂) = 250 mL/min ÷ 50 mL/L = 5 L/min
(CaO₂ = 190 mL/L; CvO₂ in pulmonary artery = 140 mL/L)
Indicator Dilution Method: Inject known dye/isotope IV; measure arterial concentration over time; CO = amount injected / average concentration × time
Frank-Starling Law (Both Guyton and Ganong)
"The energy of contraction is proportional to the initial length of the cardiac muscle fiber" - Starling
- Greater EDV (preload) → more myofibril stretch → stronger contraction → higher SV
- Frank-Starling curve: SV (y-axis) vs. EDV (x-axis) - ascending limb is physiologic
- Heterometric regulation = CO regulated by changes in fiber length (preload)
- Homometric regulation = CO regulated by changes in contractility without length change (e.g., sympathetic stimulation shifts the curve upward)
Factors Affecting Stroke Volume (Ganong's Summary)
| Factor | Effect on SV |
|---|---|
| ↑ Preload (↑ EDV) | ↑ SV (Frank-Starling) |
| ↑ Afterload (↑ aortic pressure) | ↓ SV (initially); heart compensates by ↑ EDV |
| ↑ Contractility (sympathetic, catecholamines, digitalis, ↑ Ca²⁺) | ↑ SV (curve shifts up) |
| ↓ Contractility (heart failure, β-blockers, acidosis, hypoxia) | ↓ SV (curve shifts down) |
Changes During Exercise (Ganong)
| Workload | Pulse Rate (bpm) | CO (L/min) | SV (mL) |
|---|---|---|---|
| Rest | 64 | 6.4 | 100 |
| Moderate | 104 | 13.1 | 126 |
| Heavy | 161 | 17.8 | 110 |
| Maximum | 173 | 20.9 | 120 |
SV plateaus then falls at very high HR as diastole becomes too short for adequate filling.
8. Blood Pressure and Vascular Resistance (Guyton)
Blood Pressure Definitions
- Systolic BP: ~120 mmHg | Diastolic BP: ~80 mmHg
- MAP = DBP + 1/3(SBP − DBP) = 80 + 1/3(40) ≈ 93 mmHg
- Pulse Pressure = SBP − DBP = ~40 mmHg
- Pulse pressure is directly proportional to stroke volume and inversely proportional to arterial compliance
Resistance to Flow - Poiseuille's Law
R = 8ηL / πr⁴
- r = vessel radius (most critical - r⁴ relationship; doubling radius → 16× decrease in resistance)
- η = blood viscosity (increases with hematocrit)
- L = vessel length
MAP = CO × TPR (the fundamental hemodynamic equation)
Pressure Distribution in Circulation
| Vessel | Mean Pressure |
|---|---|
| Aorta | ~95 mmHg |
| Arteries | ~80 mmHg |
| Arterioles | ~35 mmHg |
| Capillaries | ~17 mmHg |
| Venules | ~10 mmHg |
| Vena cava/RA | ~0-5 mmHg |
| Pulmonary artery | 25/8, mean ~15 mmHg |
Arterioles are the primary site of resistance control ("resistance vessels").
9. Regulation of Arterial Blood Pressure
Short-Term Neural Regulation
Baroreceptor Reflex (key reflex - GK Pal emphasizes heavily):
- Receptors: Carotid sinus (CN IX - Hering's nerve) + Aortic arch (CN X)
- High-pressure mechanoreceptors fire with increased wall stretch
- Afferents → Cardiovascular center in medulla (nucleus tractus solitarius)
- ↑ BP → ↑ firing → ↑ parasympathetic (↓ HR) + ↓ sympathetic (vasodilation, ↓ contractility)
- ↓ BP → ↓ firing → ↑ sympathetic outflow → ↑ HR, ↑ contractility, vasoconstriction
- Resets within 1-2 days (cannot control long-term BP)
Chemoreceptors:
- Peripheral (carotid + aortic bodies): respond to ↓ PO₂, ↑ PCO₂, ↓ pH → ↑ sympathetic
- Central (medullary): respond primarily to ↑ PCO₂/↓ pH (via H⁺)
Hormonal Regulation
| Hormone | Stimulus | Cardiovascular Effect |
|---|---|---|
| Epinephrine/Norepinephrine | Stress, hypotension | ↑ HR (β1), ↑ contractility (β1), vasoconstriction (α1) |
| Angiotensin II | ↓ RBF, ↓ Na⁺ | Potent vasoconstriction + ↑ aldosterone |
| Aldosterone | Ang II, ↓ Na⁺ | ↑ Na⁺ reabsorption → ↑ blood volume → ↑ CO |
| ADH (Vasopressin) | ↑ osmolality, ↓ BP | Water retention + vasoconstriction |
| ANP/BNP | Atrial/ventricular stretch | Vasodilation + natriuresis + ↓ renin |
| Nitric Oxide (NO) | Shear stress, ACh | Endothelium-derived vasodilation |
| Endothelin-1 | Endothelial injury | Potent vasoconstriction |
| Prostacyclin (PGI₂) | Endothelium | Vasodilation + anti-platelet |
Long-Term Regulation: Renal-Pressure Natriuresis (Guyton)
- The kidney provides infinite gain in long-term BP control
- ↑ BP → ↑ renal perfusion → ↑ Na⁺ + water excretion → ↓ blood volume → ↓ CO → ↓ BP (equilibrium)
- RAAS modulates the set-point; renal disease impairs this and causes sustained hypertension
10. Microcirculation and Capillary Exchange
Starling Forces
Net filtration pressure = Kf × [(Pc − Pi) − σ(πc − πi)]
| Force | Arteriolar End | Venular End |
|---|---|---|
| Capillary hydrostatic pressure (Pc) | +35 mmHg | +10 mmHg |
| Interstitial hydrostatic pressure (Pi) | −3 mmHg | −3 mmHg |
| Plasma oncotic pressure (πc) | −28 mmHg | −28 mmHg |
| Interstitial oncotic pressure (πi) | +8 mmHg | +8 mmHg |
| Net | +12 mmHg (filtration) | −13 mmHg (absorption) |
~90% of filtered fluid is reabsorbed at venular end; the remaining ~10% returns via lymphatics.
Edema Formation
- ↑ Capillary hydrostatic pressure (HF, venous obstruction, prolonged standing)
- ↓ Plasma oncotic pressure (hypoalbuminemia - nephrotic syndrome, cirrhosis, malnutrition)
- ↑ Capillary permeability (inflammation, burns, sepsis)
- Lymphatic obstruction (filariasis - elephantiasis; post-surgical)
11. Coronary Circulation (Guyton)
Anatomy
- Left CA → LAD (anterior IVS, anterior LV) + LCx (lateral LV)
- Right CA → RV + posterior LV (right dominant in ~80-90% of people)
- Coronary venous drainage: Coronary sinus (75% of LV venous blood) → RA; Anterior cardiac veins (RV) → RA; Thebesian veins → all 4 chambers
Blood Flow
- Normal resting: ~225 mL/min = 4-5% of cardiac output (~70 mL/min per 100 g heart)
- During maximal exercise: increases 3-4 fold
- Phasic variation: LV flow is LOWEST during systole (compressed by contracting myocardium), HIGHEST during diastole - opposite to all other organs
- RV flow is less phasic because RV pressure is much lower
Regulation of Coronary Blood Flow
- Local metabolic vasodilators (most important): adenosine (primary), K⁺, CO₂, H⁺, ↓ O₂
- Nitric oxide (endothelium-derived, activated by shear stress)
- Autonomic: Sympathetic → α₁ vasoconstriction (masked by metabolic dilation); vagal → mild dilation
- Myogenic autoregulation (Bayliss effect)
Myocardial O₂ Consumption (Ganong)
- Basal MVO₂: ~2 mL/100 g/min
- Major determinants:
- Heart rate
- Wall tension (preload + afterload; Laplace: T = P × r / 2h)
- Contractility
- Basal/maintenance metabolism
12. Special Circulations
Pulmonary Circulation
- Low pressure (25/8 mmHg), low resistance
- Hypoxic pulmonary vasoconstriction (HPV): Hypoxia causes pulmonary vasoconstriction (OPPOSITE to systemic) → diverts blood from poorly ventilated alveoli to better ventilated ones (V/Q matching)
- Zone 1 (apex): Pa > PA > Pv (no flow in zone 1); Zone 2: PA > Pa > Pv; Zone 3 (base): Pa > Pv > PA (continuous flow)
Cerebral Circulation
- Normal CBF: 750 mL/min = ~15% of CO; ~50 mL/100 g/min
- Autoregulation: CBF maintained constant with MAP 60-150 mmHg
- Most potent cerebrovascular regulator: PaCO₂ (↑ CO₂ → vasodilation via H⁺)
- Blood-brain barrier formed by tight junctions of endothelial cells + astrocyte feet processes
Renal Circulation
- Receives ~20-25% of CO (~1200 mL/min) - highest blood flow per gram of any organ
- Afferent arteriole → glomerular capillaries → efferent arteriole → peritubular capillaries (or vasa recta)
- Autoregulates CBF/GFR over MAP 75-160 mmHg
Skeletal Muscle Circulation
- Rest: 2-4 mL/100 g/min; Exercise: up to 50-80 mL/100 g/min
- Vessels compressed when tension >10% max; flow stops when >70% max
- Functional hyperemia driven by adenosine, K⁺, CO₂, H⁺, osmolality
13. Venous Return and Venous System (Guyton)
Mean Systemic Filling Pressure (~7 mmHg)
This is the driving pressure for venous return (pressure in circulation if heart stopped). It is:
- ↑ by: blood transfusion, sympathetic venoconstriction, lying down
- ↓ by: hemorrhage, acute vasodilation, upright posture
Factors Promoting Venous Return
- Mean systemic filling pressure > RA pressure (the gradient drives flow)
- Skeletal muscle pump (with venous valves)
- Respiratory pump (inspiration → ↓ intrathoracic pressure → ↑ thoracic vein diameter → ↑ venous return)
- Cardiac suction during diastole
- Sympathetic venoconstriction (shifts blood from capacitance vessels)
Veins contain ~60-70% of total blood volume and are highly compliant (blood reservoir).
14. Circulatory Shock (Ganong)
Definition: Inadequate tissue perfusion with relatively or absolutely low cardiac output
| Type | Mechanism | Hemodynamics |
|---|---|---|
| Hypovolemic ("cold shock") | ↓ blood volume | ↓CO, ↑TPR, cold/pale/clammy skin |
| Distributive (septic/anaphylactic/neurogenic) | Massive vasodilation | ↓TPR, ↑/normal CO initially |
| Cardiogenic | Pump failure | ↓CO, ↑TPR, ↑ filling pressures |
| Obstructive | Outflow obstruction | ↓CO (PE, tension PTX, cardiac tamponade) |
Compensatory mechanisms in hemorrhage:
- ↑ Sympathetic → ↑ HR, vasoconstriction, venoconstriction
- ↑ RAAS → Na⁺/water retention
- ↑ ADH → water retention
- Transcapillary refill from interstitium (slow)
- Lactic acidosis with severe hemorrhage (lactic acid >9 mmol/L in severe shock)
15. Heart Failure (Guyton)
Compensatory Mechanisms
- Cardiac dilation (Frank-Starling): ↑ EDV → ↑ SV (early compensation)
- Cardiac hypertrophy: ↑ muscle mass (concentric in pressure overload; eccentric in volume overload)
- Sympathetic activation: ↑ HR + ↑ contractility + vasoconstriction
- RAAS activation: Na⁺ + water retention → ↑ preload
Decompensation
- Backward failure → pulmonary edema (left HF), peripheral edema/ascites (right HF)
- Forward failure → ↓ CO → organ hypoperfusion
- Cardiac Reserve: Normal = 300-400% above resting CO; severe HF may be <100% (cannot even meet resting needs)
Acute vs. Chronic Manifestations
| LHF | RHF |
|---|---|
| Dyspnea, orthopnea, PND | Peripheral edema |
| Pulmonary edema | Hepatomegaly, ascites |
| ↑ PCWP | ↑ CVP/JVP |
| S3 gallop |
Key Formulas and Normal Values
| Parameter | Formula / Value |
|---|---|
| Cardiac Output | CO = SV × HR; Normal ~5 L/min |
| Cardiac Index | CI = CO/BSA; Normal ~3 L/min/m² |
| Stroke Volume | SV = EDV − ESV; Normal ~70 mL |
| Ejection Fraction | EF = SV/EDV × 100; Normal 55-65% |
| Mean Arterial Pressure | MAP = DBP + 1/3(SBP-DBP) ≈ 93 mmHg; MAP = CO × TPR |
| Pulse Pressure | PP = SBP − DBP = ~40 mmHg |
| Resistance (Poiseuille) | R = 8ηL/πr⁴ |
| Fick's CO | CO = VO₂ / (CaO₂ − CvO₂) |
| End-diastolic volume | ~130 mL (LV) |
| End-systolic volume | ~60 mL (LV) |
| Normal HR | 60-100 bpm |
| Normal BP | 120/80 mmHg |
| Normal CVP | 2-8 mmHg |
| Coronary blood flow | ~225 mL/min (4-5% of CO) |
Primary sources used:
- Guyton and Hall Textbook of Medical Physiology, 14th ed. - Chapters 9 (Cardiac Muscle), 10 (Conduction System), 14 (Blood Pressure), 20 (Cardiac Output), 21 (Coronary Circulation)
- Ganong's Review of Medical Physiology, 26th ed. - Chapters 29 (Cardiac Conduction/ECG), 30 (Cardiac Output/Regulation), 31-32 (Special Circulations)
All details of pacemaker potential of heart
The pacemaker potential is the spontaneous, gradual depolarization during Phase 4 in SA/AV node cells that drives automaticity. It results from a net inward current (If - "funny current"), decay of K+ conductance, and T-type Ca2+ channel activation. The SA node fires at 60-100/min and is the dominant pacemaker.
Searching sources...
Reading File
Finding Sources
Finding Sources
I have the key file paths. Now let me read the dedicated pacemaker potential sections from all major physiology texts simultaneously.
Reading File
Reading File
Finding Sources
Reading File
Finding Sources
Reading File
Finding Sources
Excellent - rich material from multiple sources. Now let me read the key sections from Guyton, Harrison's, Fuster's Heart, and Braunwald's for complete detail.
Finding Sources
Reading File
Reading File
Reading File
Finding Sources
Reading File
Finding Sources
Reading File
Reading File
Loading Image
I now have comprehensive information from multiple authoritative sources. Let me also fetch the autonomic effects diagram.
Loading Image
Loading Image
I now have all the content and diagrams needed. Let me compile the comprehensive answer.
Pacemaker Potential of the Heart - Complete Details
1. Definition and Concept
The pacemaker potential (also called prepotential or spontaneous diastolic depolarization) is the gradual, self-generated depolarization of Phase 4 that occurs in specialized cardiac cells after each action potential. Instead of maintaining a stable resting membrane potential (as ventricular and atrial muscle cells do), pacemaker cells slowly drift toward the threshold potential, triggering the next action potential automatically and repetitively without any external stimulus.
This property is called automaticity - the intrinsic ability to generate rhythmic action potentials.
- Ganong's Review of Medical Physiology, 26th ed., p. 522
2. Sites of Automaticity (Hierarchy of Pacemakers)
| Pacemaker Site | Intrinsic Rate | Location |
|---|---|---|
| SA node (dominant) | 60-100 bpm | Junction of SVC and right atrium |
| AV node (latent) | 40-60 bpm | Right posterior interatrial septum |
| Bundle of His (latent) | ~40 bpm | Upper interventricular septum |
| Purkinje fibers (latent) | 20-40 bpm | Subendocardial ventricular surface |
The SA node normally overrides all other pacemakers because it fires fastest. The others are called latent or subsidiary pacemakers and are suppressed by overdrive suppression from the SA node.
- Atrial and ventricular muscle cells do not have pacemaker potentials under normal conditions; they fire spontaneously only when injured or abnormal
- Ganong, p. 523
3. Unique Features of SA Node Cells vs. Ventricular Muscle
| Feature | Ventricular Muscle | SA Node |
|---|---|---|
| Resting membrane potential | -85 to -90 mV (stable) | -50 to -65 mV (unstable - drifts up) |
| Phase 0 upstroke mechanism | Fast Na⁺ channels (INa) | L-type Ca²⁺ channels (ICaL) |
| Phase 0 upstroke speed | Rapid, steep | Slow, rounded |
| Phase 1 (initial repolarization) | Present | Absent |
| Phase 2 (plateau) | Present (0.2-0.3 s) | Absent |
| Phase 3 (repolarization) | IK (delayed rectifier) | IK (delayed rectifier) |
| Phase 4 | Stable at -85 mV | Gradual spontaneous depolarization |
| Fast Na⁺ channels | Present | Absent (inactivated at -50 to -65 mV) |
| Inward rectifier IK1 | High - maintains resting potential | Low/absent - enables spontaneous drift |
The absence of fast Na⁺ channels (which are inactivated at membrane potentials above -60 mV) means the SA node upstroke depends entirely on Ca²⁺ channels, and this is why drugs that block Na⁺ channels (lidocaine, quinidine) do NOT suppress the SA node.
- Costanzo Physiology, 7th ed., p. 142; Fuster and Hurst's The Heart, 15th ed.
4. Phases of the SA Node Action Potential
Here is the classic Ganong diagram showing the comparison of ventricular action potential (A) and pacemaker potential (B):
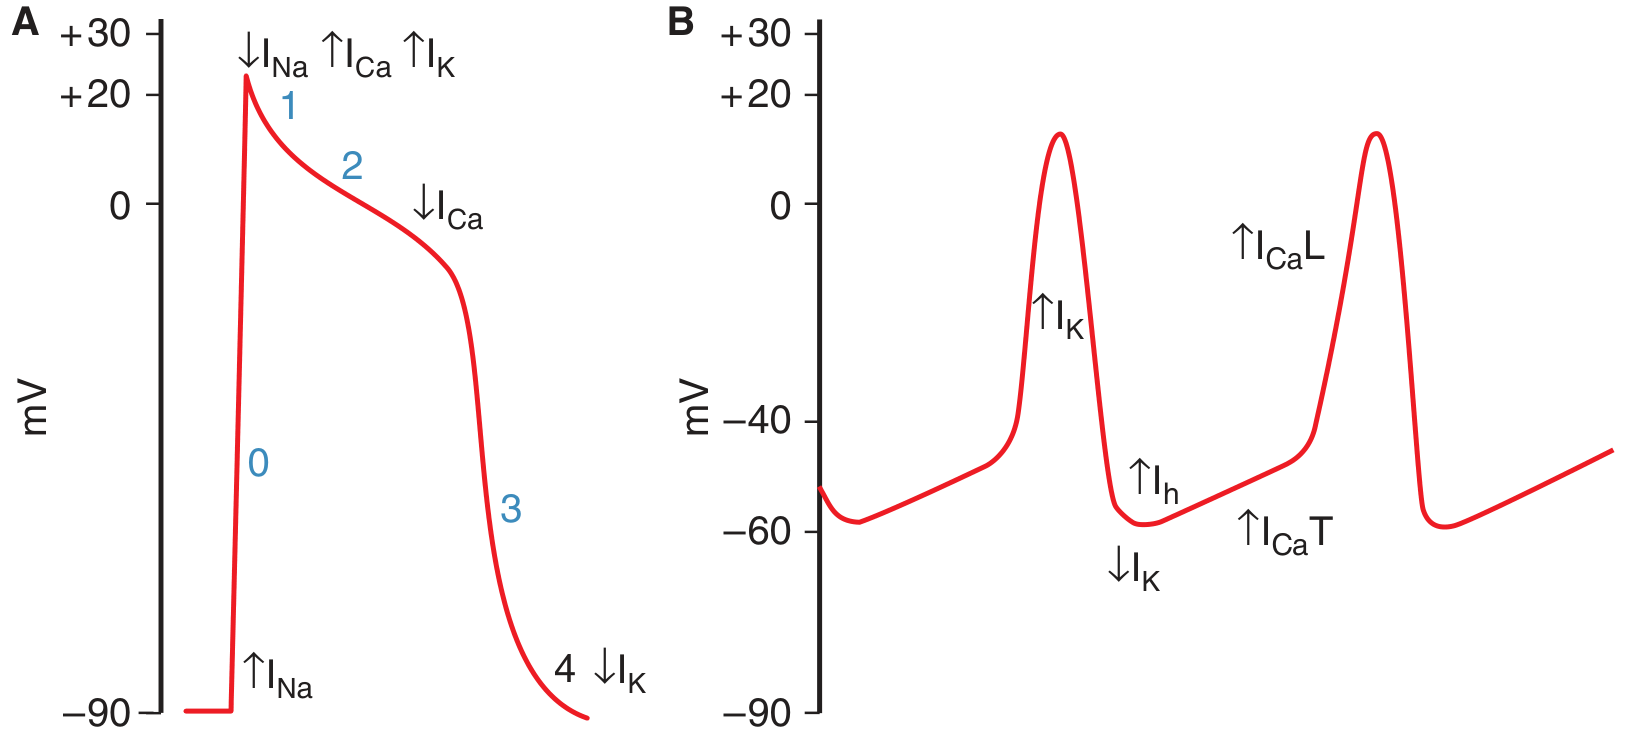
Figure: (A) Phases of ventricular muscle action potential with ion currents. (B) The pacemaker potential of SA node tissue, showing IK decline, funny current (Ih) activation during the prepotential, T-type Ca²⁺ (ICaT) completing depolarization to threshold, and L-type Ca²⁺ (ICaL) producing the upstroke. - Ganong's Review of Medical Physiology, 26th ed.
Phase 0 - Upstroke
- Produced by opening of L-type Ca²⁺ channels (ICaL)
- T-type Ca²⁺ channels also contribute (especially at the end of Phase 4 bringing to threshold)
- Upstroke is slow and rounded (no rapid Na⁺ spike) because it depends on slower Ca²⁺ channels
- Peak potential: approximately +5 to +10 mV (less positive than ventricular cells which reach +20 mV)
- Costanzo, p. 142
Phases 1 and 2 - ABSENT
- There is no initial repolarization notch and no plateau in SA node cells
- Costanzo, p. 142
Phase 3 - Repolarization
- Due to ↑ IK (delayed rectifier K⁺ current) - same mechanism as other cardiac cells
- K⁺ moves out down its electrochemical gradient, repolarizing the membrane
- Returns membrane to the maximum diastolic potential (MDP) of approximately -60 to -65 mV
- (Note: MDP is less negative than the resting potential of ventricular cells)
Phase 4 - The Pacemaker Potential (Spontaneous Diastolic Depolarization)
This is the defining feature. It proceeds in three sequential steps driven by distinct ion currents:
5. Ionic Mechanisms of the Pacemaker Potential - Step by Step
Step 1: Decay of IK (Outward K⁺ Current)
- At the end of Phase 3, IK begins to decline (the K⁺ channels deactivate as membrane repolarizes)
- This reduces the outward K⁺ current that was holding the membrane at the maximum diastolic potential
- The net inward current begins to exceed net outward current → membrane starts to depolarize slowly
- This is the first component of the pacemaker potential
- Ganong, p. 522
Step 2: Activation of If - The "Funny Current" (Ih)
- As the membrane repolarizes and becomes hyperpolarized (reaching MDP ~-60 to -65 mV), special channels called HCN channels (Hyperpolarization-activated Cyclic Nucleotide-gated channels) open
- These channels are activated by hyperpolarization - the OPPOSITE of all other voltage-gated channels (hence the name "funny")
- They are permeable to both Na⁺ and K⁺, but at the prevailing membrane potential, the driving force favors net inward Na⁺ current
- This mixed inward current is called If (or Ih or "funny current")
- If drives the membrane toward threshold - this is the main depolarizing force of the pacemaker potential
- If is turned on by repolarization from the preceding action potential, thus ensuring that each action potential is automatically followed by another
- Costanzo, p. 142; Ganong, p. 522; Harrison's Principles, 22nd ed.
Key properties of HCN channels/If:
- Gene: HCN4 (primarily), HCN1, HCN2 also present in SA node
- Current: Mixed Na⁺/K⁺ inward current (at physiological resting potential, net inward)
- Activation: by hyperpolarization (activated below -40 to -50 mV)
- Modulation: cAMP directly gates these channels (not just via protein kinase)
- ↑ cAMP → channel opens at less negative potentials → faster depolarization (sympathetic effect)
- ↓ cAMP → channel opens at more negative potentials → slower depolarization (vagal effect)
Step 3: Activation of T-type Ca²⁺ Channels (ICaT)
- As If depolarizes the membrane from MDP toward threshold, T-type (Transient) Ca²⁺ channels open at approximately -50 mV
- T-type channels are so named because they open transiently (fast inactivation)
- ICaT provides an additional inward Ca²⁺ current that completes the depolarization of the pacemaker potential to threshold
- This is the final component of the pacemaker potential just before the action potential fires
- Ganong, p. 522
Step 4: Activation of L-type Ca²⁺ Channels (ICaL) - Upstroke (Phase 0)
- Once threshold is reached (~-40 mV), L-type (Long-lasting) Ca²⁺ channels open
- ICaL produces the upstroke (Phase 0) of the SA node action potential
- This is NOT part of the pacemaker potential itself, but the result of it reaching threshold
Additional Mechanism: The Calcium Clock (INCX)
A newer understanding (particularly from Fuster's Heart, 15th ed.) adds a "calcium clock" to the classical "membrane clock":
- The SR (sarcoplasmic reticulum) in SA node cells rhythmically releases Ca²⁺ sparks via Ryanodine receptor 2 (RYR2) during Phase 4
- This elevation in intracellular Ca²⁺ activates the Na⁺-Ca²⁺ exchanger (INCX)
- NCX pumps 1 Ca²⁺ out in exchange for 3 Na⁺ in → net inward positive current → depolarization
- The membrane clock (If, IK decay, ICaT) and calcium clock (INCX) work together to generate automaticity
- The relative contribution of each continues to be debated
- Fuster and Hurst's The Heart, 15th ed., p. 1143
6. Summary of Ion Currents During Pacemaker Potential
| Stage | Current | Ion | Direction | Effect |
|---|---|---|---|---|
| Start of Phase 4 | ↓ IK (deactivation) | K⁺ | Outward ↓ | Less hyperpolarizing → net drift toward threshold |
| Early Phase 4 | ↑ If (funny current) | Na⁺ (mainly) | Inward | Slow depolarization - main driver |
| Late Phase 4 | ↑ ICaT (T-type Ca²⁺) | Ca²⁺ | Inward | Completes prepotential to threshold |
| Throughout Phase 4 | INCX (Ca²⁺ clock) | 3 Na⁺ in / 1 Ca²⁺ out | Net inward | Contributes to depolarization |
| Phase 0 (upstroke) | ↑ ICaL (L-type Ca²⁺) | Ca²⁺ | Inward | Upstroke of action potential |
| Phase 3 (repolarization) | ↑ IK | K⁺ | Outward | Repolarization back to MDP |
7. The Three Voltage Levels of Importance
| Level | Value | Significance |
|---|---|---|
| Maximum Diastolic Potential (MDP) | ~-65 mV (SA node) | Most negative point; start of Phase 4 |
| Threshold Potential | ~-40 mV | Point at which ICaL opens and action potential fires |
| Peak Potential | ~+5 to +10 mV | Top of upstroke in SA node |
Compare: In ventricular cells, resting = -85 mV, threshold = -65 mV, peak = +20 mV.
8. Autonomic Regulation of the Pacemaker Potential
Below are the actual diagrams from Costanzo (top) and Ganong (bottom) showing these effects:
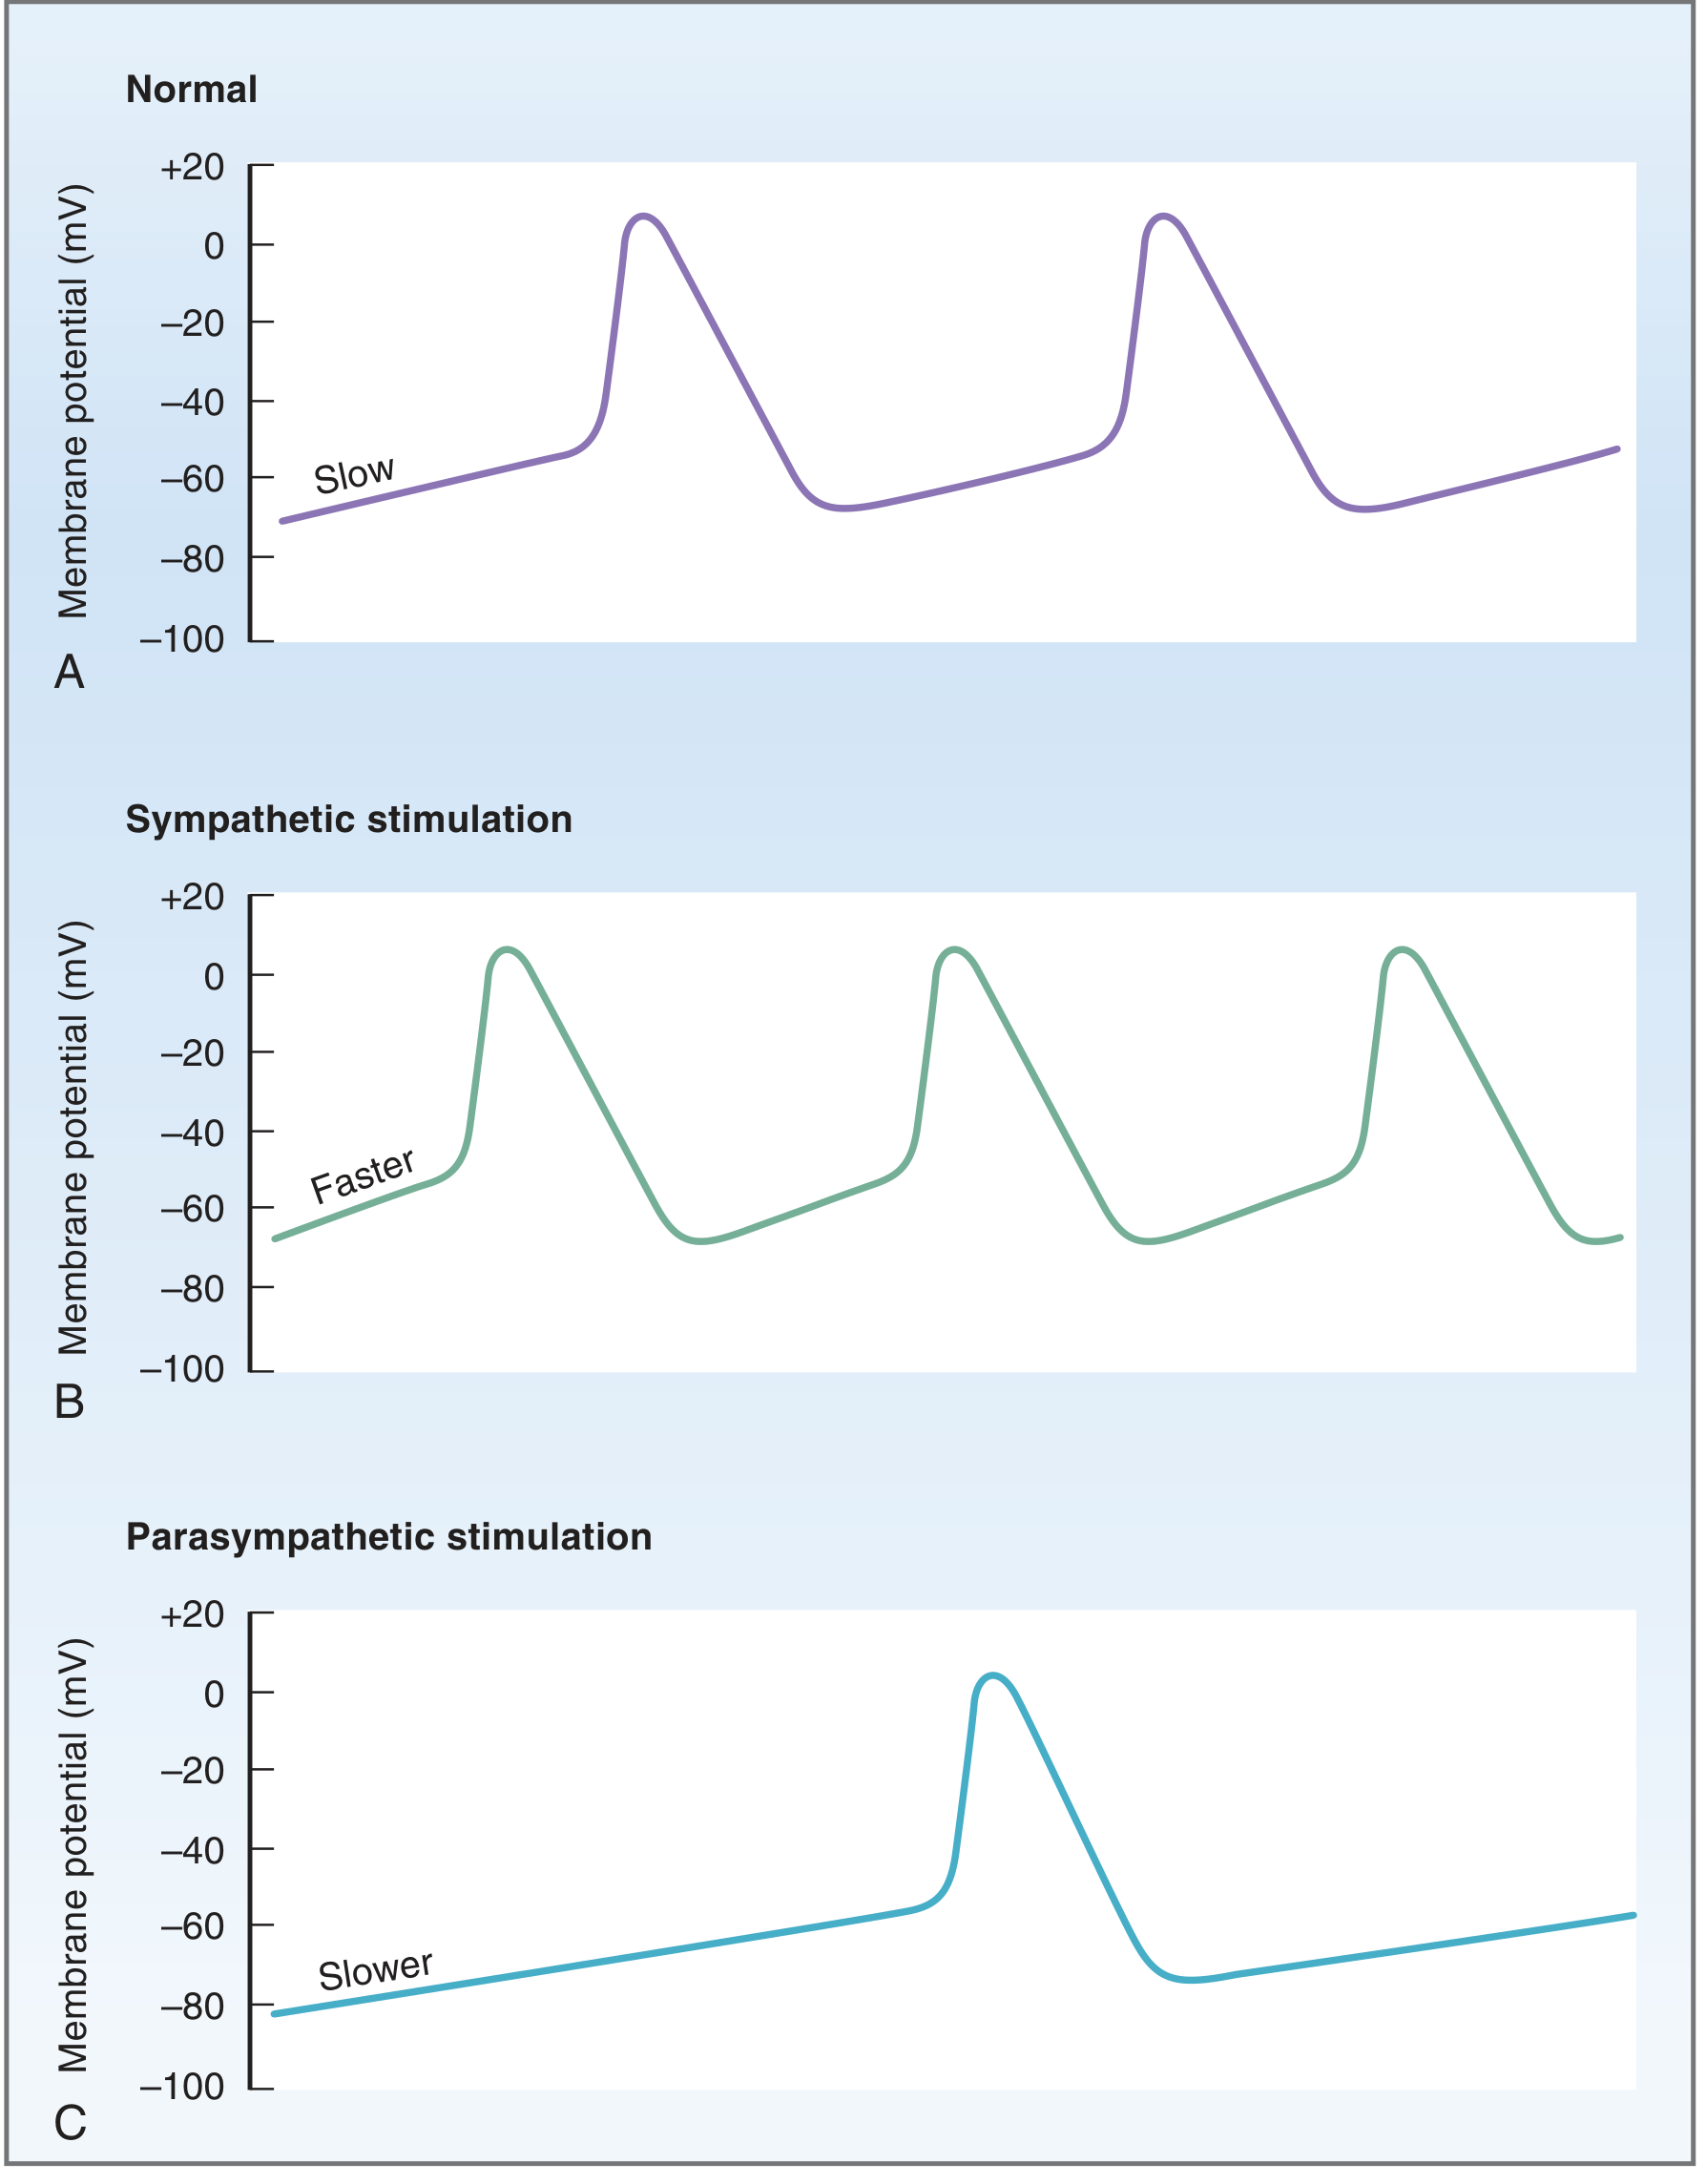
Effect of sympathetic (B) and parasympathetic (C) stimulation on SA node pacemaker potential. - Costanzo Physiology, 7th ed.
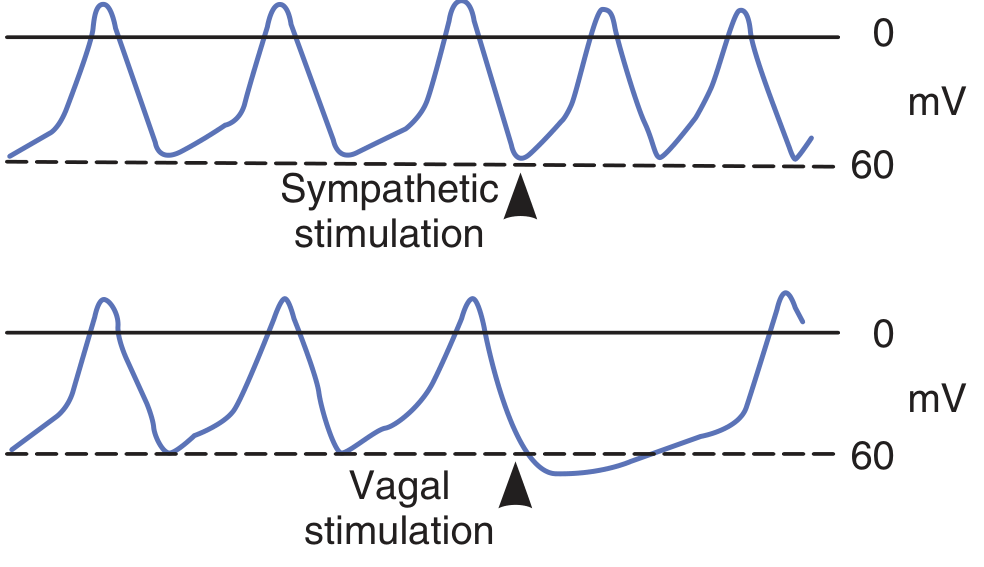
Effect of sympathetic and vagal stimulation on SA node membrane potential - Ganong's Review of Medical Physiology, 26th ed.
Sympathetic Stimulation (Positive Chronotropy)
Receptor: β₁ adrenergic → Gs → ↑ adenylyl cyclase → ↑ cAMP
Three simultaneous effects on the pacemaker potential:
- ↑ If - cAMP directly gates HCN channels, shifting activation to less negative voltages → steeper Phase 4 slope → faster rate
- ↑ ICa (both T and L types) - more Ca²⁺ channels open → threshold reached sooner (threshold potential becomes less negative)
- Superior shift of impulse formation site within SA node (allows more favorable exit pathways to atrium)
Net result: Steeper Phase 4 slope + lower threshold → SA node fires more frequently → ↑ heart rate
- Costanzo, p. 146
Parasympathetic Stimulation (Negative Chronotropy)
Receptor: M2 muscarinic → Gk protein (Gi) → three effects:
- ↓ If - Gk inhibits adenylyl cyclase → ↓ cAMP → HCN channels require more hyperpolarization to open → Phase 4 slope decreases
- ↑ IKAch - Gk β-subunit directly opens ACh-activated inward rectifier K⁺ channels (Kir3.1/3.4 = GIRK) → increased outward K⁺ current → hyperpolarizes MDP (more negative) → SA node further from threshold → longer time to reach threshold
- ↓ ICa - fewer Ca²⁺ channels open → threshold potential increases (requires more depolarization to fire)
Net result: Flatter Phase 4 slope + more negative MDP + higher threshold → SA node fires less frequently → ↓ heart rate
Strong vagal stimulation may completely suppress SA node discharge (vagal arrest).
- Ganong, p. 522; Costanzo, p. 147
Comparison Table - Autonomic Effects on Pacemaker Potential
| Parameter | Sympathetic (β₁) | Parasympathetic (M₂) |
|---|---|---|
| Phase 4 slope | ↑ (steeper, faster) | ↓ (flatter, slower) |
| MDP | Slightly less negative | More negative (hyperpolarized) |
| Threshold potential | ↓ (more easily reached) | ↑ (harder to reach) |
| If | ↑ | ↓ |
| ICa (L and T) | ↑ | ↓ |
| IKAch | - | ↑ (hyperpolarizes MDP) |
| cAMP | ↑ | ↓ |
| Heart rate | ↑ (tachycardia) | ↓ (bradycardia) |
9. Ivabradine - Pharmacological Proof of If Importance
Ivabradine (a pure heart rate-lowering drug) selectively blocks the HCN channels (If/funny current) from the intracellular side:
- Blocks If → reduces the slope of Phase 4 depolarization → ↓ heart rate
- No effect on contractility, blood pressure, or AV conduction
- Used clinically in heart failure (reduced EF) and stable angina
- Provides pharmacological proof that If is the critical current for pacemaker rate control
- Braunwald's Heart Disease, 2-vol set; Harrison's Principles, 22nd ed.
10. Overdrive Suppression
When the SA node pacemaker fires rapidly, it keeps all subsidiary (latent) pacemakers in a suppressed state:
- Rapid firing drives more Na⁺ into latent pacemaker cells
- The Na⁺/K⁺ ATPase works harder to pump out the excess Na⁺, generating a larger hyperpolarizing current
- This keeps latent pacemakers at a more negative membrane potential, far from threshold
- If the SA node stops (e.g., sick sinus syndrome), there is a pause before a subsidiary pacemaker takes over (because it needs time to "escape" from overdrive suppression)
- Braunwald's Heart Disease; Ganong, p. 523
Hierarchy When SA Node Fails
If SA node fails → AV node takes over at 40-60 bpm (junctional rhythm)
If AV node also fails → Bundle of His/Purkinje fibers at 20-40 bpm (ventricular escape/idioventricular rhythm)
- Slower rate + wider QRS complex (aberrant ventricular conduction)
11. Abnormal Automaticity - Ectopic Pacemakers
Under pathological conditions, latent pacemakers may discharge spontaneously and compete with or override the SA node:
| Mechanism | Cause | Example |
|---|---|---|
| Enhanced normal automaticity | Sympathetic excess, hypoxia, hypokalemia, digitalis toxicity | Accelerated junctional rhythm, ventricular tachycardia |
| Abnormal automaticity | Partial depolarization of myocardial cells (resting potential -40 to -60 mV) - ICaL-dependent firing | Ischemic ventricular tissue |
| Triggered activity - Early afterdepolarizations (EADs) | During Phase 2 or 3, oscillation in membrane potential triggering premature APs | Long QT syndrome → Torsades de Pointes |
| Triggered activity - Delayed afterdepolarizations (DADs) | After complete repolarization (Phase 4), Ca²⁺ overload activates INCX → depolarization | Digitalis toxicity, catecholamines, heart failure |
- Braunwald's Heart Disease, p. 412-414
12. SA Node Intrinsic Rate vs. Actual Heart Rate
- Intrinsic SA node rate (without autonomic input) = 100-110 bpm (demonstrated after complete autonomic blockade with atropine + propranolol)
- Normal resting heart rate (60-80 bpm) is SLOWER than intrinsic rate because vagal (parasympathetic) tone dominates at rest in young adults
- Intrinsic rate declines with age by 5-6 bpm per decade
- As age increases, vagal dominance decreases and sympathetic tone increases, maintaining the resting heart rate relatively constant
- Harrison's Principles of Internal Medicine, 22nd ed., p. 2913
13. Key Facts for Exam (GK Pal/Ganong/Guyton Style)
- Pacemaker potential = Phase 4 = spontaneous diastolic depolarization - unique to nodal tissue
- Three components of pacemaker potential: ↓ IK → ↑ If (funny current) → ↑ ICaT (T-type Ca²⁺)
- If = funny current = Ih = mixed Na⁺/K⁺ inward current through HCN4 channels; activated by hyperpolarization; directly gated by cAMP
- Maximum diastolic potential (MDP) in SA node = -60 to -65 mV
- Threshold potential in SA node = -40 mV
- Upstroke of SA node = L-type Ca²⁺ (ICaL) - NOT fast Na⁺ channels
- SA node rate = 60-100 bpm | AV node = 40-60 | His-Purkinje = 20-40
- Sympathetic → ↑ If + ↑ ICa + ↓ threshold → ↑ rate (positive chronotropy)
- Parasympathetic → ↓ If + ↑ IKAch (hyperpolarizes MDP) + ↓ ICa → ↓ rate (negative chronotropy)
- Ivabradine blocks If (HCN channels) → ↓ heart rate without affecting contractility
- Overdrive suppression: SA node keeps latent pacemakers suppressed; when SA node stops, there is a pause before escape rhythm appears
- Calcium clock (INCX driven by spontaneous SR Ca²⁺ release via RYR2) acts alongside membrane clock (If, IK, ICaT) to generate automaticity
Sources:
- Ganong's Review of Medical Physiology, 26th ed. - Chapter 29 (Origin and Spread of Cardiac Excitation, Pacemaker Potentials)
- Costanzo Physiology, 7th ed. - Chapter 4 (Cardiovascular Physiology, SA Node Action Potential)
- Fuster and Hurst's The Heart, 15th ed. - Chapter 38 (Anatomy and Physiology of SA Node)
- Harrison's Principles of Internal Medicine, 22nd ed. - Chapter 251 (SA Nodal Disease)
- Braunwald's Heart Disease - Chapter 62 (Disorders of Impulse Formation)
Cardiac cycle
The cardiac cycle covers all events from one heartbeat to the next - systole (contraction/ejection) and diastole (relaxation/filling). At 72 bpm it lasts ~0.833 s. Key phases: isovolumetric contraction, rapid ejection, isovolumetric relaxation, rapid filling, slow filling, and atrial systole.
Searching sources...
Finding Sources
Finding Sources
Reading File
Reading File
Excellent - Costanzo has a very detailed phase-by-phase breakdown. Let me read more of it and get the Guyton Wiggers diagram details.
Reading File
Finding Sources
Reading File
Finding Sources
Reading File
Finding Sources
Reading File
Reading File
Reading File
Excellent material. Now let me fetch the key diagrams - the Wiggers diagram and pressure-volume loop.
Loading Image
Loading Image
Loading Image
I have the Wiggers diagram (Guyton), the detailed phase diagram (Costanzo), and the pressure-volume loop (Guyton). Now let me read the Guyton Wiggers detail text and read more Costanzo phases.
Reading File
Reading File
Reading File
Reading File
I now have comprehensive, richly detailed information from multiple authoritative sources. Let me compile the complete answer.
The Cardiac Cycle - Complete Details
1. Definition
The cardiac cycle comprises all the mechanical, electrical, and valvular events that occur from the beginning of one heartbeat to the beginning of the next. It is initiated by spontaneous depolarization of the SA node, which triggers an orderly sequence of atrial then ventricular contraction and relaxation.
- At a heart rate of 72 bpm, one cycle lasts 1/72 min = 0.833 seconds
- Systole (ventricular contraction + ejection) = ~0.3 s
- Diastole (relaxation + filling) = ~0.5 s
Guyton and Hall Textbook of Medical Physiology, 14th ed., p. 126
2. The Wiggers Diagram (Guyton)
This is the foundational diagram of the cardiac cycle, showing simultaneous plots of aortic pressure, ventricular pressure, atrial pressure, ventricular volume, ECG, and heart sounds:
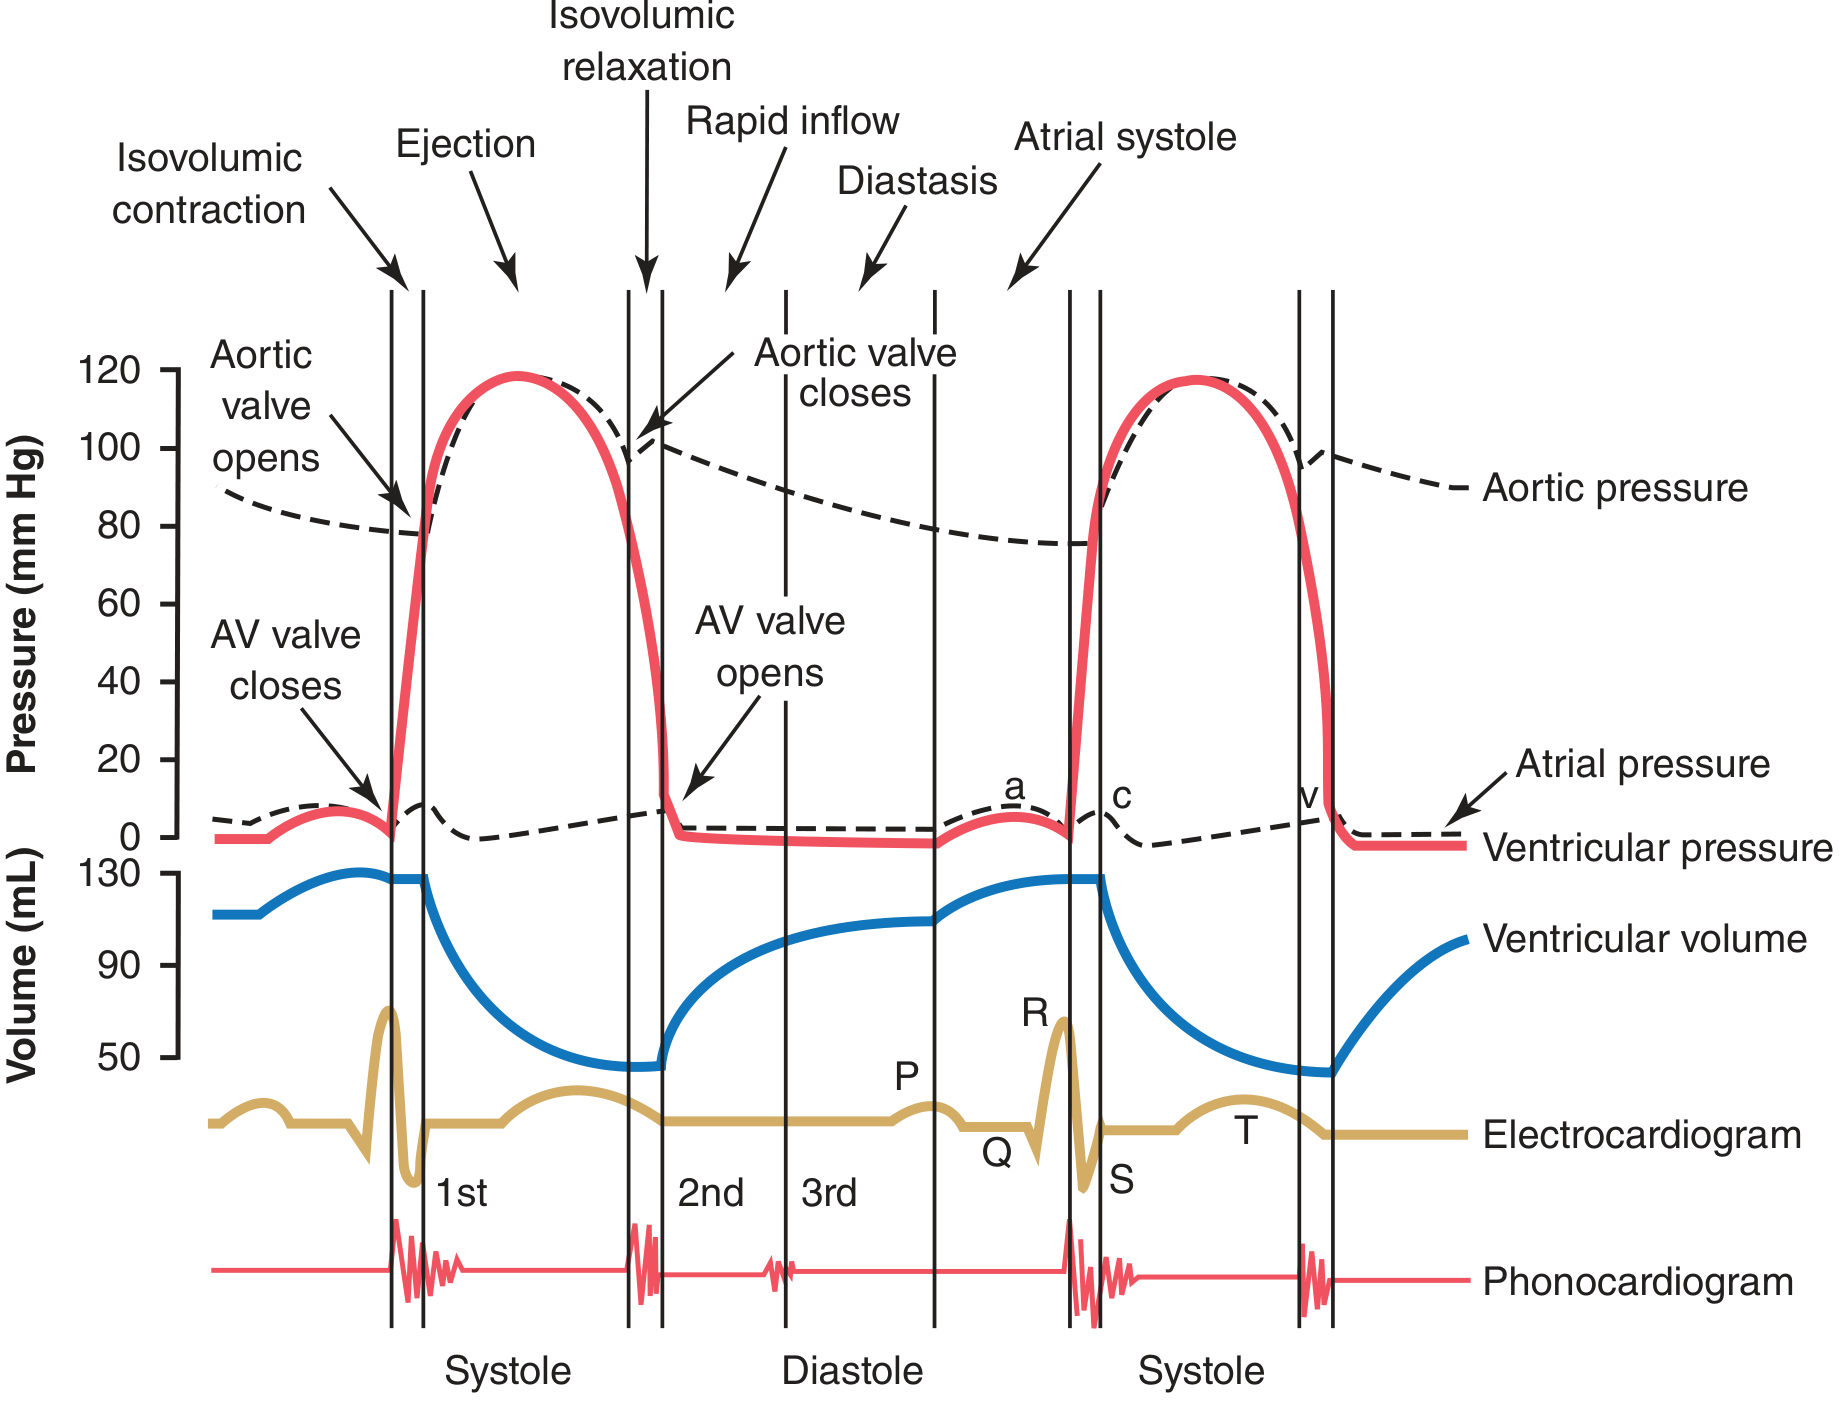
Figure 9.8 - Events of the cardiac cycle for left ventricular function. Guyton and Hall Textbook of Medical Physiology, 14th ed.
3. Detailed Costanzo Phase Diagram
The most comprehensive phase-by-phase diagram (Costanzo) with 7 labeled phases A-G, showing LV pressure, LV volume, aortic pressure, atrial pressure, venous pulse (a, c, v waves), heart sounds, and ECG:
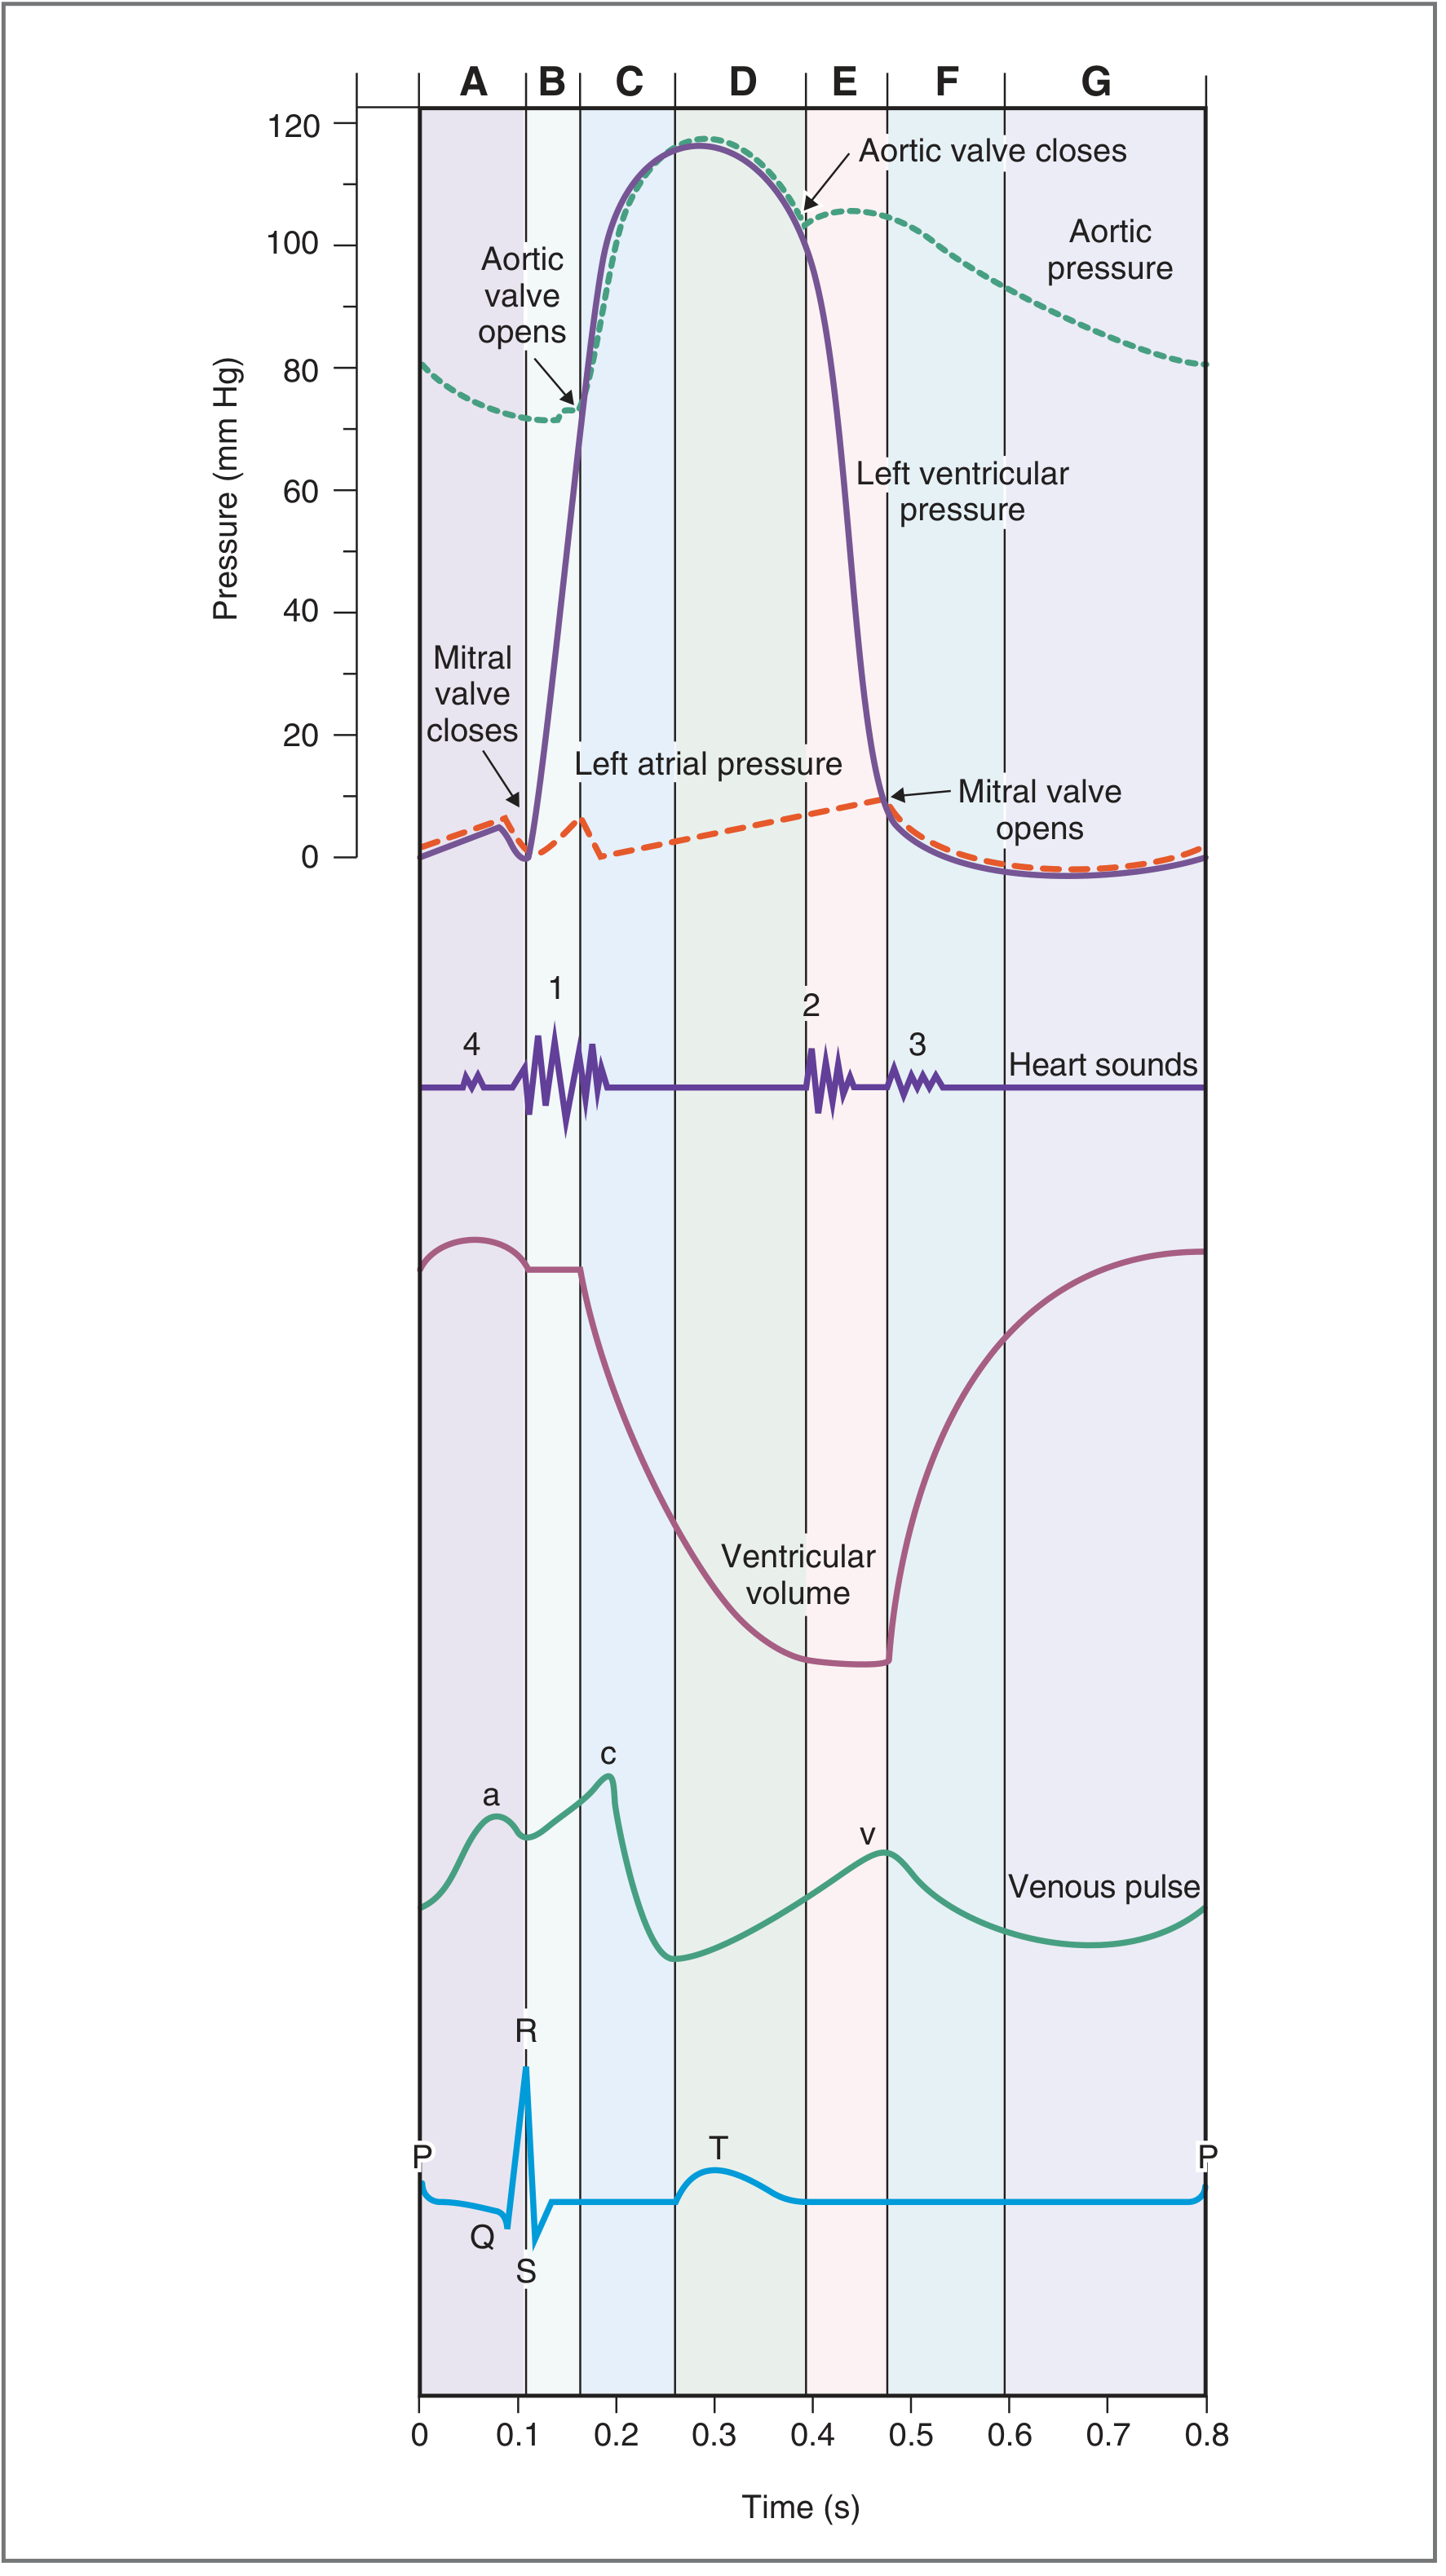
Fig. 4.25 - The cardiac cycle with 7 phases. Costanzo Physiology, 7th ed., p. 161
4. Seven Phases of the Cardiac Cycle (Costanzo Framework)
PHASE A - Atrial Systole
| Parameter | Events |
|---|---|
| ECG | P wave (atrial depolarization) → PR interval |
| Valves | Mitral and tricuspid (AV) valves open; aortic and pulmonary valves closed |
| LV Pressure | Slight "blip" rise as atrial contraction pushes blood in |
| LV Volume | Increases from ~100 mL to ~120-130 mL (EDV) - final 20-30% of filling |
| Atrial Pressure | Rises (this rise = a wave of venous pulse) |
| Heart Sounds | S4 - not heard in normal adults; heard in stiff ventricle (LVH, ischemia) |
Key concepts:
- Atria act as "primer pumps" or "booster pumps" for ventricles
- In healthy adults, ~70-80% of ventricular filling occurs passively before atrial systole (even before atria contract)
- Atrial contraction adds the final 20-30% of filling
- Three phases of atrial function: Reservoir → Conduit → Contractile - Guyton, p. 127
PHASE B - Isovolumetric Ventricular Contraction (IVC)
| Parameter | Events |
|---|---|
| ECG | QRS complex (ventricular depolarization) |
| Valves | Mitral closes (beginning of phase) → both AV and semilunar valves closed |
| LV Pressure | Rises sharply from ~5-8 mmHg toward aortic diastolic pressure (~80 mmHg) |
| LV Volume | Constant at EDV (~120-130 mL) - no blood moves |
| Heart Sounds | S1 ("lub") - mitral and tricuspid valve closure |
| Duration | ~0.02-0.03 s |
Key concepts:
- Mitral valve closes when LV pressure exceeds LA pressure
- Aortic valve cannot open until LV pressure exceeds aortic pressure (~80 mmHg)
- All 4 valves are closed → no ejection → volume constant, but tension rises
- Called "isovolumetric" = volume unchanged; called "isometric" = muscle tension increases without shortening
- Guyton, p. 128; Costanzo, p. 162
PHASE C - Rapid Ventricular Ejection
| Parameter | Events |
|---|---|
| ECG | ST segment |
| Valves | Aortic valve opens (LV pressure > aortic diastolic ~80 mmHg) |
| LV Pressure | Continues to rise; reaches maximum systolic pressure ~120 mmHg |
| LV Volume | Falls rapidly - ~70% of stroke volume ejected here |
| Aortic Pressure | Rises sharply (blood enters aorta faster than it runs off) |
| LA Pressure | Begins rising as blood returns from lungs, filling the atrium |
| Heart Sounds | None |
Key concepts:
- Aortic valve opens when LV pressure just exceeds aortic pressure
- Most of the stroke volume (~70%) is ejected in this rapid phase
- Peak aortic pressure = ~120 mmHg (systolic)
- Costanzo, p. 162
PHASE D - Reduced Ventricular Ejection
| Parameter | Events |
|---|---|
| ECG | T wave begins (ventricular repolarization) |
| Valves | Aortic valve still open |
| LV Pressure | Begins to fall (ventricle repolarizing/relaxing) |
| LV Volume | Continues to fall slowly; reaches end-systolic volume (ESV) ~50-60 mL at end of phase |
| Aortic Pressure | Falls because blood "runs off" into arterial tree faster than it is ejected |
| LA Pressure | Continues rising (blood pooling from pulmonary veins) |
Key concepts:
- Blood continues to be ejected despite falling LV pressure because momentum and still-open valve allow it
- The remaining ~30% of ejected volume leaves during this phase
- Ejection fraction (EF) = SV/EDV × 100 = (120-50)/120 × 100 = ~58-65% normally
- Costanzo, p. 163
PHASE E - Isovolumetric Ventricular Relaxation (IVR)
| Parameter | Events |
|---|---|
| ECG | End of T wave (complete repolarization) |
| Valves | Aortic valve closes (aortic pressure > LV pressure) → all 4 valves closed |
| LV Pressure | Falls rapidly toward very low values |
| LV Volume | Constant at ESV (~50-60 mL) |
| Heart Sounds | S2 ("dub") - aortic and pulmonary valve closure; dicrotic notch on aortic pressure tracing |
| Duration | ~0.03-0.06 s |
Key concepts:
- Aortic valve closes when aortic pressure exceeds LV pressure → aorta slightly higher than LV → backflow of blood pushes cusps shut
- Aortic valve closes before pulmonary valve (aortic pressure > pulmonary pressure)
- The brief backflow of blood that closes the aortic valve causes the dicrotic notch (incisura) on the aortic pressure curve
- Splitting of S2: On inspiration, reduced intrathoracic pressure → ↑ venous return → ↑ RV volume → prolonged RV ejection → pulmonary valve closes later → wider split
- Guyton, p. 128; Costanzo, p. 163
PHASE F - Rapid Ventricular Filling
| Parameter | Events |
|---|---|
| ECG | Isoelectric (after T wave, before next P wave) |
| Valves | Mitral valve opens (LV pressure < LA pressure) |
| LV Pressure | Remains very low (2-5 mmHg) |
| LV Volume | Rises rapidly - ~70% of diastolic filling occurs here |
| LA Pressure | Falls sharply as blood rushes into LV = y descent of venous pulse |
| Aortic Pressure | Falls gradually as blood runs off into peripheral arteries |
| Heart Sounds | S3 - caused by rapid distension of ventricle during filling; physiological in children/young adults; pathological in adults (= heart failure, dilated cardiomyopathy) |
Key concepts:
- Mitral valve opens when LV pressure drops below LA pressure
- The LA has been building up pressure during systole (phases B through E), creating a pressure gradient
- This phase is driven by the pressure gradient LA > LV and by ventricular suction (active relaxation/recoil)
- Guyton, p. 127; Costanzo, p. 163
PHASE G - Reduced Ventricular Filling (Diastasis)
| Parameter | Events |
|---|---|
| ECG | Isoelectric |
| Valves | Mitral valve still open |
| LV Pressure | Low and slowly equalizing with LA pressure |
| LV Volume | Rises slowly as LA-LV pressure gradient diminishes |
| LA Pressure | Low, slowly rising as venous blood refills the LA |
Key concepts:
- "Diastasis" = period of equalization of LA and LV pressures
- Very little blood moves during this phase
- At faster heart rates, this phase is first to be shortened or abolished - this is why tachycardia reduces diastolic filling
- Followed by the next P wave and return to Phase A
- Costanzo, p. 164
5. Summary Table of the Cardiac Cycle
| Phase | Duration | LV Pressure | LV Volume | Valve Events | ECG | Heart Sound |
|---|---|---|---|---|---|---|
| A Atrial Systole | ~0.1 s | Slight rise | EDV (~120-130 mL) | AV open, SL closed | P wave | S4 (abnormal) |
| B Isovolumetric Contraction | ~0.05 s | ↑ rapidly (0→80 mmHg) | Constant (EDV) | Mitral closes, all closed | QRS | S1 |
| C Rapid Ejection | ~0.1 s | ↑ peak ~120 mmHg | ↓↓ rapidly | Aortic opens | ST segment | - |
| D Reduced Ejection | ~0.1 s | ↓ slowly | ↓ → ESV (~50 mL) | Aortic open | T wave | - |
| E Isovolumetric Relaxation | ~0.05 s | ↓ rapidly | Constant (ESV) | Aortic closes, all closed | After T | S2 + dicrotic notch |
| F Rapid Filling | ~0.1 s | Low (~2-5 mmHg) | ↑↑ rapidly | Mitral opens | Isoelectric | S3 (abnormal in adults) |
| G Diastasis | ~0.2 s | Low, stable | ↑ slowly | Mitral open | Isoelectric | - |
Total systole (B+C+D) ≈ 0.27 s | Total diastole (E+F+G+A) ≈ 0.55 s
6. Atrial Pressure Waves (a, c, v waves) - Guyton
These three pressure waves appear on the atrial pressure tracing and on the jugular venous pulse (JVP):
| Wave | Timing | Cause | Abnormality |
|---|---|---|---|
| a wave | End of diastole (Phase A) | Atrial contraction → blood pushed into ventricle | ↑ in tricuspid stenosis, pulmonary HTN; absent in AF |
| c wave | Start of systole (Phase B) | AV valve bulging back into atrium + slight backflow at onset of ventricular contraction | Clinical correlate: tricuspid regurgitation |
| v wave | End of systole (Phase D-E) | Venous filling of atrium while AV valves are closed during systole | ↑ in mitral/tricuspid regurgitation (large v wave) |
| x descent | During systole (after c wave) | Atrial relaxation + downward displacement of AV junction | - |
| y descent | After v wave (Phase F) | AV valve opens → rapid emptying of atrium into ventricle | Absent/slow in tricuspid stenosis |
- Guyton, pp. 127-128
7. Volume-Pressure Loop (Guyton)
The pressure-volume loop traces one complete cardiac cycle on a graph of LV pressure (y-axis) vs. LV volume (x-axis):
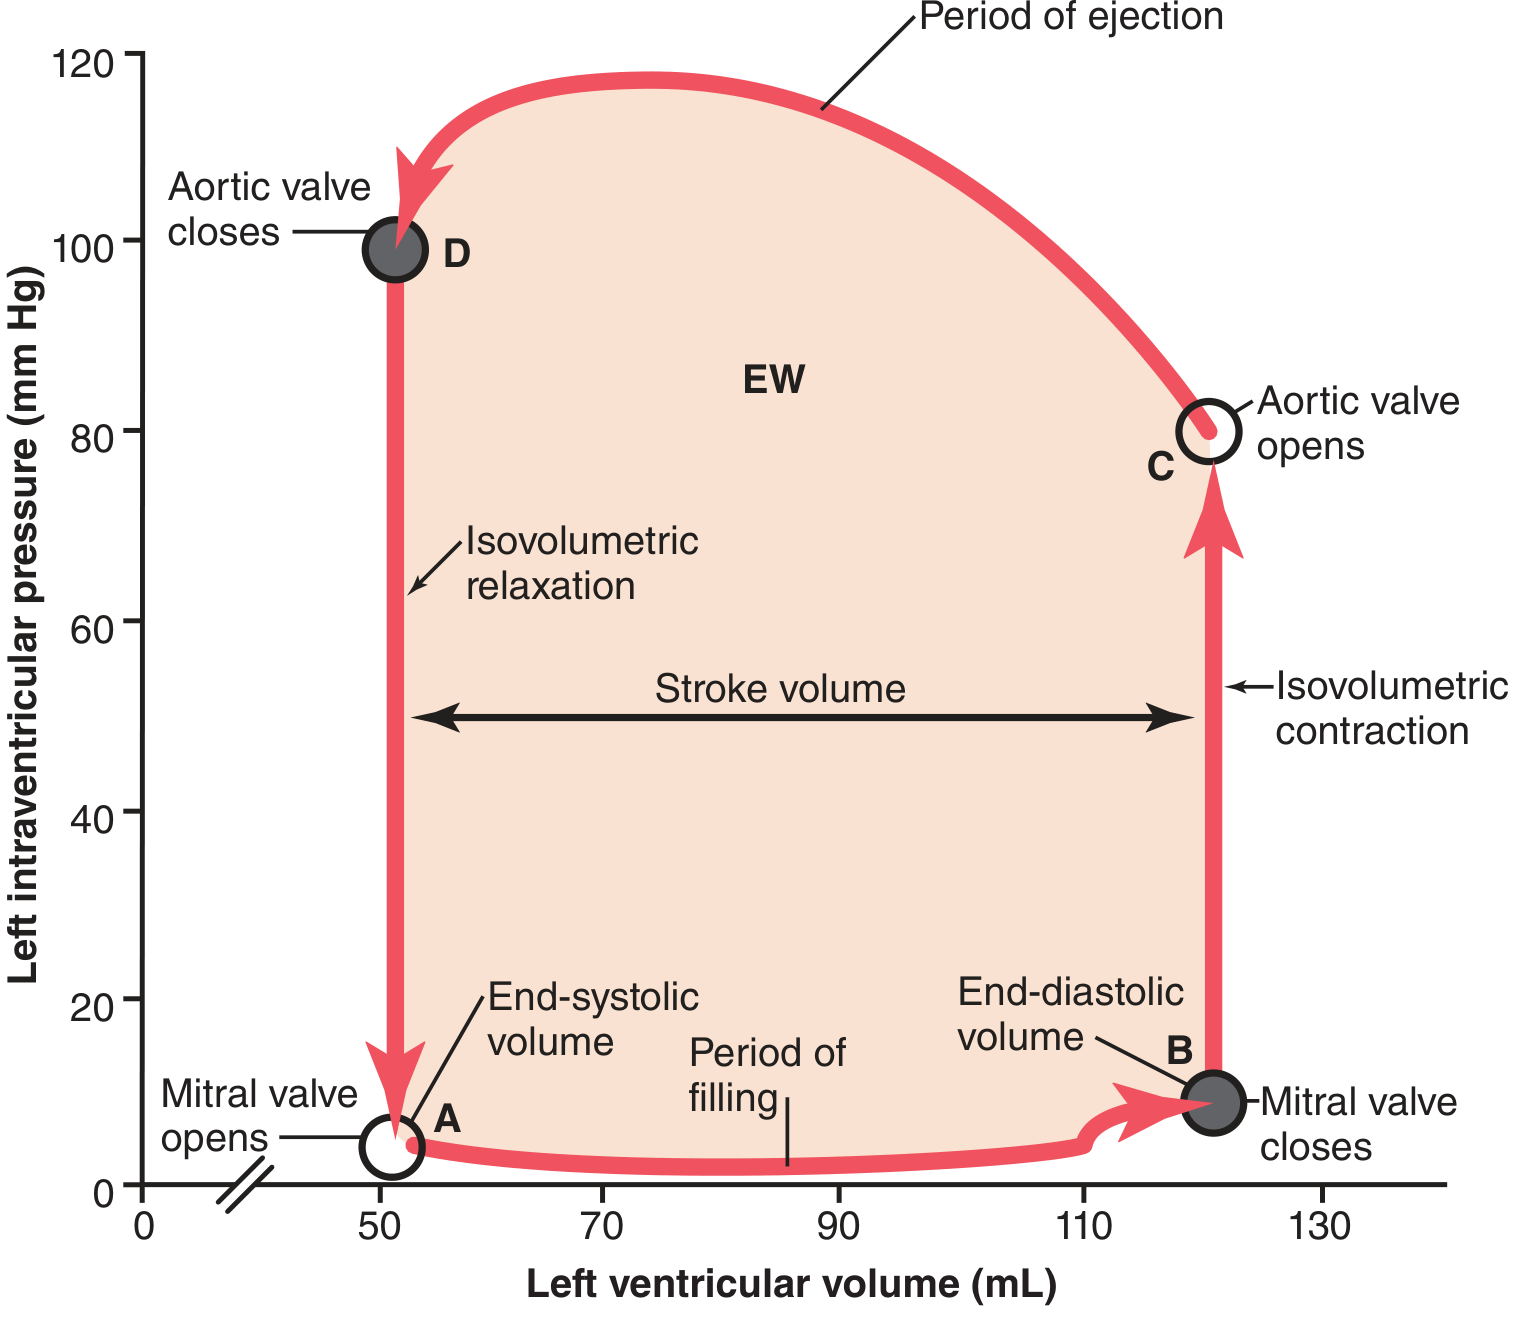
Figure 9.11 - The volume-pressure diagram (Wiggers loop). Guyton and Hall Textbook of Medical Physiology, 14th ed.
Four Phases of the Pressure-Volume Loop (Guyton)
| Phase | Points on Loop | Events |
|---|---|---|
| I - Filling | A → B | LV fills; volume rises from ESV (~50 mL) to EDV (~120 mL); pressure rises gently (2→5-7 mmHg) |
| II - Isovolumic Contraction | B → C | All valves closed; pressure rises steeply (5→80 mmHg); volume constant; B = mitral closes, C = aortic opens |
| III - Ejection | C → D | Aortic valve open; blood ejected; volume decreases to ESV; pressure peaks then falls |
| IV - Isovolumic Relaxation | D → A | All valves closed; pressure falls rapidly (100→2 mmHg); volume constant; D = aortic closes, A = mitral opens |
The area enclosed within the loop = Net External Work (EW) done by the heart per beat
Changes in preload (EDV), afterload, and contractility alter the shape of the loop:
- ↑ Preload → loop shifts right (wider loop, more SV)
- ↑ Afterload → loop shifts upward (less SV, same EDV)
- ↑ Contractility → loop shifts upward-left (same EDV, less ESV, more SV)
8. Normal Pressures and Volumes
| Parameter | Normal Value |
|---|---|
| End-diastolic volume (EDV) | 110-130 mL |
| End-systolic volume (ESV) | 50-60 mL |
| Stroke volume (SV) = EDV - ESV | ~70 mL |
| Ejection fraction (EF) = SV/EDV | 55-65% |
| Peak LV systolic pressure | ~120 mmHg |
| LV end-diastolic pressure (LVEDP) | 5-12 mmHg |
| Aortic diastolic pressure | ~80 mmHg |
| Aortic systolic pressure | ~120 mmHg |
| LA pressure (mean) | ~5-10 mmHg |
| RA pressure (mean) | ~2-6 mmHg |
| RV systolic pressure | ~25 mmHg |
| Pulmonary artery systolic/diastolic | 25/8 mmHg |
9. Heart Sounds Summary
| Sound | Phase | Cause | Normal/Abnormal |
|---|---|---|---|
| S1 ("lub") | Start of systole (Phase B) | Closure of mitral + tricuspid valves + vibration of ventricular walls | Normal |
| S2 ("dub") | End of systole (Phase E) | Closure of aortic + pulmonary valves; aortic before pulmonary | Normal |
| S3 (ventricular gallop) | Early diastole (Phase F) | Rapid ventricular filling → tensing of papillary muscles/chordae | Normal in children; Pathological in adults = heart failure, dilated CM |
| S4 (atrial gallop) | Late diastole (Phase A) | Atrial contraction against stiff/non-compliant ventricle | Pathological = LVH, aortic stenosis, hypertension, ischemia |
Split S2:
- Physiological: On inspiration - ↑ venous return → ↑ RV volume → prolonged RV ejection → pulmonary valve closes later (A2 before P2 widens)
- Fixed split: ASD (right heart volume remains constant regardless of respiration)
- Paradoxical split: On expiration - LBBB, aortic stenosis (aortic valve closes after pulmonary)
10. Valve Events Summary
| Event | Timing | What Triggers It |
|---|---|---|
| Mitral valve closes | Start of IVC (Phase B) | LV pressure > LA pressure |
| Aortic valve opens | End of IVC (Phase C) | LV pressure > Aortic diastolic pressure (~80 mmHg) |
| Aortic valve closes | Start of IVR (Phase E) | Aortic pressure > LV pressure (backflow) → dicrotic notch |
| Mitral valve opens | End of IVR (Phase F) | LV pressure < LA pressure |
All 4 valves open and close passively - driven entirely by pressure gradients, not active muscle contraction. - Guyton, p. 128
Papillary muscles: Contract simultaneously with ventricular walls, pulling chordae tendineae tight to prevent AV valve prolapse (not to close them). Papillary muscle rupture (e.g., post-MI) → severe mitral regurgitation.
11. Aortic Pressure Curve - Features (Guyton)
- Pre-ejection rise: Aortic pressure at 80 mmHg (diastolic) at start of ejection
- Sharp rise during rapid ejection → peak at ~120 mmHg
- Gradual fall during reduced ejection as blood runs off into peripheral arteries
- Dicrotic notch (incisura): Brief downward deflection at closure of aortic valve, caused by momentary backflow of blood that closes the valve, then a small rebound
- Continuous fall during diastole back to 80 mmHg
- Guyton, p. 128
12. Effect of Heart Rate on the Cardiac Cycle
When heart rate increases:
- Total cycle duration decreases (reciprocal of HR)
- Diastole shortens disproportionately more than systole
- At 72 bpm: systole = ~40% of cycle; at 3× normal HR: systole = ~65% of cycle
- At very high heart rates: diastasis (Phase G) is first abolished, then rapid filling (Phase F) is shortened
- Result: inadequate ventricular filling → decreased stroke volume → may reduce CO despite high HR
Guyton, p. 127; Costanzo
| HR (bpm) | Cycle Duration (s) | Systole (s) | Diastole (s) |
|---|---|---|---|
| 60 | 1.0 | 0.30 | 0.70 |
| 72 | 0.833 | 0.30 | 0.533 |
| 120 | 0.50 | 0.28 | 0.22 |
| 200 | 0.30 | 0.26 | 0.04 |
13. Right Heart Cardiac Cycle
The right heart follows the same cycle sequence but with lower pressures:
| Parameter | Left Heart | Right Heart |
|---|---|---|
| Systolic pressure | ~120 mmHg | ~25 mmHg |
| Diastolic pressure | ~80 mmHg | ~8 mmHg |
| End-diastolic pressure | 5-12 mmHg | 2-6 mmHg |
| Valves involved | Mitral (AV), Aortic (SL) | Tricuspid (AV), Pulmonary (SL) |
- RV is a thin-walled, low-pressure pump - more susceptible to pressure overload (pulmonary hypertension)
- Pulmonary valve closes slightly after aortic valve → explains normal S2 splitting
14. Key Exam Facts
- Cardiac cycle duration = 1/HR; at 72 bpm = 0.833 s
- First event of systole = Mitral valve closure (S1); last event = Aortic valve closure (S2)
- During IVC and IVR: all 4 valves are closed; ventricular volume is constant
- EDV ~120-130 mL; ESV ~50-60 mL; SV ~70 mL; EF ~60%
- S1 = AV valve closure (mitral before tricuspid); S2 = semilunar valve closure (aortic before pulmonary)
- S3 = rapid filling, early diastole; S4 = atrial systole, late diastole
- a wave = atrial contraction; c wave = AV valve bulge; v wave = venous filling
- Dicrotic notch = aortic valve closure; marks transition from systole to diastole on aortic pressure tracing
- Diastasis = period of equalization of LA-LV pressure; first phase abolished in tachycardia
- 60% of ventricular contents ejected (= ejection fraction); 70% of ejected volume during rapid ejection
- Atrial contribution to filling = 20-30% (lost in AF → reduced CO especially in stiff ventricles)
- Area of P-V loop = cardiac work done per beat
- Aortic valve opens when LV pressure > 80 mmHg; Mitral valve opens when LV pressure < LA pressure (~5-8 mmHg)
Sources:
- Guyton and Hall Textbook of Medical Physiology, 14th ed. - Chapter 9 (Cardiac Muscle; The Heart as a Pump)
- Costanzo Physiology, 7th ed. - Chapter 4 (Cardiovascular Physiology, Cardiac Cycle Phases A-G)
- Ganong's Review of Medical Physiology, 26th ed. - Chapter 30 (The Heart as a Pump)
This is a shared conversation. Sign in to Orris to start your own chat.