
Can you help me to study ecg and read an ecg
What's your current level with ECGs? · What would you like to focus on?
All should know by a mbbs student
normal 12 lead ECG with labeled waves P QRS T
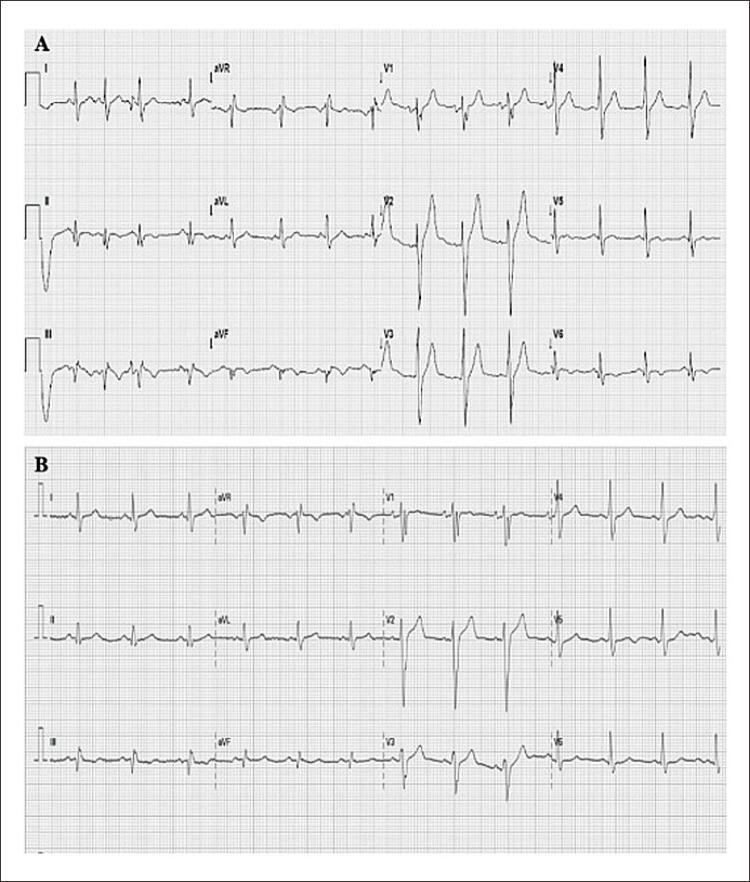
This diagnostic image displays two 12-lead electrocardiograms (ECGs) labeled Panel A and Panel B, presented on standard grid paper for clinical comparison. Panel A shows a 12-lead ECG demonstrating sinus rhythm with normal P-wave morphology. The QRS complexes exhibit nonspecific intraventricular conduction disturbances, characterized by widened or slurred morphologies in certain leads, notably the precordial leads V1-V6. Panel B shows a subsequent ECG from the same patient. Comparison between the two panels reveals subtle variations in waveform amplitude and ST-segment baseline, though both lack overt ST-segment elevation. The precordial leads (V1-V6) show a typical progression of R-wave amplitude, while lead aVR shows the expected global inversion of P, QRS, and T waves. This comparison is used in cardiology to monitor electrical changes during acute coronary syndromes, such as Non-ST Segment Elevation Myocardial Infarction (NSTEMI), where conduction disturbances may be present despite the absence of classic ST-elevation.
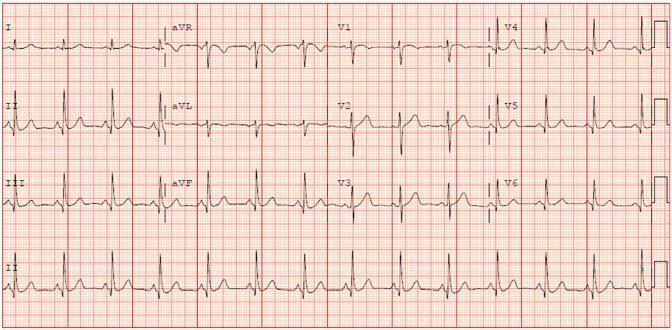
A standard 12-lead electrocardiogram (ECG) displayed on a red grid background with a rhythm strip (Lead II) at the bottom. The tracing demonstrates a normal sinus rhythm characterized by regular P waves preceding every QRS complex. The QRS complexes are narrow and uniform in morphology. Key findings include a slightly shortened PR interval and minimal, non-specific ST-segment depression localized in the inferior leads (II, III, and aVF). The T-waves remain generally upright across the precordial and limb leads, without evidence of significant inversion or hyperacute changes. The R-wave progression in the precordial leads (V1-V6) is normal. This diagnostic image is representative of basic cardiac electrophysiology monitoring, often used to assess for ischemia, conduction delays, or baseline rhythm disturbances in a clinical setting.
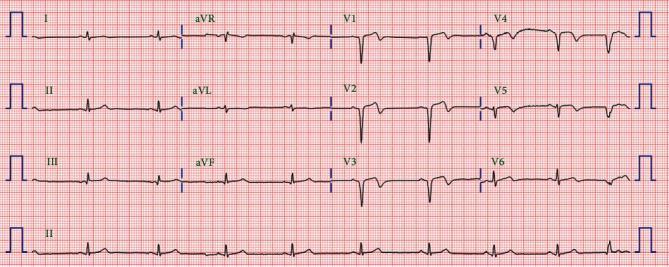
A standard 12-lead electrocardiogram (ECG) displayed on a traditional red grid background. The tracing demonstrates a normal sinus rhythm with a regular rate and consistent P-wave morphology preceding each narrow QRS complex. The axis appears normal with positive QRS deflections in leads I and aVF. There is normal R-wave progression across the precordial leads (V1-V6), characterized by an increasing R-wave amplitude and decreasing S-wave depth as the transition occurs from V1 to V5. Of clinical importance in this post-percutaneous coronary intervention (PCI) context, the ST segments are isoelectric without evidence of acute elevation or depression, and the T waves are largely upright in the lateral leads. Notably, the QT interval is within normal limits, demonstrating no signs of prolongation. This ECG serves as a baseline comparison for evaluating subsequent rhythmic stability or drug-induced repolarization abnormalities in patients treated for myocardial infarction.
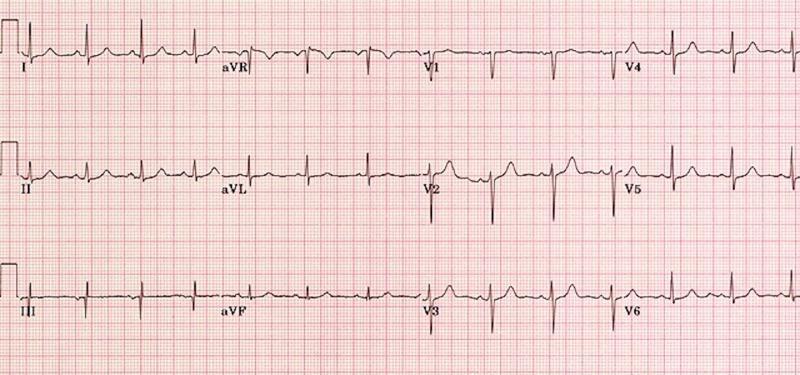
A standard 12-lead electrocardiogram (ECG) displayed on a red grid background, representing a diagnostic image for cardiovascular assessment. The tracing shows a normal sinus rhythm with consistent P-wave morphology followed by QRS complexes. The QRS complexes are relatively narrow (less than 120 ms), indicating normal ventricular depolarization, and appear upright in the lateral leads (I, aVL, V5, V6) and inferior leads (II, III, aVF). T-waves are generally upright and exhibit normal amplitude across most leads, with expected inversion in lead aVR. There is no evidence of ST-segment elevation or depression, pathological Q-waves, or significant rhythm disturbances. This ECG is used in a clinical education context to demonstrate findings within normal limits for a patient presenting with metabolic alkalosis, helping learners rule out cardiac causes for altered mental status such as arrhythmias or electrolyte-induced conduction delays.
ECG myocardial infarction ST elevation STEMI leads
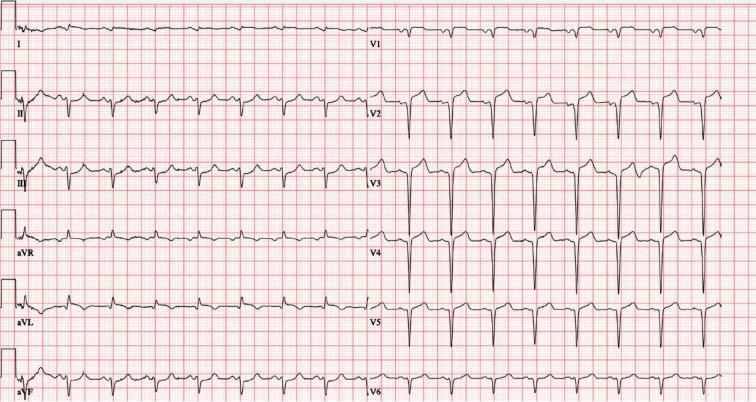
This is a 12-lead electrocardiogram (ECG) demonstrating an acute ST-segment elevation myocardial infarction (STEMI). The diagnostic hallmark is prominent ST-segment elevation across the precordial leads V1 through V6, with the most significant convex elevation appearing in leads V2, V3, and V4. These findings are highly characteristic of an acute anterior wall infarction, typically involving the left anterior descending (LAD) coronary artery. In the limb leads, mild ST-segment elevation is also visible in leads I, II, III, and aVF, accompanied by positive, upright T waves. Lead aVR shows expected global inversion. The tracing displays a sinus rhythm with regular morphology, but the ST-segment deviations from the isoelectric baseline indicate acute myocardial injury. This visual material is a critical educational tool for teaching the ECG localization of coronary occlusions and the identification of STEMI criteria in an emergency clinical context.
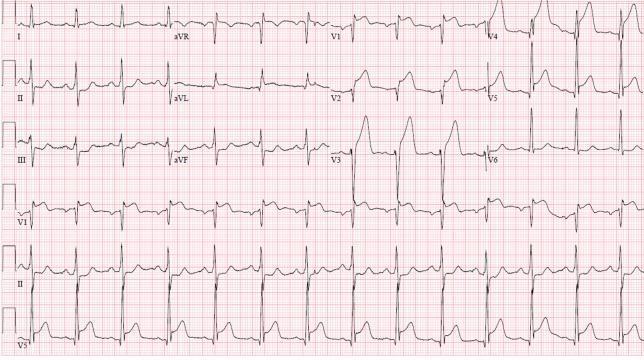
A 12-lead electrocardiogram (ECG) demonstrating an acute anterolateral ST-elevation myocardial infarction (STEMI). The tracing shows significant, convex-upward ST-segment elevation in the precordial leads (V1–V6), consistent with an anterior wall injury. Leads I and aVL also display ST-elevation, indicating lateral involvement. These changes are accompanied by hyperacute, peaked T-waves most prominent in V2 through V4. There is evidence of reciprocal ST-segment depression in the inferior leads (II, III, and aVF). The QRS complexes appear widened in the leads with maximal ST elevation. The heart rhythm is sinus. This ECG pattern is clinically significant for proximal left anterior descending (LAD) artery occlusion, necessitating urgent reperfusion therapy. The visual presentation focuses on teachable hallmarks of cardiac ischemia, including the relationship between anatomical lead distribution and corresponding vascular territories, as well as the identification of reciprocal changes in opposing leads.
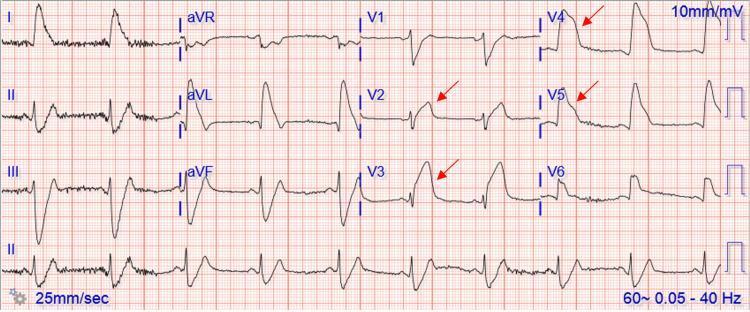
This diagnostic image is a 12-lead electrocardiogram (ECG) demonstrating an ST-elevation myocardial infarction (STEMI). The tracing exhibits significant ST-segment elevation across several leads, most prominently marked with red arrows in the precordial leads V2, V3, V4, and V5. The ST-segments show a convex-upward (coved) morphology, characteristic of acute myocardial injury. Additionally, there is evident ST-segment elevation in the lateral leads (I, aVL) and hyperacute T-waves. Leads II, III, and aVF show reciprocal ST-segment depression. The cardiac rhythm appears to be a sinus bradycardia, with a visible P-wave preceding each QRS complex. The tracing is set at a standard paper speed of 25 mm/sec and a voltage calibration of 10 mm/mV. This ECG is a critical educational tool for identifying the 'tombstone' ST-elevation pattern associated with proximal left anterior descending artery (LAD) or left main coronary artery occlusion, correlating with extensive anterior-lateral wall ischemia.
ECG atrial fibrillation irregular rhythm absent P waves
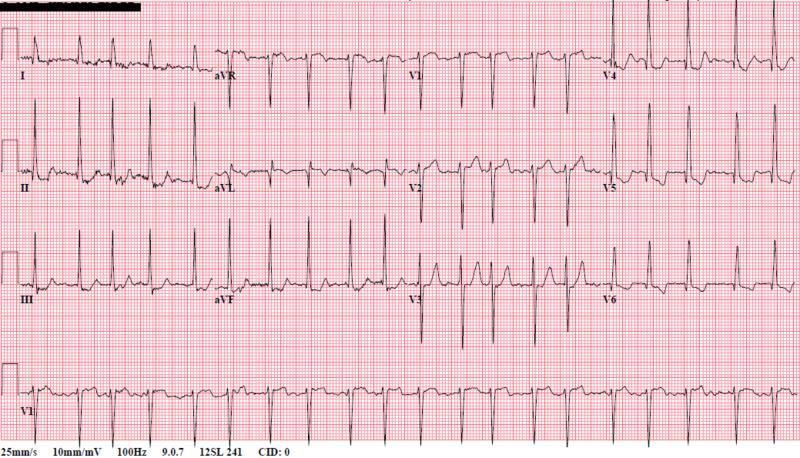
A 12-lead electrocardiogram (ECG) demonstrating a classic irregularly irregular rhythm consistent with atrial fibrillation. The diagnostic image shows absent P waves across all leads, replaced by fine, chaotic baseline fibrillatory waves, most notably visible in lead V1 and the rhythm strip. The R-R intervals are highly variable, with a rapid ventricular response (tachycardia) evident from the frequent QRS complexes. The QRS morphology is relatively narrow (normal duration), indicating supraventricular origin. There is evidence of left axis deviation and voltage criteria suggestive of left ventricular hypertrophy, particularly in the precordial leads V4-V6. Non-specific ST-segment and T-wave changes are observed, which may be secondary to the rapid rate. This ECG is a critical educational tool for identifying disorganized atrial electrical activity and the subsequent irregular ventricular conduction pattern characteristic of AFib with RVR.
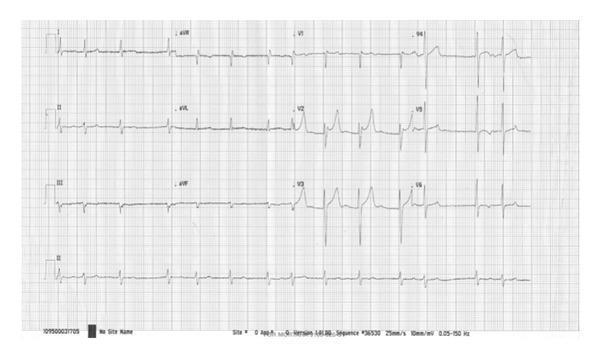
A 12-lead electrocardiogram (ECG) tracing demonstrating a rhythm significant for atrial fibrillation and severe repolarization abnormalities. The baseline shows absent P waves with irregular R-R intervals consistent with atrial fibrillation. Key morphological findings include a markedly prolonged QT interval, measured at 610 ms, which significantly exceeds the normal range and increases the risk for Torsades de Pointes. Notable T-wave changes are present, specifically deep, symmetric T-wave inversions observed across the precordial leads (V1-V6) and inferior leads (II, III, aVF). The QRS complexes appear narrow, and there is a concurrent bradyarrhythmia with a ventricular rate of approximately 48 beats per minute. This visual clinical diagnostic tool is essential for identifying secondary QT prolongation and monitoring for malignant ventricular arrhythmias in patients with underlying conditions such as infective endocarditis.
ECG bundle branch block left right QRS morphology
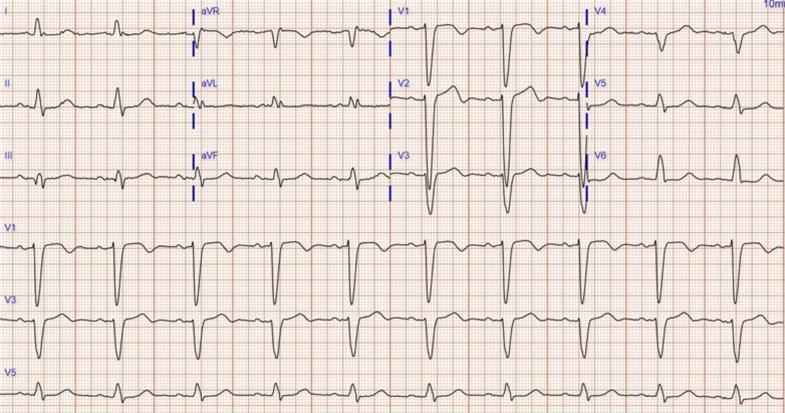
This diagnostic image is a 12-lead electrocardiogram (ECG) demonstrating classic features of a Left Bundle Branch Block (LBBB). The tracing shows a wide QRS complex (168 ms) with a predominantly negative QS morphology in the right precordial leads (V1-V3) and broad, monophasic R-waves in the lateral leads (I, aVL, V5, and V6). The QRS complexes exhibit characteristic slurring and notching, particularly evident in lead V1. Secondary ST-T wave abnormalities are present, including ST-segment depression and T-wave inversion in the lateral leads (V5-V6), which are discordant to the QRS direction. Additionally, the tracing displays significant QTc prolongation (567 ms). This ECG serves as a clinical archetype for diagnosing ventricular conduction delays and is relevant for cardiology students and clinicians managing patients with heart failure or those undergoing cardiac resynchronization therapy.
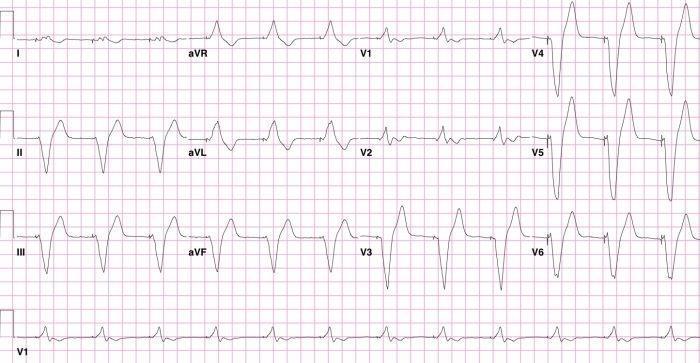
A 12-lead electrocardiogram (ECG) demonstrating a ventricular paced rhythm with a Right Bundle Branch Block (RBBB) morphology, indicative of inadvertent endocardial left ventricular (LV) lead placement. Visible pacing spikes precede each wide QRS complex. The QRS morphology in the precordial leads shows a transition from predominantly negative complexes in V1-V2 to tall, positive R-waves in leads V4-V6. Specifically, V1 displays a broad, slurred complex with terminal positivity, while V4-V6 exhibit prominent R-waves followed by minor secondary deflections. Secondary ST-T wave changes are present, including T-wave inversion in V1-V2 and upright T-waves in V4-V6 and the inferior leads (II, III, aVF). Minor ST-segment depression is noted in the lateral leads (V5-V6). This educational visual highlights the clinical significance of paced RBBB patterns in diagnosing lead malposition via an atrial septal defect into the left ventricle, which contrasts with the expected Left Bundle Branch Block (LBBB) pattern typically seen with right ventricular pacing.
cardiac axis ECG leads frontal plane hexaxial reference system
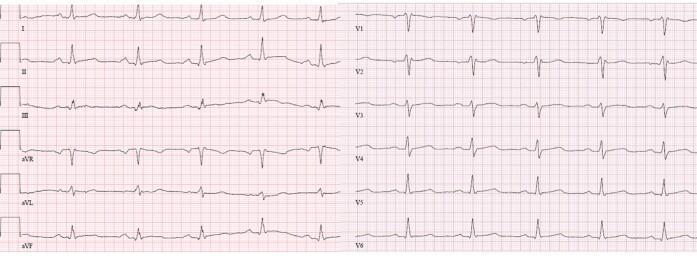
A standard 12-lead electrocardiogram (ECG) displayed on a traditional grid background, showing leads I, II, III, aVR, aVL, aVF, and V1 through V6. The tracing illustrates a consistent sinus rhythm with regular RR intervals. P waves are clearly visible preceding each QRS complex. The frontal plane leads (I, II, aVF) demonstrate predominantly upright QRS complexes, indicating a normal cardiac axis. In the precordial leads (V1-V6), there is appropriate R-wave progression from V1 to V6. The ST segments appear largely isoelectric across all leads without evidence of acute elevation or significant depression. T-wave morphology is varied, with upright T waves in most lateral and inferior leads, while V1-V3 show minor variations including flattening or inversion. This diagnostic image serves as an educational example of a baseline resting ECG for cardiovascular assessment, highlighting normal rhythm, axis orientation, and ventricular repolarization patterns.
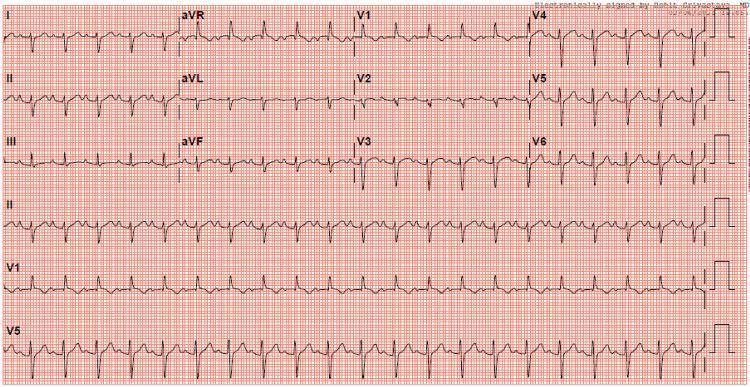
A 12-lead electrocardiogram (ECG) displayed on a standard red grid background, demonstrating sinus tachycardia with a heart rate exceeding 100 bpm. The frontal plane axis shows extreme right axis deviation, evidenced by a predominantly negative QRS complex in lead I and aVR, and positive deflections in leads II, III, and aVF. Key diagnostic features of right ventricular hypertrophy (RVH) are present, most notably a tall R wave in lead V1 (R/S ratio > 1) and a persistent deep S wave in lead V6. The precordial leads show a delayed R-wave progression. T-wave inversions are visible in the right precordial leads (V1-V3), which can be associated with a right ventricular strain pattern. This diagnostic image serves as a clinical example of cardiac electrical changes secondary to right heart pressure or volume overload, commonly seen in conditions such as pulmonary hypertension or severe myocarditis.
ECG for MBBS Students - Complete Guide
PART 1: WHAT IS AN ECG AND HOW IT WORKS
- Rate - how fast the heart is beating
- Rhythm - whether the electrical pattern is regular and normal
- Axis - the overall direction of electrical spread
- Conduction - time taken for impulses to travel through different parts
- P wave - atrial depolarization (atria contract)
- QRS complex - ventricular depolarization (ventricles contract)
- T wave - ventricular repolarization (ventricles reset)
PART 2: ECG PAPER AND MEASUREMENTS
- Small box = 1 mm wide = 0.04 seconds (horizontally) = 0.1 mV (vertically)
- Large box = 5 mm wide = 0.20 seconds
- 5 large boxes = 1 second | 25 large boxes = 5 seconds (rhythm strip)
Normal Intervals (MUST MEMORIZE)
| Interval/Wave | Duration | What It Represents |
|---|---|---|
| P wave | < 0.12 s (< 3 small boxes) | Atrial depolarization |
| PR interval | 0.12 - 0.20 s (3-5 small boxes) | AV node conduction time |
| QRS complex | < 0.12 s (< 3 small boxes) | Ventricular depolarization |
| QT interval | < 0.44 s (rate-corrected QTc) | Ventricular action potential duration |
| ST segment | Isoelectric (flat) | Period between depol. and repol. |
PART 3: THE 12 LEADS - WHAT EACH ONE SEES
Limb Leads (Frontal Plane)
| Lead | Looks At | Artery |
|---|---|---|
| I | Left lateral | LCx |
| II | Inferior | RCA |
| III | Inferior | RCA |
| aVR | Right atrium / cavity | - |
| aVL | High lateral | LCx / Diagonal |
| aVF | Inferior | RCA |
Precordial Leads (Horizontal Plane)
| Lead | Location | Looks At |
|---|---|---|
| V1 | 4th ICS, right sternal border | Septal |
| V2 | 4th ICS, left sternal border | Septal |
| V3 | Between V2 and V4 | Anterior |
| V4 | 5th ICS, midclavicular line | Anterior |
| V5 | Anterior axillary line | Lateral |
| V6 | Midaxillary line | Lateral |
PART 4: SYSTEMATIC APPROACH TO READING ANY ECG
Step 1: RATE
- 1 box = 300 bpm | 2 boxes = 150 | 3 boxes = 100 | 4 boxes = 75 | 5 boxes = 60 | 6 boxes = 50
- Normal: 60-100 bpm | Tachycardia: >100 | Bradycardia: <60
Step 2: RHYTHM
- Are the R-R intervals regular?
- Is there a P wave before every QRS?
- Is there a QRS after every P wave?
- Is the P wave morphology normal (upright in II, biphasic in V1)?
- Normal sinus rhythm = regular, P before every QRS, rate 60-100
Step 3: AXIS
| Lead I | aVF | Axis |
|---|---|---|
| + | + | Normal (-30° to +90°) |
| + | - | Left axis deviation (LAD) |
| - | + | Right axis deviation (RAD) |
| - | - | Extreme/indeterminate |
Step 4: P WAVE
- Present and upright in I, II, aVF?
- Inverted in aVR (always normal)?
- Duration < 0.12s, amplitude < 2.5 mm in II?
- Biphasic in V1? (terminal negative portion > 1 box = LAE)
Step 5: PR INTERVAL
- Normal = 0.12-0.20s
- Short PR (<0.12s): WPW syndrome, junctional rhythm
- Long PR (>0.20s): 1st degree AV block
Step 6: QRS COMPLEX
- Duration < 0.12s (narrow = supraventricular; wide = bundle branch block, ventricular origin)
- Pathological Q waves = >1 small box wide OR >25% height of R wave in same lead
- R wave progression V1→V6: should gradually increase (poor R-wave progression = anterior MI or LBBB)
Step 7: ST SEGMENT, T WAVE, QT INTERVAL
- ST elevation: >1 mm in limb leads, >2 mm in precordial leads = STEMI / pericarditis
- ST depression: ischemia, NSTEMI, digoxin effect
- T wave inversion: ischemia, RBBB, PE
- QTc >440ms (men) / >460ms (women) = long QT syndrome
PART 5: NORMAL ECG - REFERENCE IMAGE
PART 6: COMMON ECG PATTERNS YOU MUST KNOW
6A. STEMI (ST-Elevation Myocardial Infarction)
- Convex (tombstone/saddleback) ST elevation ≥1-2 mm in 2 contiguous leads
- Reciprocal ST depression in opposite leads
- Progresses: hyperacute T waves → ST elevation → Q waves → T inversion
| ST Elevation In | Wall Affected | Artery |
|---|---|---|
| V1-V4 | Anterior | LAD |
| V5, V6, I, aVL | Lateral | LCx |
| II, III, aVF | Inferior | RCA |
| V1 (tall R), ST depression | Posterior | RCA/LCx (use V7-V9) |
| V1-V4 + right heart leads | Anterior + RV | Proximal LAD / RCA |
6B. Atrial Fibrillation (AF)
- No P waves - replaced by irregular fibrillatory baseline (best seen in V1)
- Irregularly irregular R-R intervals (no two intervals the same)
- Narrow QRS (unless aberrant conduction)
6C. Bundle Branch Blocks (BBB)
- RSR' ("M" pattern) in V1 - "rabbit ears"
- Wide, slurred S wave in I, V5, V6
- T wave inversion in V1-V3 (normal/secondary change)
- Causes: RV volume overload, PE, ASD, normal variant
- Broad R wave (no Q) in I, V5, V6
- QS or rS in V1 - completely negative
- T wave discordant to QRS (opposite direction)
- Causes: CAD, cardiomyopathy, hypertension - ALWAYS pathological
- LBBB makes MI diagnosis very difficult (Sgarbossa criteria needed)
6D. AV Blocks
| Type | PR Interval | Dropped Beats | Treatment |
|---|---|---|---|
| 1st degree | >0.20s (constant) | None | None needed |
| 2nd degree Mobitz I (Wenckebach) | Progressively lengthens → drop | QRS occasionally drops | Usually benign |
| 2nd degree Mobitz II | Constant → sudden drop | QRS drops without warning | Pacemaker often needed |
| 3rd degree (complete) | No relationship between P & QRS | All relationship lost | Pacemaker urgent |
6E. Other Important Patterns
- Normal P-QRS-T, just fast
- Causes: fever, pain, anxiety, PE, hemorrhage, hyperthyroidism
- Completely chaotic, no identifiable waveforms
- Medical emergency - cardiac arrest, defibrillate immediately
- Wide QRS tachycardia (>0.12s) at rate >100 bpm
- Regular, bizarre morphology
- If sustained and with pulse: cardiovert | pulseless: defibrillate
- Short PR (<0.12s) + delta wave (slurred upstroke of QRS) + wide QRS
- Accessory pathway bypasses AV node
- Early: tall, narrow, peaked ("tented") T waves
- Late: wide QRS, sine wave pattern → VF
- QTc >440ms (men), >460ms (women)
- Risk of Torsades de Pointes (a type of VT)
- Causes: drugs (quinidine, amiodarone, macrolides), hypokalaemia, congenital
PART 7: QUICK MEMORY AIDS
ECG Reading Checklist (say it aloud every time)
- Rate
- Rhythm
- Axis
- P wave
- PR interval
- QRS
- ST, T wave, QT
Lead Groupings for MI Localization
- Inferior: II, III, aVF (look at the floor of the heart)
- Anterior: V1-V4 (look at the front wall)
- Lateral: I, aVL, V5, V6 (look at the side wall)
- Posterior: Tall R + ST depression in V1-V2 (add posterior leads V7-V9 to confirm)
The "Width and Height" Rule
- Wide QRS = something wrong with ventricular conduction (BBB, VT, WPW, pacemaker)
- Tall QRS = hypertrophy (LVH: S in V1 + R in V5/V6 >35 mm; RVH: tall R in V1)
PART 8: PRACTICE APPROACH - HOW TO READ ANY ECG IN AN EXAM
- Start with the rhythm strip (usually Lead II at the bottom)
- Go through all 7 steps systematically
- Look at all 12 leads grouped by territory (inferior, anterior, lateral)
- Write your findings as: "This is a 12-lead ECG showing sinus rhythm at 75 bpm, normal axis, normal intervals, with ST elevation in leads II, III, aVF consistent with acute inferior STEMI with reciprocal changes in I and aVL."