


tell me about the ecg with possiblr risk factor and the patient come with complaint of vertigo and vomiting and bp was 150/90 please tell me about the ecg with possible diagnose and suggestive treatment plan
anterior myocardial infarction ECG 12 lead poor R wave progression
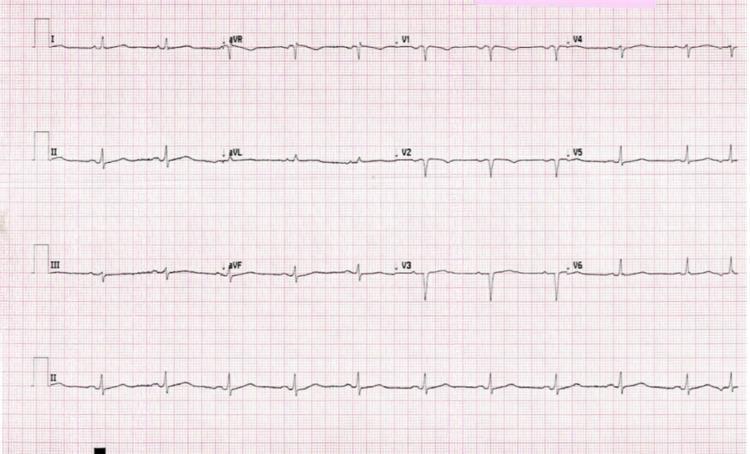
A standard 12-lead electrocardiogram (ECG) displayed on a pink grid. The tracing demonstrates a sinus rhythm with several diagnostic abnormalities. In the precordial leads (V1-V6), there is evidence of poor R-wave progression, characterized by low-amplitude R waves that fail to increase appropriately across the chest leads. Pathological Q-waves are present in the anterior and lateral leads (V1 through V6), suggesting a prior anterolateral myocardial infarction or significant underlying cardiomyopathy. The voltage across the leads is generally low. Morphological changes in the P-waves are visible, specifically a biphasic P-wave in lead II and a prominent negative terminal deflection of the P-wave in lead V1, which are classic indicators of left atrial enlargement (P mitrale). A premature atrial contraction (PAC) is also observable in the rhythm strip. This diagnostic image is intended for medical students and clinicians to recognize patterns of atrial enlargement, poor R-wave progression, and low-voltage ECG readings in the context of cardiovascular pathology.
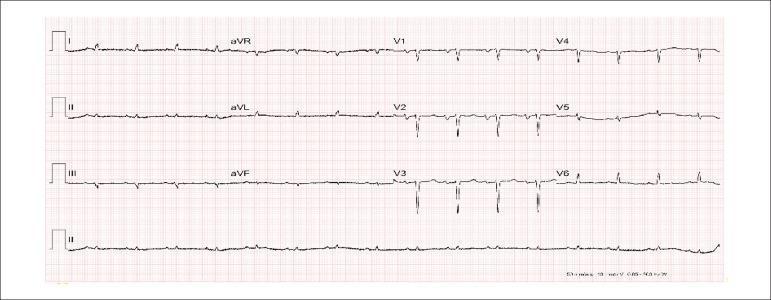
A 12-lead electrocardiogram (ECG) trace presented on standard grid paper, demonstrating several pathological findings. The rhythm is sinus with a heart rate of approximately 97 bpm. Key features include low QRS voltage in the frontal plane leads (I, II, III, aVR, aVL, aVF) and a notable poor R-wave progression across the precordial leads, specifically from V1 to V4, where the R-wave fails to gain amplitude; this finding is highly suggestive of an electrically inactive area in the anterior myocardial wall. P-wave morphology in leads II and V1 indicates left atrial overload, characterized by increased duration and potential notching. Additionally, the ECG shows indirect signs of right atrial overload (Peñaloza-Tranchesi sign) and diffuse non-specific ST-segment and T-wave abnormalities indicating ventricular repolarization changes. These findings collectively suggest chronic cardiac remodeling, potentially secondary to dilated cardiomyopathy or an old anterior wall myocardial infarction.
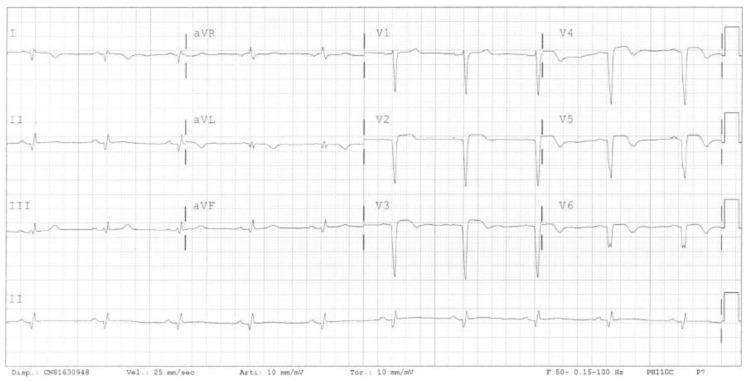
A standard 12-lead electrocardiogram (ECG) displayed in a 3x4 layout plus a rhythm strip, demonstrating a patient in normal sinus rhythm with significant pathological findings. The tracing reveals deep, pathological Q waves and poor R-wave progression across the precordial leads (V1 to V4), indicative of transmural myocardial necrosis. Associated ST-segment elevation and T-wave inversion are observed in the anterior-lateral leads (V1-V6), suggesting an ongoing or recent myocardial injury/infarct pattern. These findings are clinically significant for identifying a localized area of scarring and active ischemia in the anterior-lateral left ventricular wall. The modality is a diagnostic ECG on standard grid paper (25 mm/sec, 10 mm/mV), which is a critical tool for medical students and clinicians in identifying ischemic heart disease and localizing myocardial infarction.
ECG Analysis & Clinical Management
ECG Parameters (from the printed report)
| Parameter | Value | Normal Range |
|---|---|---|
| Heart Rate | 60 bpm | 60-100 bpm |
| PR interval | 156 ms | 120-200 ms |
| QRS duration | 106 ms | 80-100 ms |
| QT/QTc | 418/418 ms | <450 ms (F) / <440 ms (M) |
| P/QRS/T axis | 37° / -10° / -21° | -- |
| RV5/SV1 | 0.545/0.344 mV | -- |
| RV5+SV1 | 0.889 mV | <3.5 mV (borderline) |
ECG Interpretation (Machine + Visual Analysis)
1. Sinus Rhythm at 60 bpm
- Normal rate, regular rhythm. P waves present and preceding each QRS.
2. QRS Axis: -10° (Left Axis Deviation, borderline)
- Mild left axis deviation. Can be seen with left anterior fascicular block, LVH, or inferior wall scar.
3. Possible Anterior Infarct - Age Undetermined
- The precordial leads (V1-V3/V4) likely show poor R-wave progression (PRWP) - R waves fail to grow appropriately across the chest leads. This is the hallmark of an old/prior anterior MI (especially LAD territory). Without ST elevation, this is more consistent with an old anterior wall MI rather than an acute event.
- The phrase "age undetermined" means the machine cannot tell if this infarction is old (weeks/months/years) or recent.
4. Inferior/Lateral ST-T Abnormality (Nonspecific)
- Marked as nonspecific (~), meaning ST or T-wave changes in inferior (II, III, aVF) and lateral (aVL, V5-V6) leads that do not meet strict STEMI criteria. Could represent:
- Ischemia
- LVH strain pattern
- Electrolyte imbalance
- Hypertensive changes
5. Low QRS Voltages in Precordial Leads
- RV5+SV1 = 0.889 mV (very low; Sokolow-Lyon criteria for LVH requires >3.5 mV)
- Low precordial voltage causes include:
- Prior anterior MI with scar (most likely here)
- Pericardial effusion
- Obesity / COPD / emphysema (poor R-wave for different reason)
- Dilated cardiomyopathy
- Hypothyroidism
6. Slightly Wide QRS (106 ms)
- Borderline prolonged but does not meet full LBBB/RBBB criteria. May reflect incomplete bundle branch block or delayed conduction from myocardial scar.
Clinical Correlation with Patient Presentation
Possible Diagnoses (Differential)
| Priority | Diagnosis | Rationale |
|---|---|---|
| 1st | Benign Paroxysmal Positional Vertigo (BPPV) | Most common cause of acute vertigo + vomiting; ECG abnormalities would be incidental |
| 2nd | Vertebrobasilar TIA / Posterior Circulation Ischemia | Vertigo + vomiting + hypertension in a diabetic patient with prior cardiac history = must rule out |
| 3rd | Labyrinthitis / Vestibular Neuritis | Acute onset, viral, less concerning but diagnosis of exclusion |
| 4th | Old Anterior MI with Systolic Dysfunction (HFrEF) | Low voltage + prior infarct pattern on ECG could cause dizziness if EF is reduced |
| 5th | Hypertensive Vertigo | BP 150/90 can occasionally cause vertiginous symptoms; also raises stroke risk |
| 6th | Drug-related (Antihypertensive side effect) | Empagliflozin/Losartan can cause postural hypotension leading to dizziness |
The ECG pattern (possible old anterior MI + low voltage + ST-T changes) in a known diabetic with hypertension presenting with vertigo and vomiting makes posterior circulation stroke/TIA a high-priority diagnosis to exclude - these patients can have "silent" prior MI and present atypically.
Recommended Investigations
Urgent / Emergency
- MRI Brain with DWI (diffusion-weighted) - gold standard for posterior fossa stroke/TIA
- CT Brain - if MRI not immediately available
- Troponin I/T (serial) - rule out NSTEMI (vertigo can be an atypical MI presentation in diabetics)
- 12-lead ECG repeat + comparison with any prior ECG
- Blood glucose (hypoglycemia can mimic vertigo)
- Electrolytes (Na, K, Mg) - especially relevant with SGLT2i use
- Renal function (Cr, BUN, eGFR)
Non-urgent but Important
- 2D Echocardiogram - assess LV function, wall motion abnormalities (prior anterior MI?), pericardial effusion (to explain low voltage)
- Holter monitor - if paroxysmal arrhythmia suspected as cause of dizziness
- Lipid profile, HbA1c
- Thyroid function (TSH) - hypothyroidism can cause low voltage ECG
Risk Factors Summary
| Risk Factor | Evidence |
|---|---|
| Diabetes Mellitus | On Glimepiride + Metformin + Empagliflozin |
| Hypertension | BP 150/90; on ARB/SGLT2i |
| Likely prior anterior MI | ECG pattern (poor R-wave progression, possible old infarct) |
| Atherosclerosis | Combination of DM + HTN = high cardiovascular risk |
| Age (undetermined from ECG) | Consistent with middle-to-older adult profile |
Suggested Treatment Plan
Immediate (Emergency Department)
- Stabilize and monitor - continuous cardiac monitoring, pulse oximetry, IV access
- Anti-vertigo therapy:
- Tab. Betahistine 16 mg TID (for BPPV/vestibular cause)
- IV/IM Promethazine 25 mg or Ondansetron 4 mg IV for vomiting
- Avoid Diazepam if posterior stroke is suspected (masks cerebellar signs)
- BP management:
- If posterior stroke confirmed: permissive hypertension (keep SBP <180 unless hemorrhagic)
- If no stroke: optimise existing antihypertensives (continue Losartan/Empagliflozin)
- Do NOT aggressively drop BP acutely if perfusion is at risk
Cardiac-Specific
- If troponin elevated (NSTEMI):
- Dual antiplatelet (Aspirin 300 mg loading + Clopidogrel 75 mg)
- Anticoagulation (LMWH/fondaparinux)
- Cardiology consultation for early invasive strategy
- If old MI confirmed on Echo (reduced EF):
- Ensure on ACE-I/ARB (already on Losartan - continue)
- Add beta-blocker (Carvedilol or Metoprolol) if not already prescribed
- Statin therapy (if not already on one - high-intensity, e.g. Atorvastatin 40-80 mg)
- Empagliflozin already provides cardiac benefit in diabetics with HFrEF
Neurology
- If posterior circulation TIA/stroke confirmed:
- Aspirin 300 mg loading, then 75 mg OD
- Statin
- Strict BP control (long-term target <130/80 in diabetic + cerebrovascular disease)
- Neurology/Stroke team referral
Diabetes Management
- Continue Glimepiride + Metformin + Empagliflozin (already appropriate for a diabetic with cardiovascular risk; Empagliflozin has proven cardioprotective benefit)
- Check glucose - avoid hypoglycemia (can precipitate dizziness and arrhythmias)
Long-term
- Lifestyle: Low-sodium diet, weight management, regular moderate exercise
- Target BP: <130/80 mmHg (diabetic with cardiac disease)
- HbA1c target: <7% ideally
- Repeat ECG in 1-2 weeks and cardiologist follow-up for formal ECG interpretation with age/gender data
Reference ECG of Similar Pattern
Key Bottom Line
This patient is a known diabetic with hypertension presenting with vertigo and vomiting. The ECG shows a possible old anterior MI (poor R-wave progression, low precordial voltage, nonspecific ST-T changes) in sinus rhythm at 60 bpm. The ECG alone does not indicate an acute STEMI, but posterior circulation stroke/TIA must be urgently excluded via MRI brain DWI. Serial troponins are essential to rule out NSTEMI. A 2D echocardiogram is needed to assess LV function and explain the low voltage pattern.