Explain ECG to me
Reading File
Finding Sources
Searching the Web
ECG electrocardiogram basics explanation waves intervals
Reading File
Finding Sources
Reading File
Reading File
Reading File
Loading Image
Loading Image
Reading File
Here is a thorough explanation of the ECG, drawing from Guyton & Hall Textbook of Medical Physiology, Miller's Anesthesia, Ganong's Review of Medical Physiology, and Harrison's Principles of Internal Medicine.
Electrocardiogram (ECG)
What Is an ECG?
An ECG records the electrical activity of the heart at the body surface. The heart generates electrical potentials with each beat, and these potentials spread through body fluids to the skin, where electrodes pick them up. The result is a tracing of voltage over time that reflects the sequence of cardiac depolarization and repolarization.
An upward deflection is recorded when the active electrode becomes positive relative to the reference; a downward deflection when it becomes negative.
The Cardiac Conduction System (What Generates the ECG)
The electrical impulse follows a specific path:
- SA node (sinoatrial node) - the natural pacemaker, in the right atrium, fires spontaneously
- The impulse spreads across both atria - produces the P wave
- It reaches the AV node (atrioventricular node) - conduction slows here deliberately, creating a pause that allows atrial contraction to fill the ventricles before they contract
- The impulse travels down the Bundle of His, splits into left and right bundle branches
- It reaches the Purkinje fibers, spreading to all ventricular muscle cells - produces the QRS complex
- Ventricular muscle then repolarizes - produces the T wave
The Normal ECG Waveform
Here is the classic ECG trace from Guyton & Hall:
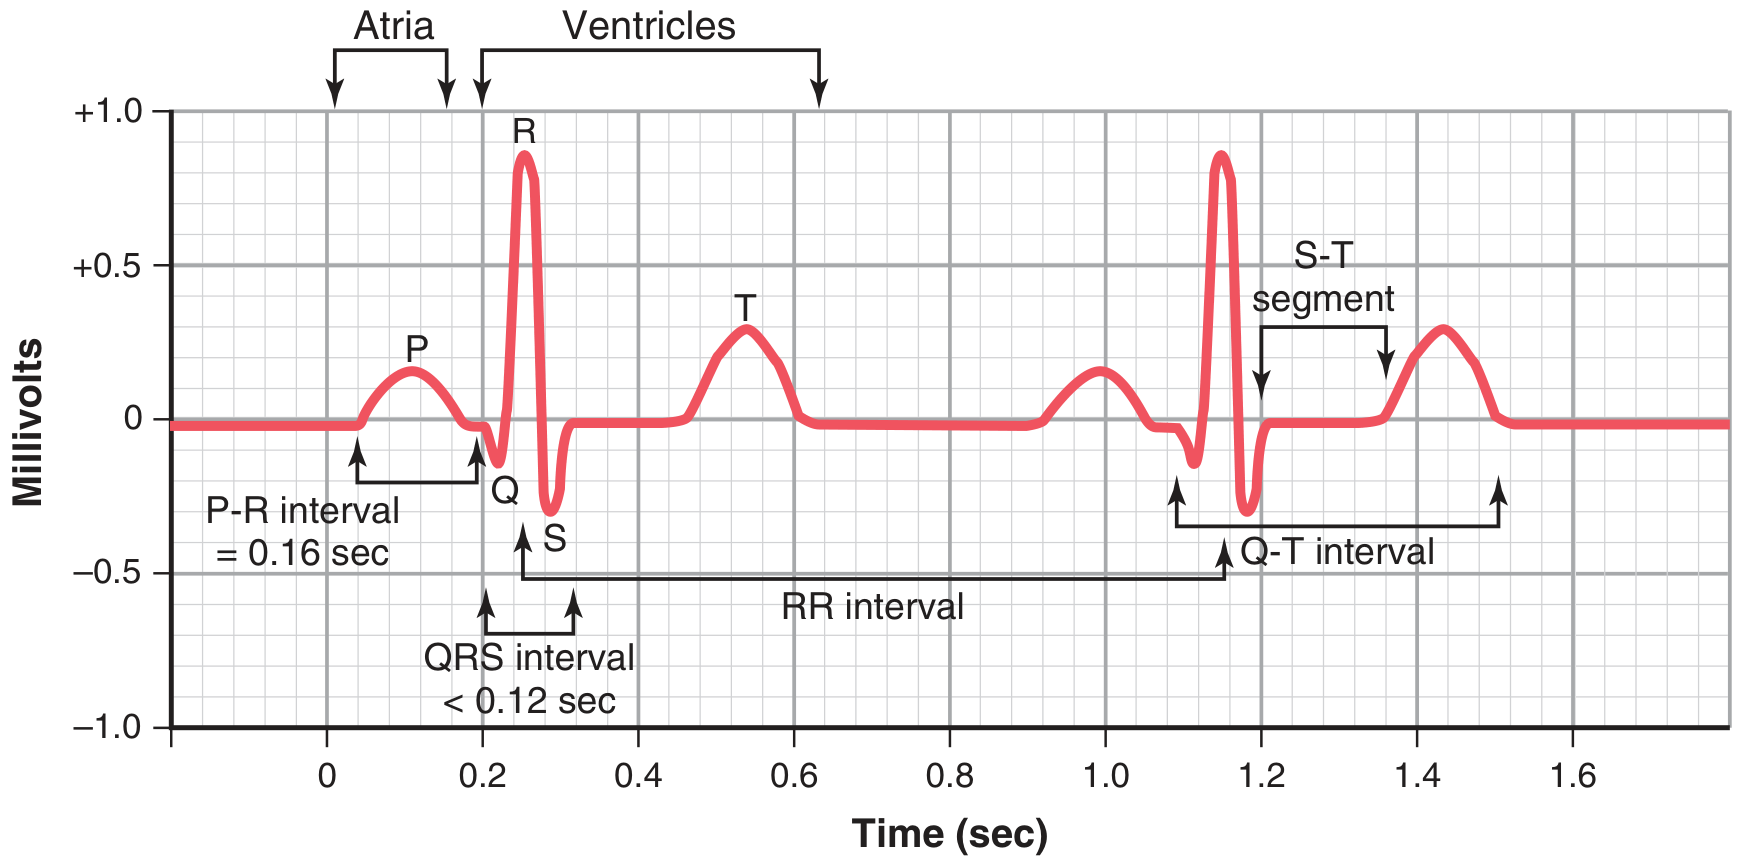
The Waves
| Wave | What it represents | Normal appearance |
|---|---|---|
| P wave | Atrial depolarization (atria contract) | Small, rounded, upright; 0.1-0.3 mV; duration ~0.08-0.10 s |
| Q wave | Initial ventricular septal depolarization (small downward deflection) | Small or absent normally; pathological if wide/deep |
| R wave | Main ventricular depolarization sweeping outward | Tall upward spike; the dominant feature |
| S wave | Terminal ventricular depolarization at the base | Small downward deflection after R |
| T wave | Ventricular repolarization | Broader, lower than QRS; same direction as QRS normally |
| U wave | Possibly late Purkinje repolarization | Small, inconstant; follows T wave |
Note: The atrial T wave (atrial repolarization) is not visible - it is buried within the QRS complex.
The Intervals and Segments
| Interval | Measured from... to... | Normal duration | What it represents |
|---|---|---|---|
| PR interval | Start of P wave to start of QRS | 0.12-0.20 s | AV node conduction delay |
| QRS duration | Start to end of QRS | < 0.10 s (up to 0.12) | Ventricular depolarization time |
| ST segment | End of QRS (J point) to start of T wave | Isoelectric (flat) | Ventricular plateau phase - no net current flow |
| QT interval | Start of QRS to end of T wave | < 0.43 s | Full ventricular action potential duration |
| RR interval | R wave to next R wave | Depends on heart rate | Duration of one cardiac cycle |
(Ganong's Review of Medical Physiology, Table 29-2)
ECG and the Cardiac Cycle
This diagram from Miller's Anesthesia shows how the ECG correlates with mechanical events of the heart:
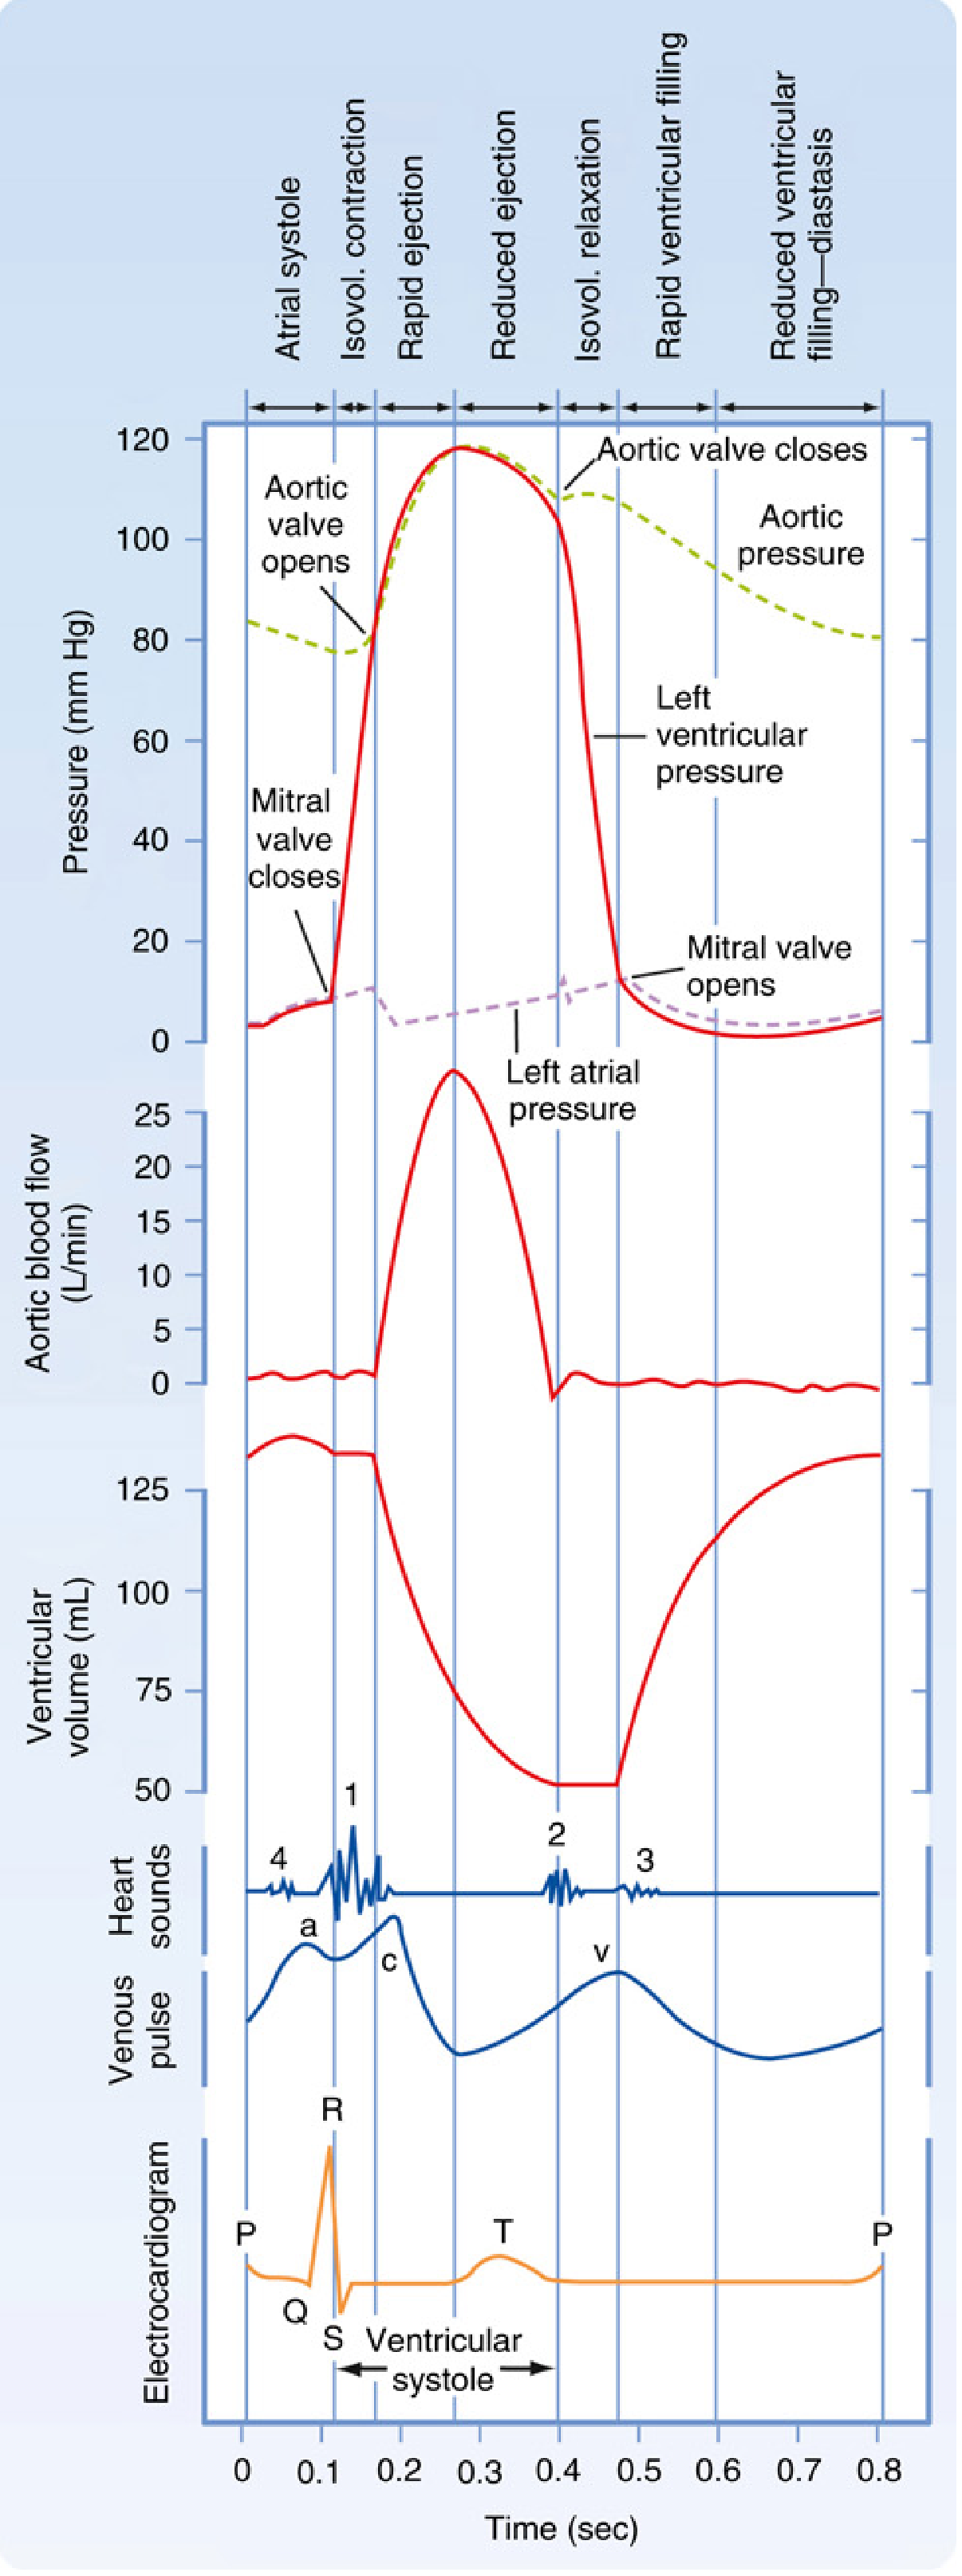
Key relationships:
- P wave coincides with atrial contraction (atrial systole)
- QRS coincides with the start of ventricular contraction; the mitral valve closes near the R wave peak
- Ventricular systole spans from QRS to end of T wave
- T wave ends as the ventricles relax (diastole begins)
The 12-Lead ECG
A standard ECG uses 10 electrodes placed on the body, generating 12 views (leads) of the heart from different angles. Each lead "looks" at the heart from a different direction.
Limb Leads (frontal plane)
These are based on Einthoven's triangle - the two arms and left leg form a triangle around the heart:
- Lead I - Right arm (-) to Left arm (+): looks leftward
- Lead II - Right arm (-) to Left leg (+): looks inferiorly
- Lead III - Left arm (-) to Left leg (+): looks inferiorly-left
- aVR - augmented view from right arm
- aVL - augmented view from left arm
- aVF - augmented view from left foot
Precordial (Chest) Leads (horizontal plane)
Six electrodes across the chest wall - V1 through V6 - look at the heart horizontally.
- V1, V2: right side of heart / interventricular septum
- V3, V4: anterior wall
- V5, V6: lateral wall
How to Read an ECG Systematically
Harrison's Principles of Internal Medicine (2025) recommends analyzing 14 parameters in every ECG:
- Standardization/calibration - 1 mV = 10 mm, paper speed = 25 mm/s
- Rhythm - regular or irregular?
- Heart rate - calculate from RR interval (300 / number of large squares between R waves)
- PR interval - AV conduction normal/prolonged/short?
- QRS interval - narrow (<120 ms) or wide (>120 ms)?
- QT/QTc interval - prolonged QT = arrhythmia risk
- Mean QRS electrical axis - normal, left deviation, or right deviation?
- P waves - present? one before every QRS?
- QRS voltages - high (LVH) or low (effusion, obesity, emphysema)?
- R-wave progression - does R wave grow from V1 to V5-V6?
- Abnormal Q waves - sign of previous MI
- ST segments - elevated (STEMI, pericarditis) or depressed (ischemia)?
- T waves - inverted (ischemia, strain) or peaked (hyperkalemia)?
- U waves - prominent U wave seen in hypokalemia
Common Clinical Findings
| Finding | What it suggests |
|---|---|
| Prolonged PR > 0.20 s | First-degree AV block |
| Wide QRS > 0.12 s | Bundle branch block |
| Peaked tall P waves | Right atrial enlargement |
| ST elevation | STEMI (heart attack), pericarditis |
| ST depression | Myocardial ischemia, digoxin effect |
| Prolonged QTc | Risk of torsades de pointes (dangerous arrhythmia) |
| No P waves + irregular rhythm | Atrial fibrillation |
| Absent P + regular wide QRS | Ventricular rhythm |
| Peaked T waves | Hyperkalemia |
| Flat/inverted T waves | Ischemia, hypokalemia |
| Pathological Q waves | Old myocardial infarction |
Key Numbers to Remember
| Parameter | Normal value |
|---|---|
| Heart rate | 60-100 bpm |
| PR interval | 0.12-0.20 s |
| QRS duration | < 0.10 s (up to 0.12 s) |
| QTc | Men < 0.44 s, Women < 0.46 s |
| P wave amplitude | 0.1-0.3 mV |
| ECG paper speed | 25 mm/s (1 small square = 0.04 s) |
| ECG paper amplitude | 1 mV = 10 mm (2 large squares) |
Sources: Guyton and Hall Textbook of Medical Physiology; Ganong's Review of Medical Physiology, 26th ed.; Miller's Anesthesia, 10th ed.; Harrison's Principles of Internal Medicine, 22nd ed. (2025)
This is a shared conversation. Sign in to Orris to start your own chat.