
Give me info about eyeball external
external anatomy of the eyeball diagram
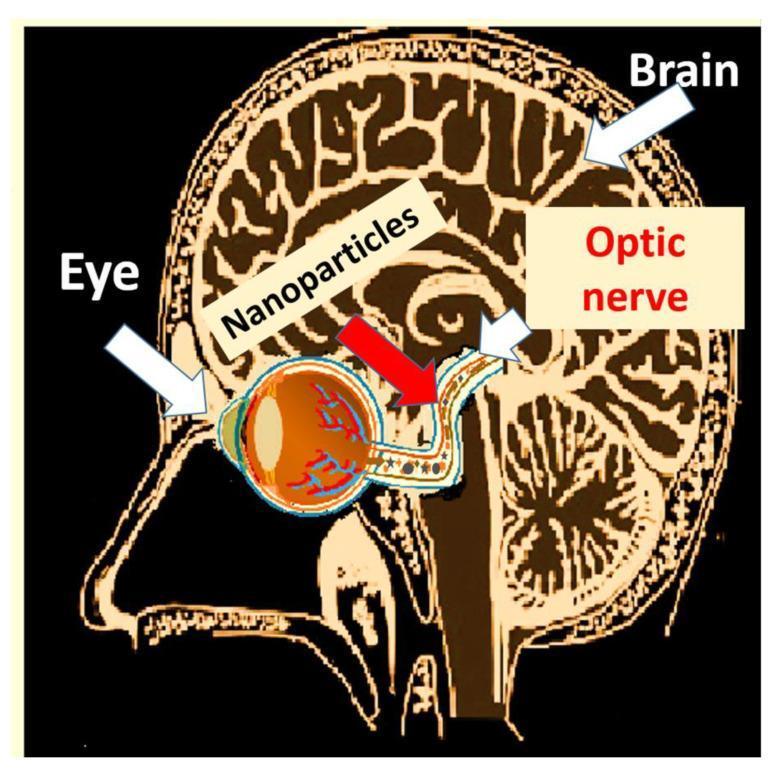
This medical illustration depicts a sagittal view of the human head and brain, functioning as a pathophysiology diagram to demonstrate the translocation of nanoparticles. The diagram highlights a specific anatomical pathway starting from the eye, where external particles enter the ocular surface and tear ducts. The nanoparticles (represented by small circular icons) are shown moving posteriorly through the eyeball and into the optic nerve. A prominent red arrow indicates the directional flow from the posterior segment of the eye along the optic nerve towards the central nervous system. The final destination is labeled as the brain, illustrating the potential for systemic exposure and neuroinflammation via eye-to-brain pathways. The diagram serves an educational purpose for environmental toxicology and pharmacology by emphasizing how nanoparticles can bypass blood-brain barriers through cranial nerve routes. Key anatomical structures labeled include the eye, optic nerve, and brain, set against a high-contrast cross-sectional background of cranial anatomy.
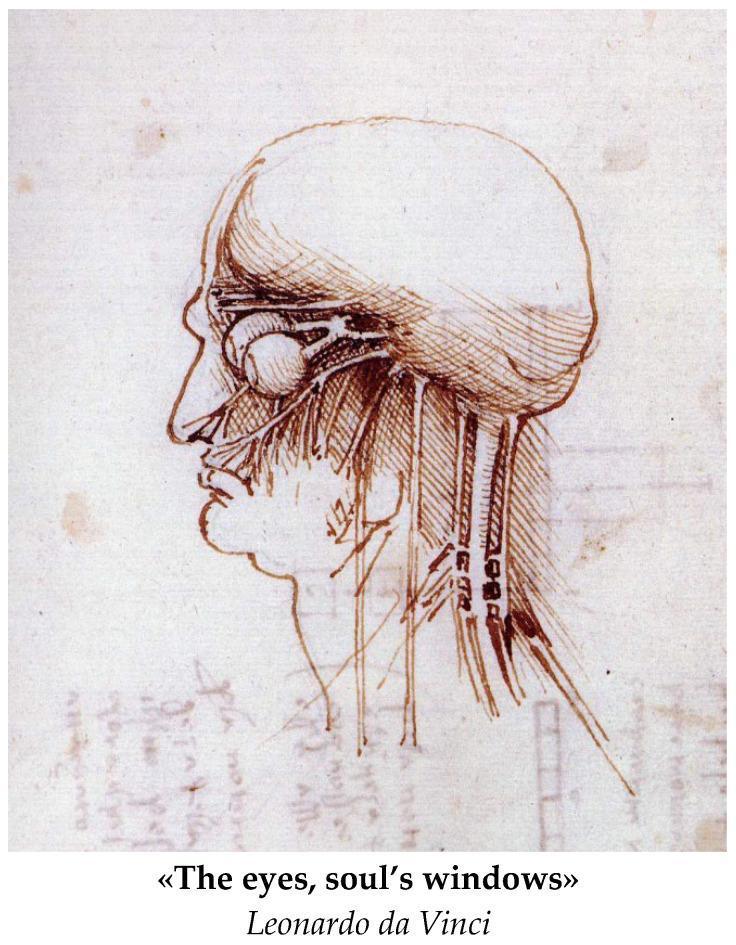
Anatomical Diagram: A historical medical illustration by Leonardo da Vinci, depicting a right lateral profile of the human head and neck. The drawing serves as an early study of gross anatomy and neuroanatomy. It features a detailed representation of the orbit, showing the eyeball as a spherical structure with attached extraocular muscles or neural pathways extending posteriorly toward the brain. The cranium is outlined, with fine hatching and cross-hatching used to provide topographical depth to the skull and facial features. The nasal cavity and oral region are visible in profile. Extending inferiorly from the base of the skull through the neck are several vertical, parallel structures representing major vessels (carotid arteries/jugular veins) and possibly nerves or muscular bundles. The illustration highlights the early Renaissance focus on understanding the relationship between surface anatomy and underlying physiological structures, particularly the visual system's connection to the central nervous system.
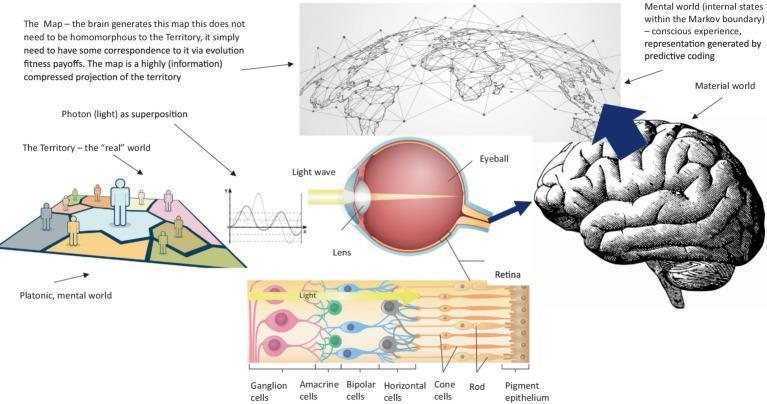
This pathophysiology diagram illustrates the biological and cognitive processes of visual perception and predictive coding. The illustration follows the flow of information starting from the 'Territory' (external reality), represented as light waves/photons in superposition. These waves enter the anatomical eyeball, passing through the lens to strike the retina. A detailed cross-section of the retina depicts the cellular layers involved in signal transduction, including the pigment epithelium, photoreceptors (rods and cones), horizontal cells, bipolar cells, amacrine cells, and ganglion cells. The resulting neural signals are transmitted via the optic nerve to the brain. The brain is shown generating a 'Mental World' or 'Map', described as internal states within a Markov boundary. This representation is generated by predictive coding to create conscious experience. The diagram highlights that the internal map is a highly compressed information projection and not necessarily homomorphous to the underlying external reality, emphasizing evolutionary fitness payoffs in sensory processing. This material is relevant to neurobiology, ophthalmology, and cognitive science.
This anatomical diagram illustrates the external surface anatomy of the human outer ear (auricle or pinna). The illustration uses shading and labels to identify key cartilaginous structures and landmarks. The outermost curved rim is labeled as the helix, which borders a shallow groove known as the scapha. Internal and parallel to the helix is the antihelix, a Y-shaped ridge that splits superiorly to enclose the triangular fossa. The deep, central bowl-like cavity leading toward the external auditory canal is identified as the concha. Anteriorly, a small cartilaginous projection called the tragus is shown, situated across from the antitragus. These two projections are separated by the intertragal notch. The most inferior portion of the ear is labeled as the lobe (lobule), which is the fleshy part devoid of cartilage. This diagram serves as an educational resource for medical students and clinicians to understand the surface morphology of the ear, essential for clinical examination and dermatological localization.
eyeball layers sclera cornea choroid retina cross section
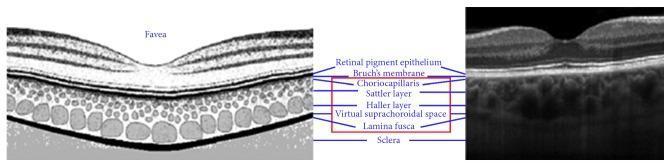
A comparison graphic of human ocular anatomy featuring an anatomical diagram alongside a high-resolution Spectral Domain Optical Coherence Tomography (SD-OCT) cross-section of the fovea and posterior segment. The image serves as an educational tool for ophthalmology, specifically identifying the microstructural layers of the retina and choroid. Starting from the inner retina and moving outward toward the sclera, the labeled structures include the foveal pit, retinal pigment epithelium (RPE), Bruch's membrane, and the subsequent choroidal layers: choriocapillaris, Sattler layer (small-to-medium vessels), Haller layer (large vessels), virtual suprachoroidal space, and Lamina fusca. The OCT image illustrates these as hyperreflective and hyporeflective bands, with the RPE appearing as a prominent bright band. This visual highlights the clinical methodology for measuring choroidal thickness, defined as the distance between the RPE-choroid interface and the sclerochoroidal interface. The image is designed for advanced medical education in diagnostic imaging and retinal pathology.
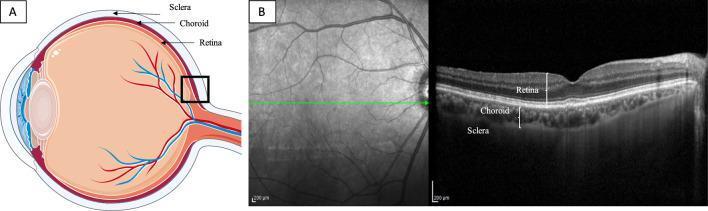
This composite educational graphic illustrates human ocular anatomy and diagnostic imaging. Section A presents a sagittal schematic diagram of the eye, highlighting the three posterior layers: the retina (inner), the choroid (middle vascular layer), and the sclera (outer fibrous layer). A black box indicates the posterior pole region being analyzed. Section B features a Spectral Domain Optical Coherence Tomography (SD-OCT) scan centered on the fovea. The left side of panel B shows a grayscale infrared fundus image with a green horizontal line indicating the scan acquisition path. The right side displays the corresponding cross-sectional OCT B-scan, which provides high-resolution visualization of the retinal architecture, the underlying choroidal layer with its characteristic vascular luminal and stromal spaces, and the interface with the sclera. Labels on the B-scan confirm the stratified arrangement of the retina, choroid, and sclera, making this a foundational resource for understanding posterior segment imaging and choroidal thickness assessment.
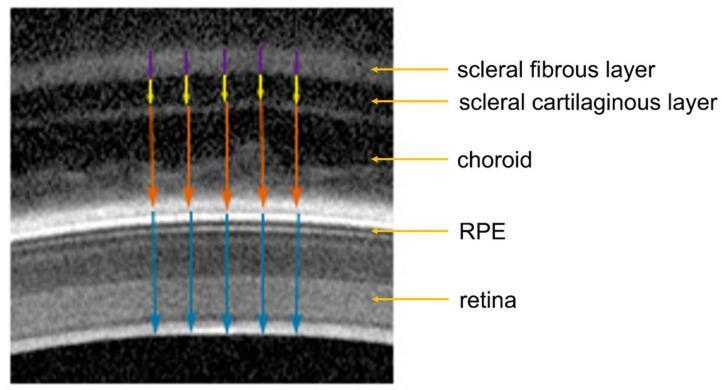
This diagnostic image is a B-scan Optical Coherence Tomography (OCT) cross-section of a fundus, specifically illustrating the anatomical stratification of the ocular posterior segment. The image demonstrates five distinct layers from inner to outer (bottom to top in this orientation): the retina, the retinal pigment epithelium (RPE), the choroid, the scleral cartilaginous layer, and the scleral fibrous layer. Annotated color-coded arrows indicate thickness measurements for each layer: blue for retina (from the inner limiting membrane to the RPE), orange for choroid (extending from the hyperreflective RPE to the sclera), yellow for the scleral cartilaginous layer, and purple for the outermost scleral fibrous layer. Visually, the retinal and choroidal layers exhibit higher signal intensity and structural detail, while the scleral layers appear as more homogenous, hyporeflective bands. This visual resource is intended for ophthalmology education to teach the diagnostic identification of fundal layers and the methodology for quantifying layer-specific biometric changes in ophthalmic research.
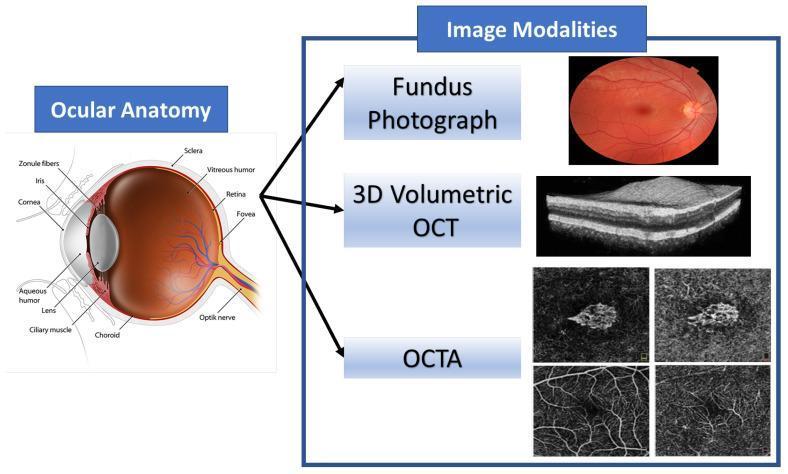
This educational graphic combines an anatomical diagram of the human eye with corresponding ophthalmic imaging modalities. The 'Ocular Anatomy' section features a detailed sagittal cross-section identifying key structures: the cornea, aqueous humor, iris, pupil, biconvex lens, zonule fibers, and ciliary muscle in the anterior segment; and the vitreous humor, retina, fovea, choroid, sclera, and optic nerve in the posterior segment. The 'Image Modalities' section illustrates diagnostic tools used to visualize these structures. A color Fundus Photograph provides a surface view of the retina, optic disc, and vasculature. A 3D Volumetric Optical Coherence Tomography (OCT) scan displays a high-resolution, grayscale cross-sectional view of retinal layers, highlighting tissue stratification. Finally, Optical Coherence Tomography Angiography (OCTA) panels show non-invasive, depth-resolved images of the retinal and choroidal microvasculature. This composite serves as a reference for correlating anatomical landmarks with clinical diagnostic imaging used in the management of retinal diseases such as Age-related Macular Degeneration (AMD).
External Anatomy of the Eyeball
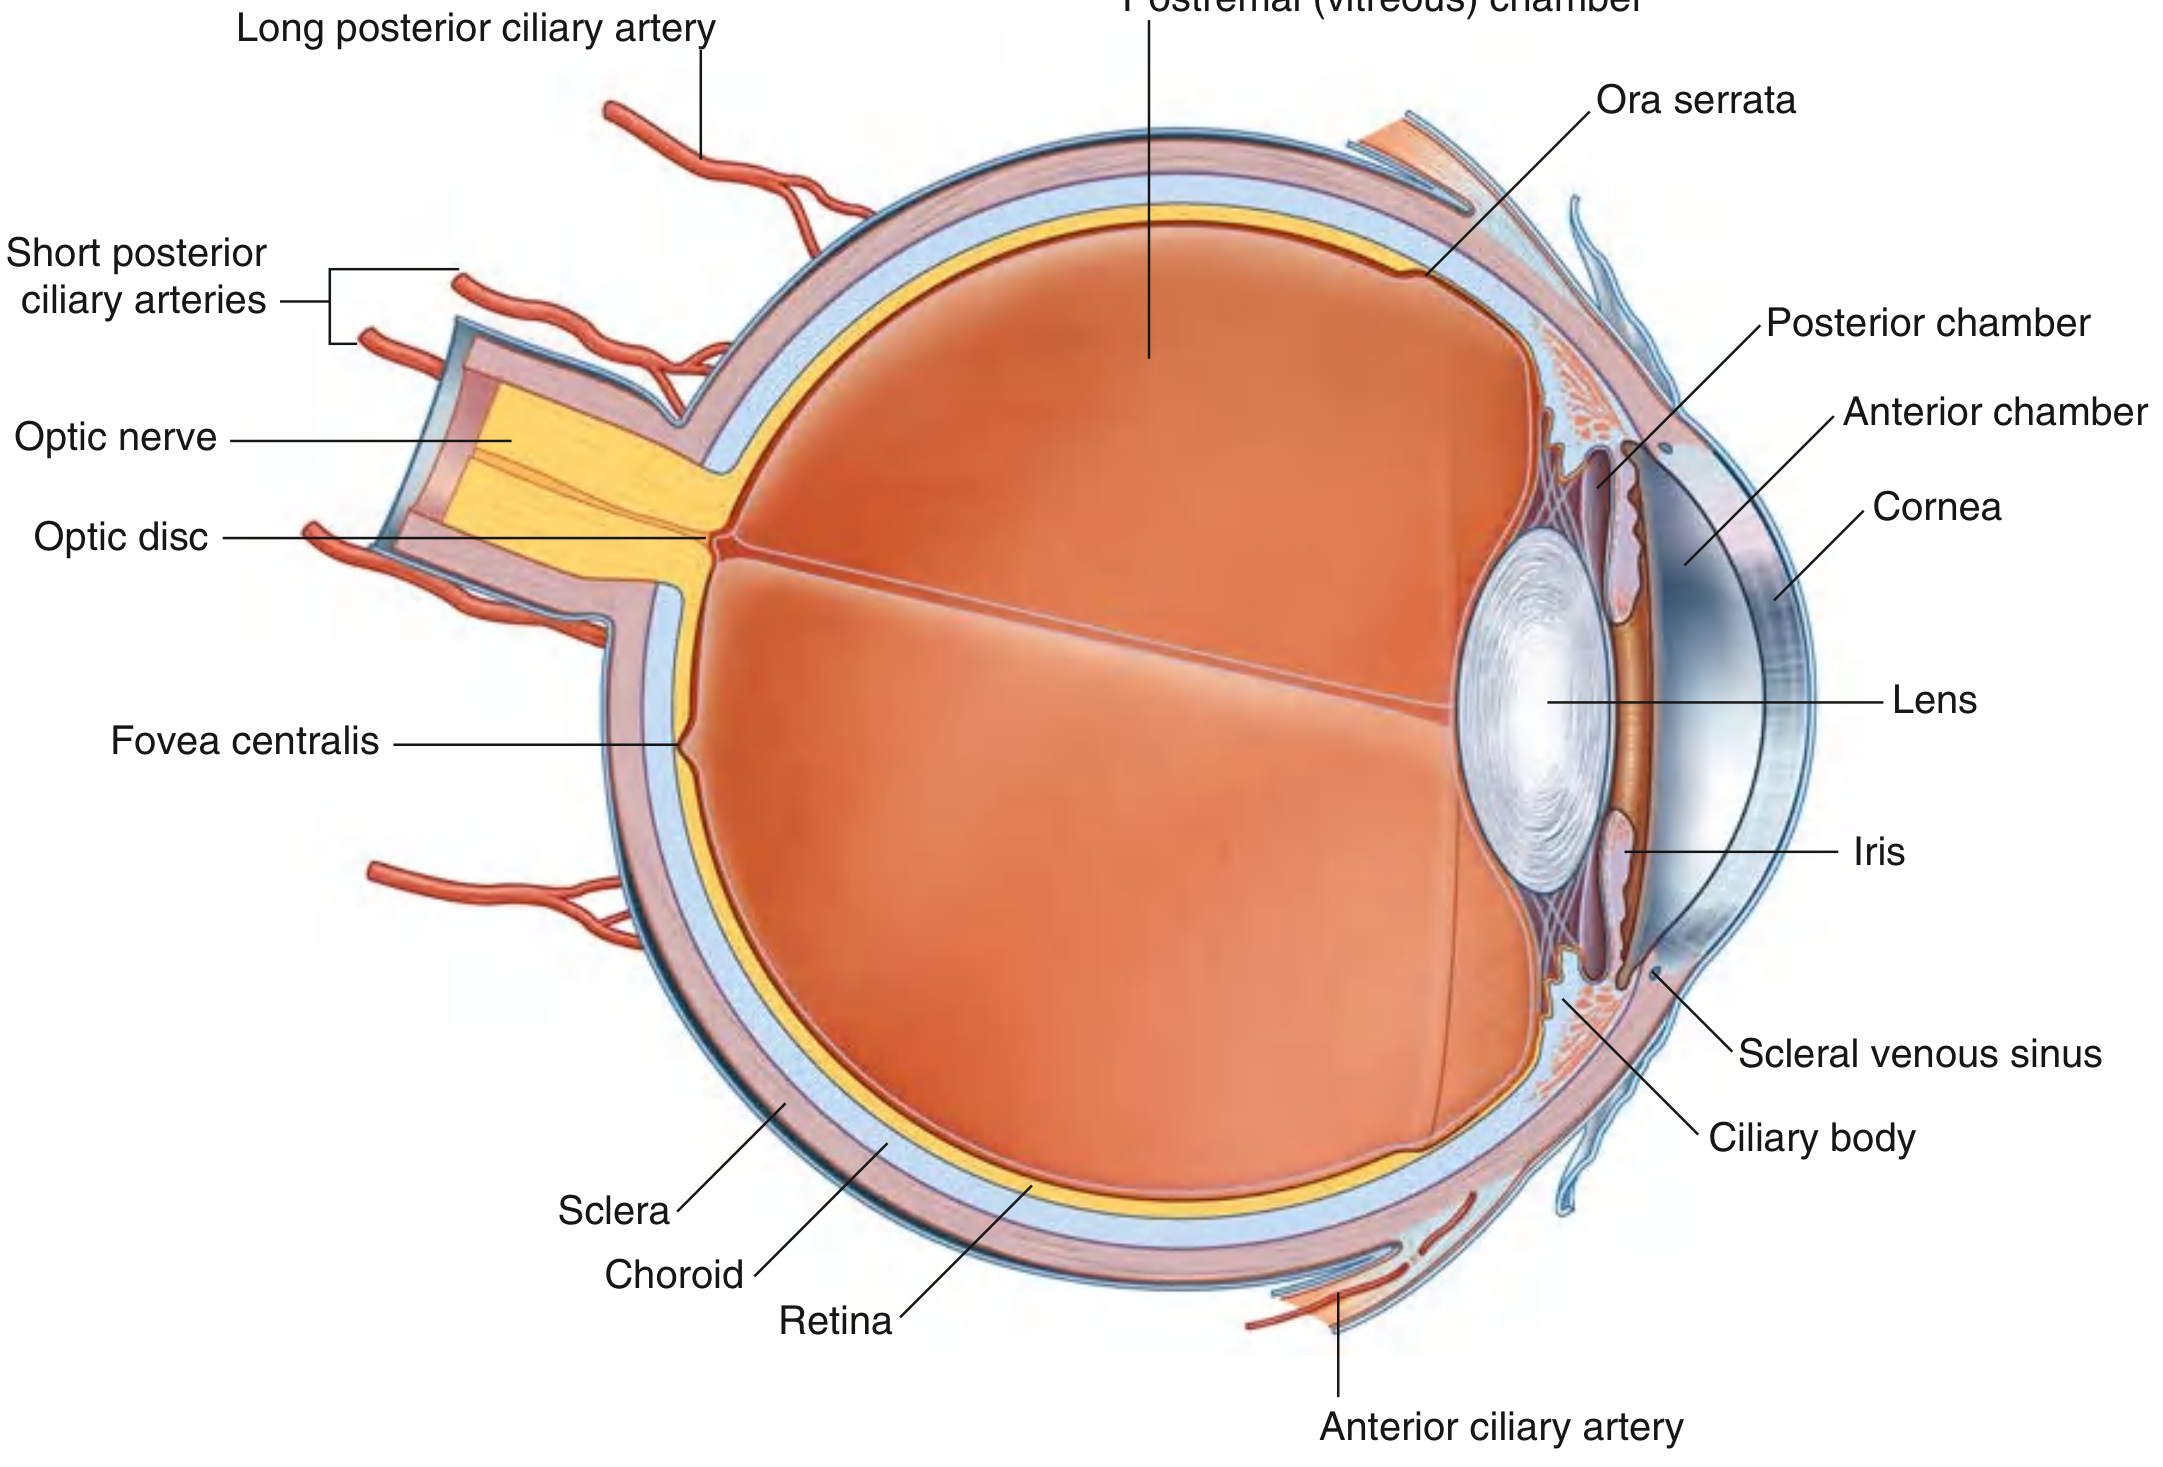
Overview
Three Layers (Tunics) of the Eyeball Wall
1. Outer Fibrous Layer (Tunica Fibrosa)
| Component | Coverage | Key Feature |
|---|---|---|
| Sclera | Posterior 5/6 | Opaque dense connective tissue; the "white of the eye" |
| Cornea | Anterior 1/6 | Transparent; allows light entry; continuous with sclera at the corneoscleral junction |
- The sclera is pierced by the optic nerve posteriorly and numerous vessels and nerves. It provides attachment for the extraocular muscles.
- The fascial sheath of the eyeball (Tenon's capsule) covers the external surface of the sclera from the optic nerve entrance to the corneoscleral junction.
- The internal surface of the sclera is loosely attached to the choroid.
2. Middle Vascular Layer (Tunica Vasculosa / Uveal Tract)
Choroid (posterior ~2/3)
- Thin, highly vascular, pigmented layer
- Smaller vessels lie adjacent to the retina; larger vessels more peripherally
- Firmly attached to retina internally; loosely attached to sclera externally
- Main function: nourishment of the outer retinal layers
Ciliary Body (middle)
- Triangular structure extending from the anterior border of the choroid
- Forms a complete ring around the eyeball
- Contains two key components:
- Ciliary muscle - smooth muscle with longitudinal, circular, and radial fibers; innervated by parasympathetics (CN III); contraction relaxes the suspensory ligament of the lens, making it rounder for near vision (accommodation)
- Ciliary processes - longitudinal ridges on the inner surface; give rise to zonular fibers (suspensory ligament of the lens); also secrete aqueous humor
Iris (anterior)
- The circular, colored part of the eye
- Has a central opening: the pupil
- Contains two smooth muscle layers:
- Sphincter pupillae - circularly arranged; parasympathetic (CN III); constricts pupil (miosis)
- Dilator pupillae - radially arranged; sympathetic (superior cervical ganglion, T1); dilates pupil (mydriasis)
- Junction with the cornea forms the iridocorneal angle, where the scleral venous sinus (canal of Schlemm) drains aqueous humor
3. Inner Retinal Layer (Tunica Interna)
- Consists of the optic retina (posteriorly - light sensitive) and the nonvisual retina (anteriorly - covers ciliary body and iris)
- The junction between these two parts is the ora serrata (irregular serrated line)
- The optic retina has two sub-layers:
- Pigmented layer - firmly attached to the choroid
- Neural layer - only attached at the optic nerve and ora serrata (the layer that separates in retinal detachment)
- Key landmarks on the posterior retina: optic disc (where optic nerve exits; blind spot), fovea centralis (point of sharpest vision)
Internal Chambers
| Chamber | Location | Contents |
|---|---|---|
| Anterior chamber | Behind cornea, in front of iris | Aqueous humor |
| Posterior chamber | Behind iris, in front of lens | Aqueous humor |
| Postremal (vitreous) chamber | Behind lens, in front of retina | Vitreous body (gelatinous; cannot be replaced) |
Blood Supply
- Short posterior ciliary arteries - pierce sclera around optic nerve; enter choroid
- Long posterior ciliary arteries (usually 2) - enter sclera medially and laterally; travel anteriorly in choroid to anastomose with anterior ciliary arteries
- Anterior ciliary arteries - branches of muscular arteries; pierce sclera near muscle insertions
- Central retinal artery - travels within the optic nerve; enters retina at the optic disc
Venous Drainage
- Vorticose veins (4 large veins, one per posterior quadrant) - drain the choroid; drain into superior and inferior ophthalmic veins
- Central retinal vein - accompanies the central retinal artery
Intrinsic Muscles Summary
| Muscle | Location | Innervation | Function |
|---|---|---|---|
| Ciliary | Ciliary body | Parasympathetic (CN III) | Relaxes lens tension → rounder lens (near vision) |
| Sphincter pupillae | Iris (circular) | Parasympathetic (CN III) | Constricts pupil |
| Dilator pupillae | Iris (radial) | Sympathetic (T1) | Dilates pupil |
Clinical Correlates
- Glaucoma - Blockage of aqueous humor drainage at the canal of Schlemm raises intraocular pressure, compressing the retina and its blood supply; can lead to blindness
- Cataract - Opacity of the lens (often age-related); treated by excision and artificial lens implantation
- Retinal detachment - Separation of the neural layer from the pigmented layer; occurs between the two retinal sub-layers (not at the choroid-retina interface)
- Ophthalmoscopy - Direct visualization through the pupil allows examination of the optic disc, central retinal vessels, and fovea; used to detect optic nerve disease, vascular abnormalities, and retinal changes