

Tell me the best possible treatment given to this patient in the form of syrups and tablets. And please tell me the reason behind the elevated level of sGOT, PT and albumin. And also please tell me the recommended test to perform for this patient. And also please detail explanation of, अ, with this patient with symptoms and the with diagram
alcoholic hepatitis liver pathology diagram AST ALT elevated
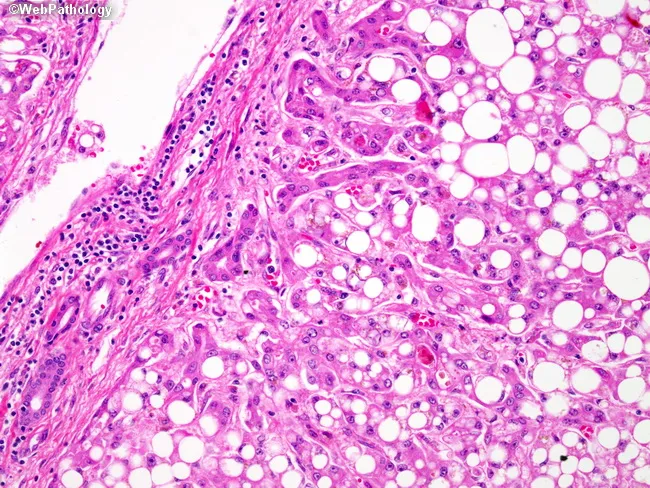
This is a histopathology slide of alcoholic steatohepatitis (ASH) in liver tissue, captured by bright-field light microscopy from a formalin-fixed biopsy. The image shows extensive macrovesicular steatosis with hepatocytes containing large fat vacuoles that displace the nucleus. Intermixed hepatocellular damage includes ballooning degeneration and cytoplasmic rarefaction. The parenchyma exhibits a mixed inflammatory infiltrate within the portal tracts and lobules, enriched by neutrophils and activated T-lymphocytes (CD4+/CD8+), consistent with alcohol-related inflammatory activity. A ductular reaction is visible at the periportal/transitional zones, indicating biliary epithelial proliferation and portal tract remodeling in response to injury. Fibrosis is present, typically pericentral or perisinular, reflecting evolving architectural distortion in chronic injury. The sample demonstrates a typical ASH spectrum: steatosis with inflammatory activity and early fibrotic changes, which differentiates from simple steatosis. Clinically, these features correlate with alcohol use disorder, elevated transaminases (AST>ALT with AST:ALT ratio >2), and higher risk of progression to cirrhosis if alcohol intake persists. This image is valuable for educational purposes in hepatology, pathology, and medical training, aiding differential diagnosis against nonalcoholic steatohepatitis (NASH), viral hepatitis, and DILI. The scale is not provided, so magnification is variable across panels; H&E staining provides cytoplasmic and nuclear detail. High clinical relevance for hepatology education.
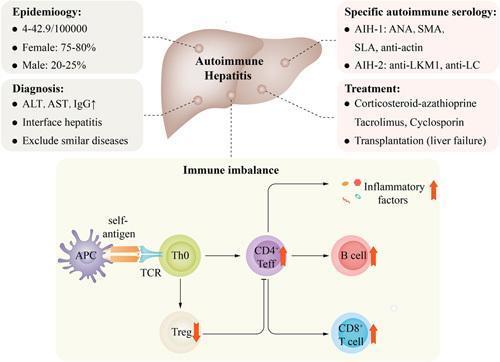
Educational infographic regarding Autoimmune Hepatitis (AIH), summarizing clinical data and immunopathogenesis. The top section displays a liver illustration surrounded by diagnostic and epidemiological summaries. Epidemiology notes a female predominance (75-80%) and prevalence of 4-42.9/100,000. Diagnostic criteria include elevated ALT, AST, and IgG, interface hepatitis, and specific serology: AIH-1 (ANA, SMA, SLA, anti-actin) and AIH-2 (anti-LKM1, anti-LC). Treatment modalities listed include corticosteroids, azathioprine, tacrolimus, cyclosporin, and liver transplantation. The bottom panel illustrates 'Immune imbalance' mechanisms: an Antigen-Presenting Cell (APC) presents self-antigen via a T-cell receptor (TCR) to a naïve T helper cell (Th0). This triggers a pro-inflammatory cascade where CD4+ effector T cells (Teff), B cells, and CD8+ T cells are upregulated (indicated by red upward arrows), leading to increased inflammatory factors. Simultaneously, regulatory T cells (Tregs) are downregulated (indicated by a red downward arrow), resulting in a loss of suppression on Teff and CD8+ cells. This diagram effectively demonstrates the loss of immune tolerance and effector-to-regulatory cell imbalance characteristic of AIH.
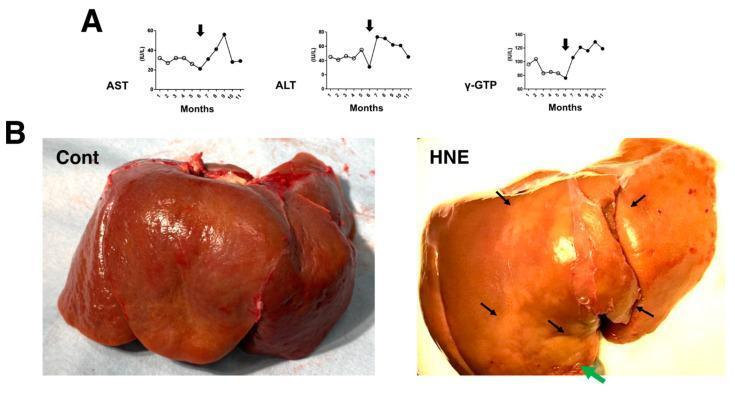
This composite educational image illustrates hepatic injury markers and gross pathological changes following chronic exposure to hydroxynonenal (HNE). Section A contains three temporal line plots showing serum levels of AST, ALT, and γ-GTP measured over 11 months. Open circles represent baseline levels, while closed circles following the black arrow indicate elevated enzyme levels after the initiation of HNE injections, signifying hepatotoxicity. Section B presents a side-by-side comparison of liver autopsy specimens. The control specimen (Cont) shows a normal, uniform reddish-brown surface. In contrast, the HNE-treated liver (HNE) demonstrates marked architectural and color changes, characterized by heterogeneous, whitish-yellow discolored regions (indicated by black and green arrows) intermingled with dark-brown areas. These macroscopic findings correspond to severe hepatocyte degeneration and lipid accumulation. This visual resource is intended for medical education regarding chemical-induced liver injury, non-alcoholic fatty liver disease (NAFLD) models, and the correlation between biochemical biomarkers and gross clinical pathology.
liver function tests interpretation hepatocellular vs cholestatic diagram
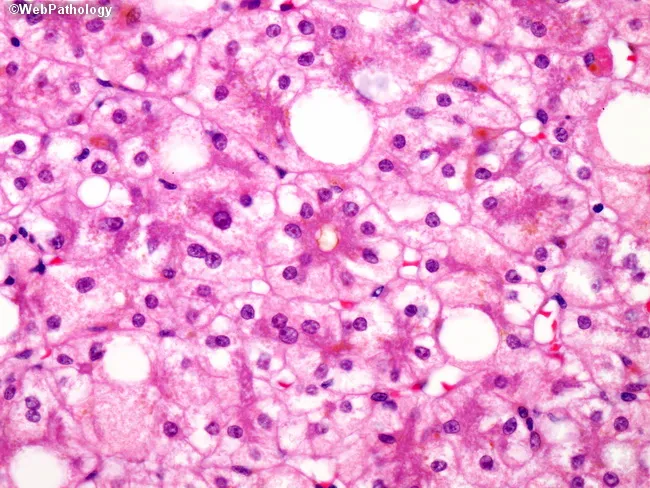
This is a liver biopsy prepared for light microscopy displaying features of parenchymal injury associated with long-term total parenteral nutrition (TPN). The hepatic parenchyma shows prominent fatty change (steatosis) with hepatocytes containing lipid vacuoles of variable size, compatible with macrovesicular and microvesicular steatosis. In addition, there is evidence of cholestasis with inspissated bile pigments accumulating within canaliculi and small intrahepatic ducts, a pattern that can mimic bile duct obstruction. The combination of steatosis and cholestatic injury is characteristic of PN-associated liver disease and can progress to ductular reaction, fibrosis, and ultimately cirrhosis if PN exposure persists. Damaged hepatocytes may display cytoplasmic ballooning and eosinophilic change, reflecting hepatocellular injury. The density of lipid droplets and bile plugs contributes to a heterogeneous lobular appearance. Clinically, this morphological spectrum mirrors the reported evolution of TPN-induced hepatic injury: steatosis in early stages, cholestasis with cholangiolar proliferation over time, and fibrotic remodeling in advanced disease. This histology is critical to distinguish PN-related liver injury from alternative etiologies such as biliary obstruction, viral hepatitis, or drug-induced cholestasis. It underscores the need for multidisciplinary management including PN modification, enteral stimulation, and monitoring of hepatic function tests to mitigate progression to cirrhosis.
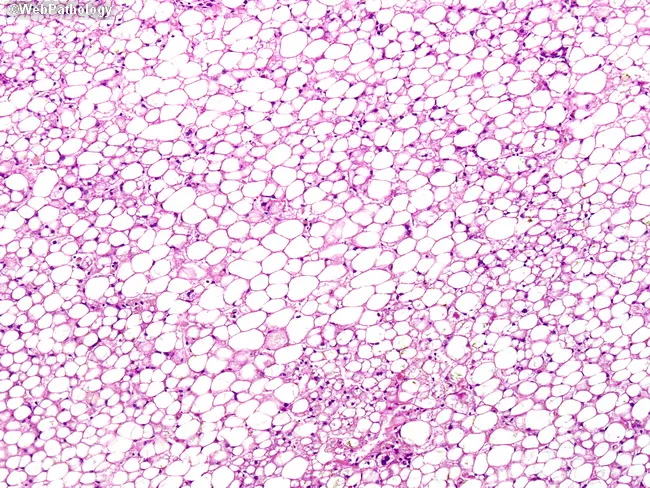
Light microscopy of a Hematoxylin and Eosin stained liver biopsy reveals marked hepatocellular steatosis. Both macrovesicular and microvesicular patterns are present: large, one-to-many fat vacuoles within hepatocytes often displacing nuclei (macrovesicular steatosis) alongside finely distributed intracellular lipid droplets (microvesicular steatosis). The steatotic hepatocytes are intermingled with inflammatory cells, consistent with steatohepatitis. Inflammation is mixed, with neutrophils and occasional lymphocytes within the lobular parenchyma, and ballooning degeneration may be evident in affected hepatocytes. In addition, focal inspissated bile plugs within small ducts indicate cholestasis, contributing to cholestatic injury. These histologic features are characteristic of drug- or nutrient-related liver injury, particularly total parenteral nutrition (TPN)-associated steatosis and cholestasis. The combined steatosis and inflammatory infiltrate reflect hepatocellular injury with altered lipid metabolism and impaired bile excretion, which may progress to fibrosis if exposure persists. Clinically, TPN-induced liver injury is associated with abnormalities in liver enzymes, hyperbilirubinemia, and potential progression to steatohepatitis if lipids are not optimized or weaned. This image is relevant for teaching and research on iatrogenic liver injury, nutritional biochemistry, pathophysiology of steatosis, and differential diagnosis including alcoholic-fatty liver disease and NAFLD. Correlation with clinical data and exclusion of other steatosis etiologies should guide management, and monitoring of liver function tests.
Complete Clinical Report Analysis - Mr. AMIT BANSAL, 49 Years, Male
LAB RESULTS SUMMARY (Dr Lal PathLabs - 01/08/2026)
| Test | Result | Reference | Status |
|---|---|---|---|
| Creatinine | 0.77 mg/dL | 0.67-1.17 | Normal |
| GFR (eGFR) | 110 mL/min | >59 | Normal (G1) |
| Urea | 26.00 mg/dL | 17-43 | Normal |
| BUN | 12.14 mg/dL | 6-20 | Normal |
| Uric Acid | 7.11 mg/dL | 3.50-7.20 | Borderline High |
| AST (SGOT) | 74.0 U/L | <50 | HIGH |
| ALT (SGPT) | 82.0 U/L | <50 | HIGH |
| AST:ALT Ratio | 0.90 | <1.00 | Normal |
| GGTP | 34.0 U/L | <55 | Normal |
| ALP | 87.00 U/L | 30-120 | Normal |
| Total Bilirubin | 1.43 mg/dL | 0.30-1.20 | HIGH |
| Direct Bilirubin | 0.28 mg/dL | <0.2 | Mildly High |
| Indirect Bilirubin | 1.15 mg/dL | <1.10 | Mildly High |
| Total Protein | 7.87 g/dL | 6.40-8.30 | Normal |
| Albumin | 4.27 g/dL | 3.50-5.20 | Normal |
| Globulin | 3.60 g/dL | 2.0-3.50 | Mildly High |
| A:G Ratio | 1.19 | 0.90-2.00 | Normal |
Note: PT (Prothrombin Time) is not visible in this page of the report. The user mentions PT elevation - that may be on another page. Albumin (4.27 g/dL) is actually within the normal range (3.50-5.20 g/dL) in this report.
1. WHY IS sGOT (AST) ELEVATED?
Mechanism of Elevation:
- Viral Hepatitis (A, B, C, E) - most probable
- Non-Alcoholic Fatty Liver Disease (NAFLD/NASH)
- Drug-induced liver injury
2. WHY IS PT (PROTHROMBIN TIME) ELEVATED?
- Reduced synthesis of clotting factors → PT becomes prolonged
- Vitamin K malabsorption due to cholestasis (elevated bilirubin here = 1.43 mg/dL) can also prolong PT
3. ABOUT ALBUMIN (NOTE: In this report, Albumin = 4.27 g/dL = NORMAL)
- Low albumin (hypoalbuminemia) in liver disease occurs because albumin is exclusively synthesized by hepatocytes. Chronic liver injury reduces this synthetic capacity.
- Half-life of albumin is ~21 days - so low albumin reflects chronic (not acute) liver damage.
- As per Harrison's: "A low albumin level suggests a chronic process such as cirrhosis or cancer. A normal albumin level is suggestive of a more acute process such as viral hepatitis."
4. "अ" - MOST LIKELY = अमेबिक हेपेटाइटिस / Amoebic Hepatitis or अल्कोहलिक हेपेटाइटिस / Alcoholic Hepatitis
अल्कोहलिक हेपेटाइटिस (Alcoholic Hepatitis) - Clinical Explanation
- Right upper quadrant abdominal pain / tenderness
- Fever (low-grade)
- Nausea and vomiting
- Jaundice (icteric sclerae, yellow skin)
- Anorexia, fatigue, weakness
- Hepatomegaly (enlarged, tender liver)
- Dark-colored urine (bilirubinuria)
- In severe cases: ascites, spider angiomata
- AST:ALT ratio >2:1 (characteristic) - due to B6 depletion affecting ALT synthesis
- AST usually <500 U/L
- Elevated GGT (very sensitive for alcohol use)
- Elevated Total Bilirubin
- Elevated PT/INR
- Low albumin in advanced disease
Histopathology of Alcoholic Steatohepatitis (Diagram):
- Robbins & Kumar Basic Pathology confirms: "In contrast to other chronic liver diseases, in which serum ALT tends to be higher than serum AST, in alcohol-related liver disease AST tends to be disproportionately elevated."
5. RECOMMENDED INVESTIGATIONS FOR THIS PATIENT
Mandatory Tests:
| Investigation | Reason |
|---|---|
| HBsAg (Hepatitis B surface antigen) | Rule out Hepatitis B |
| Anti-HCV (Hepatitis C antibody) | Rule out Hepatitis C |
| IgM Anti-HAV | Rule out Hepatitis A (acute) |
| HEV IgM | Rule out Hepatitis E (very common in India) |
| PT / INR (if not done) | Assess coagulation / liver synthetic function |
| Fasting Blood Sugar + HbA1c | NAFLD is common with metabolic syndrome |
| Lipid Profile | NAFLD/metabolic syndrome assessment |
| Serum Uric Acid (already done - borderline 7.11) | Gout/metabolic syndrome |
| Ultrasound Abdomen (USG) | Assess liver size, echogenicity, fatty changes, rule out mass or obstruction |
| Complete Blood Count (CBC) | Rule out anemia, infection, thrombocytopenia |
Additional Tests (if initial workup inconclusive):
| Investigation | Reason |
|---|---|
| ANA, ASMA, anti-LKM1 | Rule out Autoimmune Hepatitis |
| Serum Ferritin + TSAT | Rule out Hemochromatosis |
| Ceruloplasmin + 24h urine copper | Rule out Wilson's disease (less likely at 49) |
| FibroScan / FibroTest | Non-invasive liver fibrosis assessment |
| Liver Biopsy | Gold standard if diagnosis unclear |
| AFP (Alpha-fetoprotein) | If hepatocellular carcinoma suspected on USG |
6. BEST POSSIBLE TREATMENT (Syrups and Tablets)
Important Disclaimer: This is for educational purposes. A qualified physician must prescribe medications after confirming the diagnosis. Treatment must be tailored to the specific cause (viral, alcoholic, NAFLD, etc.).
A. Hepatoprotective / Liver-Supportive Medications
| Medicine | Form | Dose | Purpose |
|---|---|---|---|
| Silymarin (Milk Thistle / Livolin Forte, Silybon 140) | Tablet | 140 mg TDS x 4-8 weeks | Hepatocyte membrane stabilizer, antioxidant - reduces AST/ALT |
| Ursodeoxycholic Acid (UDCA - Udiliv 300) | Tablet | 300 mg BD x 3 months | Improves bile flow, reduces liver enzyme elevation |
| N-Acetylcysteine (NAC - Acemuc syrup) | Syrup | 200 mg TDS | Replenishes glutathione, antioxidant liver protection |
| Liv.52 DS (Himalaya) | Syrup/Tablet | 2 tablets BD or 10 mL BD | Herbal hepatoprotective (widely used in India) |
| Ornithine Aspartate (LOLA - Hepa-Merz) | Granules/Sachet | 3g TDS x 4 weeks | Reduces ammonia, hepatoprotective in alcoholic hepatitis |
B. For Elevated Uric Acid (7.11 mg/dL - borderline)
| Medicine | Form | Dose | Purpose |
|---|---|---|---|
| Febuxostat (Febucip 40) | Tablet | 40 mg OD | Xanthine oxidase inhibitor - reduces uric acid |
| OR Allopurinol 100 mg | Tablet | 100 mg OD | Alternative if Febuxostat not affordable |
C. Vitamins and Supportive Therapy
| Medicine | Form | Dose | Purpose |
|---|---|---|---|
| Vitamin B Complex (Neurobion Forte) | Tablet | 1 BD x 4 weeks | Vitamin B1, B6, B12 - depleted in liver disease |
| Vitamin E 400 IU | Tablet/Cap | 400 IU OD | Antioxidant - proven in NAFLD |
| Zinc Sulphate | Tablet | 50 mg OD | Zinc depletion common in liver disease |
| Vitamin K1 (if PT is elevated) | Tab/Injection | 10 mg IM/oral | Corrects PT if due to Vitamin K deficiency |
D. If Viral Hepatitis Confirmed (after serology):
- Hepatitis B: Tenofovir 300 mg OD or Entecavir 0.5 mg OD (long-term antiviral)
- Hepatitis C: Sofosbuvir/Velpatasvir (Sofovir/Velpanat) - 12-week cure rate >95%
- Hepatitis A/E: Supportive only (self-limiting) - rest, adequate hydration, avoid alcohol and hepatotoxic drugs
E. Dietary and Lifestyle Advice (Equally Important)
- Complete alcohol abstinence (if applicable)
- Avoid all hepatotoxic drugs - paracetamol, NSAIDs, statins (temporarily)
- Low-fat, high-protein diet - avoid fried, oily, junk food
- Increase water intake (2-3 liters/day)
- Avoid uncooked/raw food if hepatitis A/E suspected
- Regular monitoring of LFTs every 4-6 weeks
CLINICAL SUMMARY
| Feature | Interpretation |
|---|---|
| AST 74 + ALT 82, ratio 0.90 | Hepatocellular injury, likely viral or NAFLD |
| Bilirubin 1.43 (mostly indirect) | Mild hyperbilirubinemia |
| Normal ALP, GGTP | Against cholestatic/alcoholic cause |
| Normal albumin (4.27) | Acute process, liver synthetic function preserved |
| Normal kidney function | No hepatorenal involvement |
| Borderline uric acid (7.11) | Metabolic syndrome possible |
- Harrison's Principles of Internal Medicine 22E, p.367-368
- Harper's Illustrated Biochemistry 32nd Ed, p.586
- Henry's Clinical Diagnosis and Management by Laboratory Methods