
Difference between peritoneal dialysis and hemodialysis
Reading File
Both are renal replacement therapies for end-stage kidney disease, but they differ in location (external machine vs. peritoneal cavity), vascular access requirements, frequency, and clinical indications. Now searching the medical library for detailed content.
Searching sources...
Finding Sources
Finding Sources
Excellent - found dedicated sections in multiple authoritative textbooks. Now reading the core comparison sections in parallel.
Reading File
Reading File
Reading File
Good content so far. Now let me get the Harrison's treatment options section and the detailed comparison table from Brenner & Rector.
Reading File
Reading File
Now I have rich content from Harrison's, Comprehensive Clinical Nephrology, Brenner & Rector, and Sabiston. Let me also quickly get the Harrison's PD section for mechanism details.
Reading File
I now have comprehensive content from multiple authoritative textbooks. Let me compile the full comparison.
Peritoneal Dialysis vs. Hemodialysis
Both are forms of renal replacement therapy (RRT) used in end-stage kidney disease (ESKD) when GFR falls below ~10 mL/min/1.73 m² or when uremic symptoms, refractory hyperkalemia, volume overload, or acidosis are present. Neither has been shown to be clearly superior in survival outcomes by randomized trials.
1. Basic Mechanism
| Feature | Hemodialysis (HD) | Peritoneal Dialysis (PD) |
|---|---|---|
| Membrane used | Synthetic semipermeable membrane in a dialyzer | Patient's own peritoneal membrane |
| Solute removal | Diffusion down concentration gradient + ultrafiltration (convective clearance) | Diffusion + convective clearance; rate diminishes as equilibration is reached |
| Fluid removal | Ultrafiltration via the dialyzer | Osmotic gradient using dextrose in dialysate |
| Efficiency | High - large volumes of blood cleared rapidly | Lower - slower, continuous clearance |
HD mechanism (Harrison's 22E): Solute diffusion across a hollow-fiber dialyzer; urea (60 Da) clears efficiently, creatinine (113 Da) less so. Blood and dialysate flow on opposite sides of capillary membranes at very high flow rates.
PD mechanism (Harrison's 22E): 1.5-3 L of dextrose-containing dialysate is instilled into the peritoneal cavity and dwells for 2-4 hours. Metabolic byproducts move from capillaries into the peritoneal fluid. Absorption back occurs via peritoneal lymphatics and capillaries.
2. Access
| Feature | Hemodialysis | Peritoneal Dialysis |
|---|---|---|
| Type of access | Vascular (arteriovenous fistula, AV graft, or tunneled dialysis catheter) | Peritoneal catheter (Tenckhoff catheter) |
| Lead time needed | AVF requires placement 6+ months before anticipated start | PD catheter can be placed much closer to dialysis start; urgent PD is possible |
| Invasiveness | Needle cannulation of AVF/AVG at each session, or catheter | Catheter placed surgically or laparoscopically |
- Sabiston Textbook of Surgery notes that patients with exhausted vascular access options for HD should be considered for PD as an alternative, and vice versa.
3. Schedule and Setting
| Feature | Hemodialysis | Peritoneal Dialysis |
|---|---|---|
| Frequency | Typically 3x/week, 3-4 hours per session | Daily, continuous |
| Setting | In-center (most common in US, >80%) or home | Home-based |
| Continuity | Intermittent - fluid/toxin accumulation between sessions | Continuous - more physiologic |
| CAPD | N/A | 4 manual exchanges/day (~4-6 h dwell each) |
| CCPD | N/A | Automated overnight cycling machine |
4. Contraindications and Patient Selection
PD is relatively contraindicated or less ideal in:
- Prior intra-abdominal surgery (adhesions, scar tissue) - most common barrier
- Obesity
- Ileostomy or colostomy
- Prior renal transplant
- Advanced age, diabetes, heart failure (relative)
- Patients unable to perform exchanges at home independently
HD may be less suitable in:
- Patients with no viable vascular access
- Those who live far from a dialysis center (especially in developing countries)
- Patients preferring home therapy
(Sabiston Textbook of Surgery; Comprehensive Clinical Nephrology 7th Ed.)
5. Advantages and Disadvantages
| Hemodialysis | Peritoneal Dialysis | |
|---|---|---|
| Advantages | Highly efficient solute/fluid removal; medical supervision at center; no daily home burden on patient | Continuous, physiologically smoother; home-based = independence; more liberal fluid intake; better school/work attendance; no vascular access required; better quality of life scores |
| Disadvantages | Travel burden 3x/week; intradialytic hypotension; cardiovascular stress of rapid fluid shifts; vascular access complications; AV fistula can cause high-output cardiac failure | Risk of peritonitis; membrane failure over time; technique failure due to infection/social reasons; abdominal discomfort; patient/caregiver must perform daily exchanges reliably |
6. Complications
Hemodialysis complications:
- Hypotension - most common acute complication (especially in diabetics); from excessive ultrafiltration
- Muscle cramps - from rapid volume removal
- Dialyzer reactions - Type A (IgE-mediated, anaphylactoid) or Type B (complement activation, chest/back pain)
- High-output cardiac failure from AV fistula shunting
- Vascular access infections (catheters carry highest mortality risk)
Peritoneal dialysis complications:
- Peritonitis - most important; can cause membrane failure; fungal peritonitis may require conversion to HD
- Catheter tunnel infections
- Mechanical issues (catheter malposition, leaks)
- Ultrafiltration failure (membrane deterioration over years)
- Encapsulating peritoneal sclerosis (rare but serious)
(Harrison's 22E; Comprehensive Clinical Nephrology 7th Ed.)
7. Outcomes and Survival
- No large RCT has definitively shown one modality is superior in survival - the attempted NECOSAD trial had to stop due to poor recruitment.
- Retrospective/prospective nonrandomized studies show no consistent survival advantage for either modality.
- Older evidence suggested PD may be inferior in patients with coronary heart disease or CHF long-term; more recent data suggest this may not hold.
- PD is associated with superior health-related quality of life compared to in-center HD.
- Technique failure in PD (from infection or social reasons) is associated with higher short-term mortality risk.
- In infants and pediatric patients, PD is generally preferred and widely recommended.
(Comprehensive Clinical Nephrology 7th Ed.; Harrison's 22E)
8. Special Situations Favoring Each
| Situation | Preferred Modality |
|---|---|
| Residual renal function preservation | PD (may preserve residual function longer) |
| Cardiovascular instability | PD (avoids rapid fluid shifts) |
| Diabetes with autonomic neuropathy | PD may be better tolerated |
| Prior abdominal surgeries | HD preferred |
| Remote location / resource-limited setting | PD (no center needed) |
| Infants/small children | PD (standard recommendation) |
| Patients wanting independence and home therapy | PD |
| Exhausted vascular access | PD |
| Patient unable to self-administer PD | HD |
| Pregnancy | PD or intensive HD (both used; PD may have higher small-for-gestational-age rates) |
9. Key Decision Principle
The 2019 KDOQI guidelines emphasize the "ESKD Life-Plan" - a collaborative, individualized decision between patient and interdisciplinary team selecting "the right access, for the right patient, at the right time, for the right reasons." Patient preference should be the primary factor when medical contraindications are absent. Modality-neutral counseling before dialysis start increases the likelihood patients will choose and receive PD.
- Harrison's Principles of Internal Medicine 22E, p. 535-536
- Comprehensive Clinical Nephrology 7th Ed., p. 105-135
- Sabiston Textbook of Surgery, p. 3460-3464
- Brenner and Rector's The Kidney, 2-Volume Set, p. 3633-3637
Causes of CVA (3marks )
Stroke (CVA) is caused by either ischemia (~85%) or hemorrhage (~15%). Let me pull the authoritative textbook content.
Searching sources...
Finding Sources
Finding Sources
Finding Sources
Reading File
Reading File
Excellent - I have the full Harrison's table. Now I have everything needed for a concise 3-mark answer.
Causes of CVA (Cerebrovascular Accident / Stroke)
CVA is broadly divided into ischemic (~80%) and hemorrhagic (~20%) types.
I. Ischemic Stroke (Infarction)
Three major mechanisms:
1. Thrombosis
- Large vessel thrombosis - atherosclerosis of major cerebral/carotid arteries
- Small vessel (lacunar) stroke - lipohyalinosis of small penetrating arteries; associated with hypertension and diabetes
2. Embolism
- Cardioembolic - most common sources:
- Atrial fibrillation (most important)
- Mural thrombus (post-MI, dilated cardiomyopathy)
- Valvular lesions (mitral stenosis, mechanical valves, infective endocarditis)
- Artery-to-artery embolism - from carotid bifurcation plaque, aortic arch, or aortic dissection
3. Hypoperfusion (Watershed infarction)
- Systemic hypotension causing ischemia in border zones between major arterial territories
II. Hemorrhagic Stroke
4. Intracerebral Hemorrhage (ICH)
- Hypertension (most common cause) - rupture of small penetrating vessels
- Cerebral amyloid angiopathy (especially in elderly)
- Arteriovenous malformations (AVMs)
- Anticoagulant/thrombolytic therapy
5. Subarachnoid Hemorrhage (SAH)
- Rupture of a saccular (berry) aneurysm (most common)
- AVM rupture
III. Less Common / Uncommon Causes
| Category | Examples |
|---|---|
| Hypercoagulable states | Protein C/S deficiency, antiphospholipid syndrome, Factor V Leiden, polycythemia vera |
| Vasculitis | SLE, giant cell arteritis, CNS vasculitis |
| Arterial dissection | Internal carotid or vertebral artery dissection (especially in young patients) |
| Hematological | Sickle cell anemia, TTP, DIC |
| Others | Homocysteinemia, oral contraceptives, systemic malignancy |
Quick Summary for 3 Marks
| Type | Main Causes |
|---|---|
| Ischemic (80%) | Atherothrombosis, cardioembolism (AF, MI), lacunar disease, hypoperfusion |
| Hemorrhagic (20%) | Hypertension, aneurysm rupture (SAH), AVM, anticoagulants |
| Risk factors | Hypertension, diabetes, atrial fibrillation, dyslipidemia, smoking |
- Harrison's Principles of Internal Medicine 22E, Table 438-2
- Schwartz's Principles of Surgery 11th Ed.
Compare and contrast sevoflurane and desflurane (5marks)
Both are halogenated volatile inhalational anesthetics used for maintenance of general anesthesia, but they differ significantly in physical properties, clinical behavior, and side effect profiles.
Searching sources...
Finding Sources
Finding Sources
Good - found content in Miller's Anesthesia, Barash, Morgan & Mikhail, and Katzung. Let me read the key sections in parallel.
Reading File
Reading File
Reading File
Good content on desflurane and sevoflurane from Morgan & Mikhail. Now let me get the sevoflurane sections fully and Miller's comparison data.
Reading File
Reading File
Now let me get the desflurane section from Morgan & Mikhail and the physical properties table.
Reading File
I now have comprehensive data from Morgan & Mikhail's Clinical Anesthesiology. I have everything needed for a thorough 5-mark answer.
Sevoflurane vs. Desflurane - Compare and Contrast
Both are modern fluorinated ether volatile inhalational anesthetics used for maintenance (and in sevoflurane's case, induction) of general anesthesia. They share the same basic mechanism - enhancing inhibitory GABA-A receptor activity and suppressing excitatory NMDA receptors - but differ substantially in physical properties, clinical use, and side effect profiles.
1. Physical Properties
| Property | Sevoflurane | Desflurane |
|---|---|---|
| Chemical structure | Fluorinated methyl isopropyl ether | Fluorinated ethyl methyl ether (isoflurane with F replacing Cl) |
| Blood/gas partition coefficient (λb/g) | 0.65 | 0.42 (lowest of all volatile agents) |
| MAC (in O₂, adults) | 2% | 6-7% (roughly 1/4 as potent) |
| Vapor pressure at 20°C | ~160 mmHg | 681 mmHg (near boiling at room temp) |
| Vaporizer | Standard variable-bypass vaporizer | Requires special heated pressurized vaporizer (TEC 6) |
| Odor | Non-pungent, sweet | Pungent, irritating |
The extremely high vapor pressure of desflurane means it would boil at room temperature at altitude (e.g., Denver), necessitating its specialized vaporizer. (Morgan & Mikhail's Clinical Anesthesiology 7e)
2. Induction and Emergence
| Feature | Sevoflurane | Desflurane |
|---|---|---|
| Induction | Excellent - non-pungent, smooth and rapid; suitable for inhalational induction in adults AND children (4-8% in 50% N₂O/O₂ achieves induction in ~1 min) | Not suitable for inhalational induction - pungent odor causes airway irritation, coughing, laryngospasm, breath-holding |
| Speed of emergence | Rapid (low blood solubility) | Fastest of all agents (~50% faster than isoflurane) due to extremely low λb/g of 0.42 |
| Alveolar concentration control | Rapid | Tightest control - alveolar concentration approaches inspired concentration faster than any other agent |
3. Cardiovascular Effects
| Feature | Sevoflurane | Desflurane |
|---|---|---|
| Myocardial contractility | Mild depression | Similar mild depression |
| SVR / BP | Mild decrease (slightly less than isoflurane/desflurane) | Mild decrease |
| Heart rate | Little or no rise - cardiac output not as well maintained | Increases HR (similar to isoflurane) - maintains cardiac output better |
| Sympathetic activation | Minimal | Rapid increases in concentration cause marked sympathetic stimulation - transient tachycardia and hypertension (especially with rapid increases to >1 MAC) |
| Sensitization to epinephrine | No significant sensitization | Epinephrine safe up to 4.5 mcg/kg - no myocardial sensitization |
| QT interval | May prolong QT interval | No significant QT effect |
The sympathetic surge with rapid desflurane concentration increases is a clinically important feature - slow titration is recommended. (Morgan & Mikhail's 7e)
4. Respiratory Effects
| Feature | Sevoflurane | Desflurane |
|---|---|---|
| Airway irritation | None - bronchodilator, excellent for asthmatic patients | Pungent - increases airway resistance, can trigger bronchospasm, laryngospasm; NOT suitable for induction |
| Respiratory depression | Yes (dose-dependent) | Yes (similar) |
| Bronchospasm reversal | Yes - reverses bronchospasm effectively | Desflurane does NOT cause bronchodilation (unlike sevoflurane and isoflurane) |
Barash's Clinical Anesthesia confirms airway resistance responses to desflurane were significantly different from sevoflurane (p < 0.05), making sevoflurane the preferred agent in reactive airway disease.
5. CNS Effects
| Feature | Sevoflurane | Desflurane |
|---|---|---|
| Cerebral blood flow (CBF) | Slight increase at normocarbia (some studies show decrease); autoregulation impaired at >1.5 MAC (less pronounced than isoflurane) | Slight increase at normocarbia |
| CMRO₂ | Decreases (similar to isoflurane) | Decreases similarly |
| EEG | Depresses EEG; seizure activity not reported | Depresses EEG similarly |
| Intracranial pressure | Slight increase; use with caution in raised ICP | Similar - contraindicated in intracranial hypertension |
| Emergence delirium | Seen in children | Also reported in pediatric patients |
6. Metabolism and Toxicity
| Feature | Sevoflurane | Desflurane |
|---|---|---|
| Hepatic metabolism | ~5% metabolized by CYP2E1 | <0.02% metabolized - essentially inert |
| Inorganic fluoride (F⁻) | Levels may exceed 50 μmol/L in ~7% patients; no clinically significant nephrotoxicity documented | Fluoride levels essentially unchanged from baseline |
| Compound A | Degraded by soda lime/barium hydroxide lime → Compound A (nephrotoxic in rats; no proven toxicity in humans); use fresh gas flow ≥2 L/min as precaution | Not significantly degraded by CO₂ absorbent |
| Carbon monoxide (CO) | Minimal CO production | Produces significant CO when in contact with desiccated CO₂ absorbent (especially barium hydroxide lime) - risk of CO poisoning; use calcium hydroxide absorbent to prevent |
| Environmental | Greenhouse gas | Most ozone-depleting of all inhalational anesthetics |
7. Neuromuscular Effects
Both agents potentiate non-depolarizing neuromuscular blocking agents. Sevoflurane produces adequate relaxation for intubation after inhalational induction.
8. Contraindications (Shared and Unique)
| Sevoflurane | Desflurane | |
|---|---|---|
| Shared | Malignant hyperthermia (both are triggers), severe hypovolemia, intracranial hypertension | Same |
| Unique | Caution with reactive airway if using high concentrations (though generally bronchodilatory) | Not for inhalational induction; avoid rapid concentration increases (sympathetic surge); desiccated CO₂ absorbent → CO toxicity |
Summary Table for 5 Marks
| Feature | Sevoflurane | Desflurane |
|---|---|---|
| Blood/gas coefficient | 0.65 | 0.42 |
| MAC | 2% | 6-7% |
| Induction | Ideal (non-pungent) | Not suitable (pungent) |
| Emergence | Rapid | Fastest |
| Heart rate | No increase | Increases |
| Airways | Bronchodilator - safe in asthma | Bronchoconstrictor - avoid in asthma |
| Metabolism | 5% (fluoride, Compound A) | <0.02% (CO with dry absorbent) |
| Vaporizer | Standard | Special heated vaporizer |
| Environmental | Moderate GHG | Most ozone-depleting |
| Best used for | Induction + maintenance; pediatrics; asthma; outpatient | Maintenance only; neurosurgery (tight control); procedures needing fast wake-up |
- Morgan & Mikhail's Clinical Anesthesiology 7e, pp. 305-313
- Barash, Cullen & Stoelting's Clinical Anesthesia 9e
- Miller's Anesthesia 10e
Carbon dioxide transport
CO₂ is transported in blood in three forms: dissolved in plasma (~7-10%), as bicarbonate (~70%), and bound to proteins as carbamino compounds (~20-23%). Let me pull the full textbook content.
Searching sources...
Finding Sources
Finding Sources
Excellent - found dedicated sections in Guyton & Hall, Medical Physiology (Boron), Murray & Nadel, and Morgan & Mikhail. Reading them all in parallel.
Reading File
Reading File
Reading File
Excellent - found the detailed quantitative table from Morgan & Mikhail. Let me get the rest of the CO₂ transport section including carbamino compounds, the chloride shift, Haldane effect, and the Guyton CO₂ dissociation curve section.
Reading File
Finding Sources
Reading File
Reading File
I now have comprehensive, quantitative data from Guyton & Hall, Ganong, and Morgan & Mikhail. Let me also fetch the CO₂ transport diagram from Guyton.
Loading Image
Loading Image
Reading File
I now have everything needed - comprehensive data with the diagrams. Here is the full, well-structured answer.
Carbon Dioxide Transport
CO₂ is produced by aerobic metabolism in tissues (normal production ~200 mL/min at rest) and must be transported from the tissues to the lungs for elimination. CO₂ is ~20x more soluble in blood than O₂, and chemical reactions allow it to be transported 15-20x more than dissolved CO₂ alone could carry.
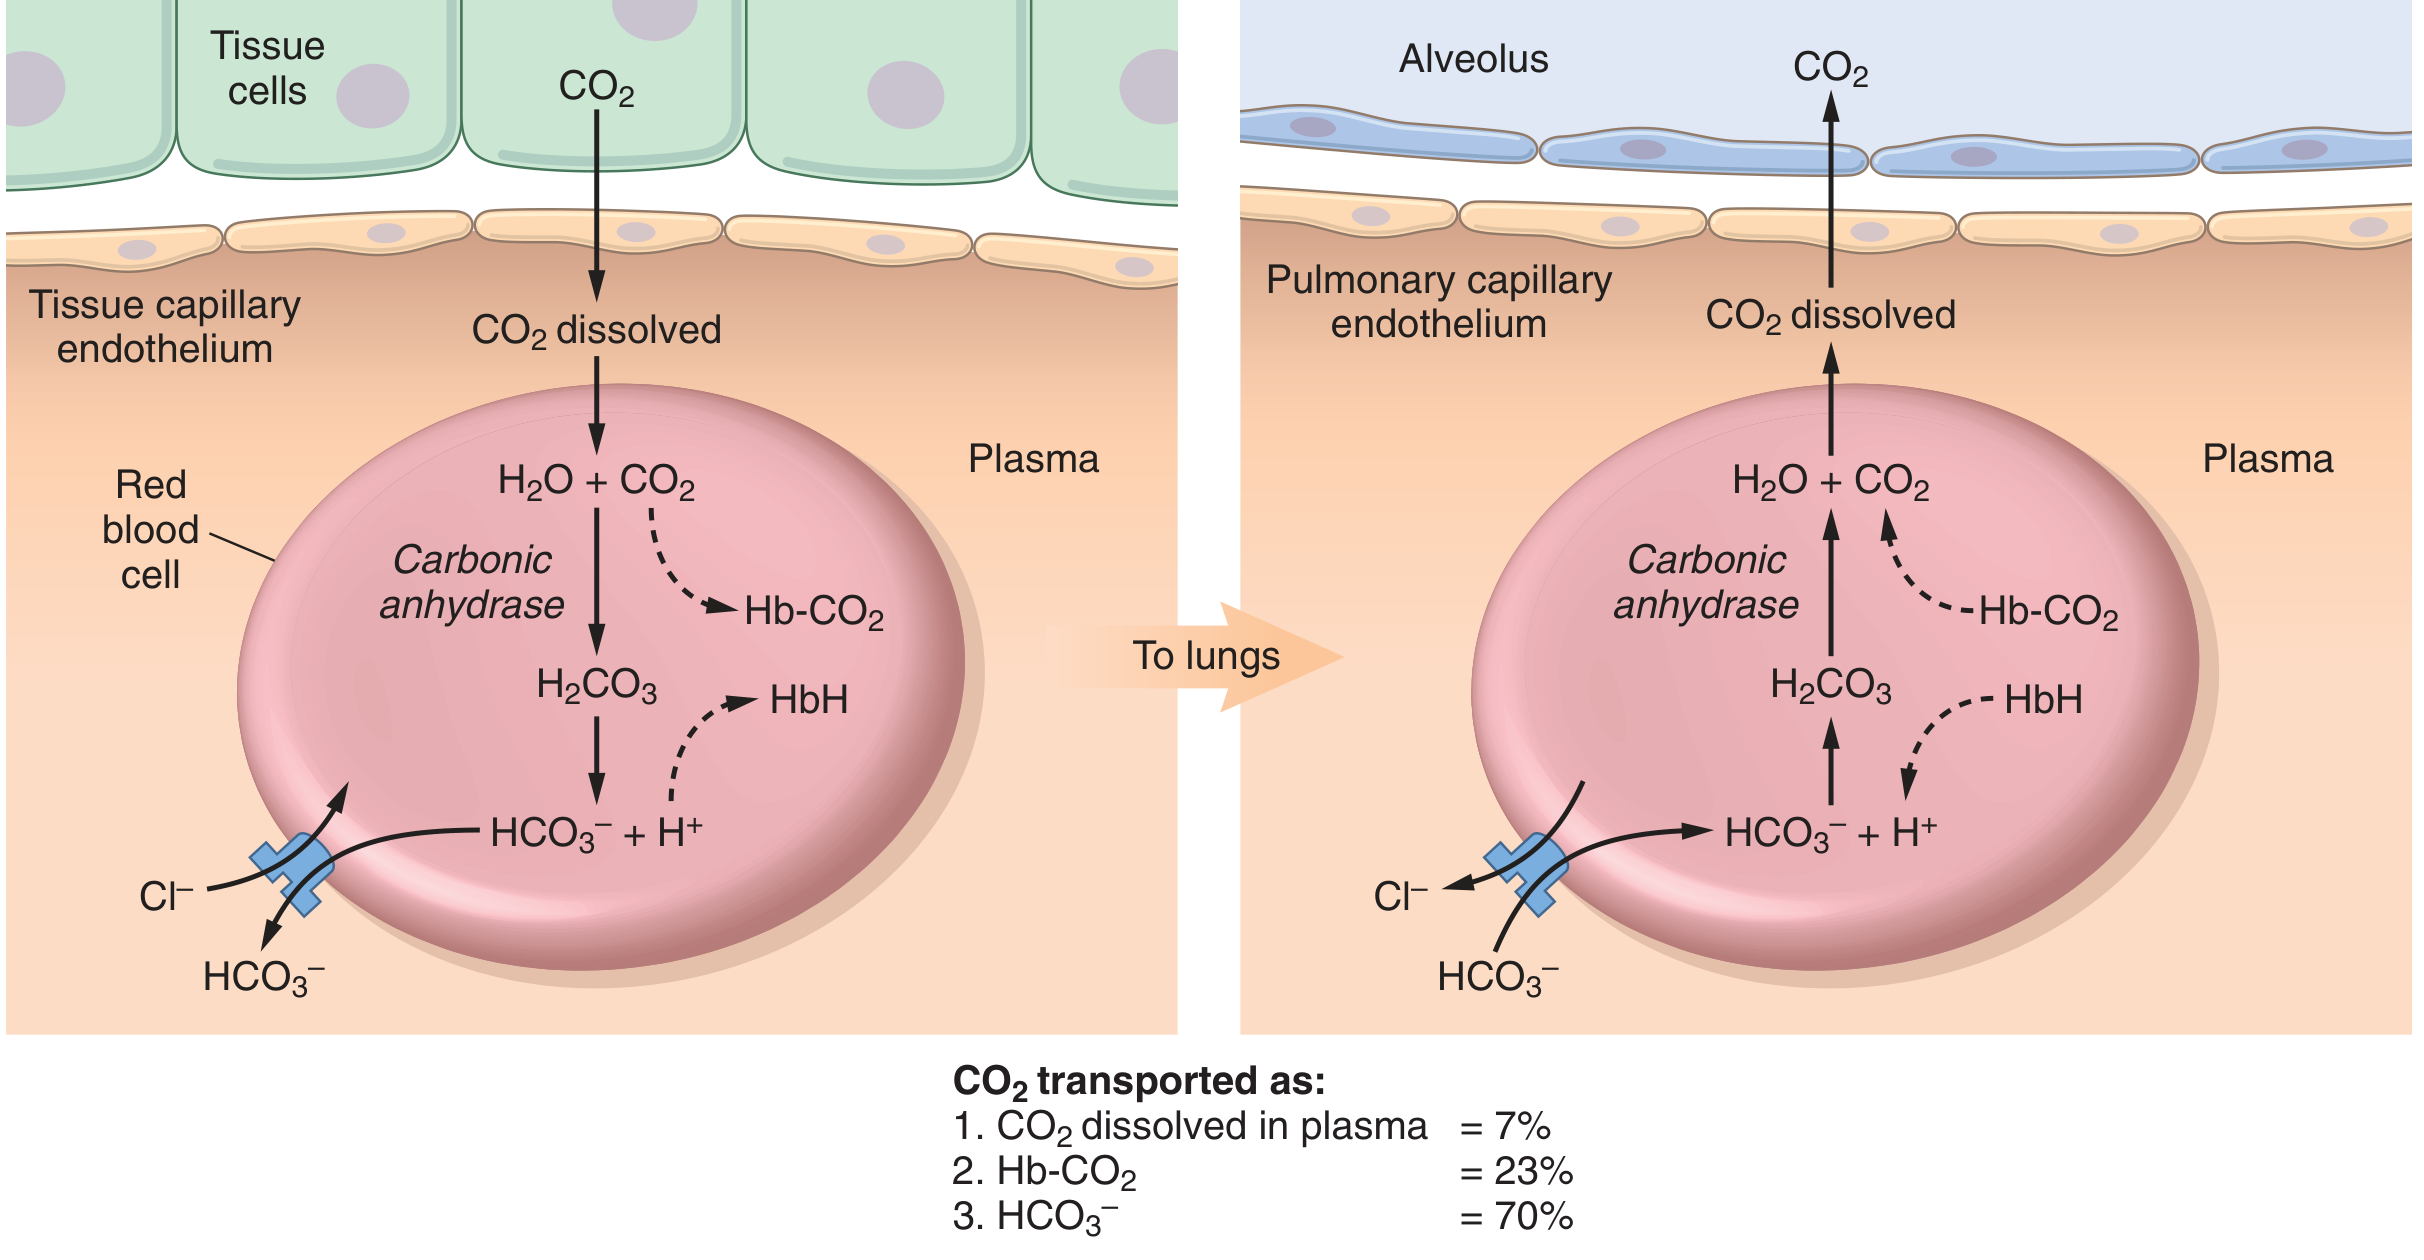
Three Forms of CO₂ Transport
| Form | Venous Blood | Arterial Blood | % of Transport |
|---|---|---|---|
| Dissolved CO₂ | 1.27 mmol/L | 1.10 mmol/L | ~5-7% |
| Bicarbonate (HCO₃⁻) | 20.33 mmol/L | 19.30 mmol/L | ~70% |
| Carbamino compounds | 1.70 mmol/L | 1.10 mmol/L | ~23% |
| Total CO₂ | 23.30 mmol/L | 21.50 mmol/L | — |
(Morgan & Mikhail's Clinical Anesthesiology 7e, Table 23-5)
1. Dissolved CO₂ (~7%)
- CO₂ is ~24x more soluble in blood than O₂ (solubility coefficient = 0.031 mmol/L/mmHg at 37°C)
- Venous PCO₂ = 45 mmHg → ~2.7 mL/100 mL dissolved
- Arterial PCO₂ = 40 mmHg → ~2.4 mL/100 mL dissolved
- Difference = ~0.3 mL/100 mL transported in dissolved form per circulation
- This fraction is small but important - it is the dissolved CO₂ that determines PCO₂ and drives diffusion across membranes
(Guyton & Hall Medical Physiology)
2. Bicarbonate (HCO₃⁻) - THE MAJOR FORM (~70%)
This is the most important form of CO₂ transport and depends critically on carbonic anhydrase inside red blood cells.
At tissue capillaries (CO₂ loading):
Step 1: CO₂ diffuses from metabolizing cells into plasma, then into RBCs
Step 2: Inside RBCs, carbonic anhydrase (CA) catalyzes the rapid hydration reaction - speeding it ~5000x:
CO₂ + H₂O → H₂CO₃ → H⁺ + HCO₃⁻
Without CA, this reaction would take minutes; with it, it completes in milliseconds within the capillary transit time.
Step 3 - H⁺ buffering: The H⁺ released is buffered by deoxyhemoglobin (a powerful buffer due to histidine residues):
H⁺ + Hb⁻ → HHb
This prevents a large fall in pH and allows more CO₂ to continue hydrating.
Step 4 - Chloride Shift (Hamburger Shift):
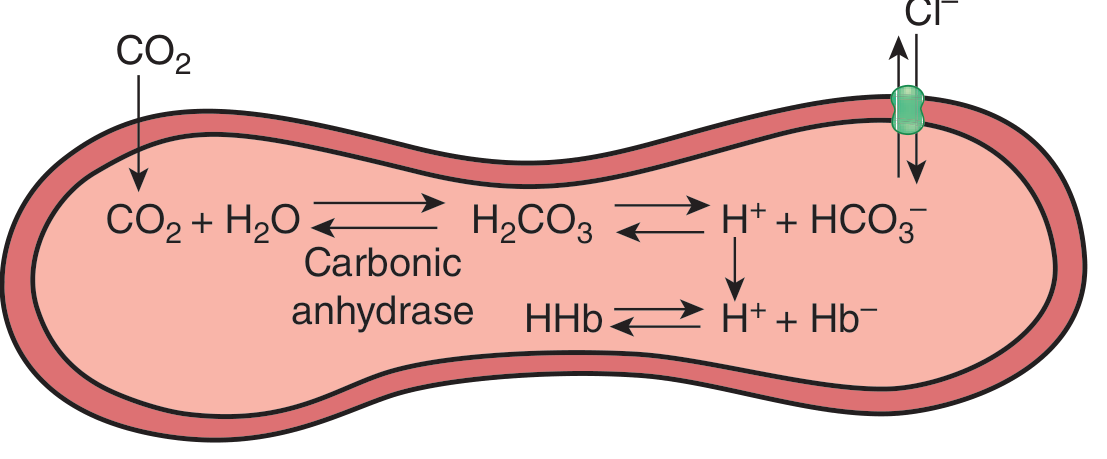
- ~70% of the HCO₃⁻ formed inside RBCs diffuses out into plasma in exchange for Cl⁻ moving in
- This exchange is mediated by Anion Exchanger 1 (AE1 / Band 3 protein) in the RBC membrane
- Occurs rapidly, essentially complete within 1 second
- Result: Cl⁻ content of venous RBCs > arterial RBCs
- Each CO₂ molecule entering the RBC adds one osmotically active particle → venous RBCs are slightly larger → venous hematocrit is ~3% greater than arterial
At pulmonary capillaries (CO₂ unloading):
- The entire process reverses: Cl⁻ exits RBCs, HCO₃⁻ re-enters, carbonic anhydrase converts H₂CO₃ back to CO₂ + H₂O, and CO₂ diffuses into alveoli
(Guyton & Hall; Ganong's Review of Medical Physiology 26e)
3. Carbamino Compounds (~23%)
- CO₂ reacts directly with free amino (-NH₂) groups on proteins to form carbamino compounds:
R-NH₂ + CO₂ → R-NH-COO⁻ + H⁺
- The dominant carbamino compound in blood is carbaminohemoglobin (Hb-CO₂) - CO₂ binds to the globin portion, not the heme iron
- Plasma proteins contribute negligibly to carbamino transport
- Key property: Deoxygenated hemoglobin (deoxy-Hb) has 3.5 times greater affinity for CO₂ than oxyhemoglobin → venous blood (more deoxy-Hb) carries more carbamino CO₂ than arterial blood
(Morgan & Mikhail's 7e)
The Haldane Effect
The Haldane effect describes the influence of O₂ on CO₂ transport, and it is quantitatively more important than the Bohr effect for gas transport overall.
Binding of O₂ to Hb displaces CO₂ from blood; deoxygenation of Hb increases CO₂ uptake.
This occurs via two mechanisms:
- Carbamino: Deoxy-Hb has higher affinity for CO₂ → more carbaminohemoglobin formed in tissues; oxygenation in lungs converts Hb to a stronger acid → less CO₂ bound → CO₂ released
- Bicarbonate: Deoxy-Hb is a weaker acid → takes up H⁺ more readily → shifts equilibrium toward HCO₃⁻ formation; oxygenation releases H⁺ from Hb → H⁺ combines with HCO₃⁻ → forms CO₂ for elimination
Significance (Guyton & Hall): The Haldane effect approximately doubles the amount of CO₂ released from blood in the lungs, and approximately doubles CO₂ uptake from tissues. Without it, only ~2 vol% of CO₂ would be exchanged; with it, ~4 vol% is exchanged per circulation.
CO₂ Dissociation Curve
The CO₂ dissociation curve plots total CO₂ content vs. PCO₂. Key features:
- The curve is steeper and more linear than the O₂-Hb dissociation curve (no sigmoidal shape)
- Oxygenated blood (PO₂ = 100 mmHg) has a lower CO₂ content at any given PCO₂ than deoxygenated blood (PO₂ = 40 mmHg) → this difference is the Haldane effect
- Normal venous point: PCO₂ = 45 mmHg, total CO₂ ~52 vol%
- Normal arterial point: PCO₂ = 40 mmHg, total CO₂ ~48 vol%
Summary
| Mechanism | % | Location | Key Mediator |
|---|---|---|---|
| Dissolved CO₂ | ~7% | Plasma + RBC | Physical solubility |
| Bicarbonate (HCO₃⁻) | ~70% | Mainly plasma (after shift) | Carbonic anhydrase + Chloride shift (Band 3) |
| Carbaminohemoglobin | ~23% | RBC | Deoxy-Hb affinity for CO₂ |
Clinical relevance:
-
Acetazolamide (carbonic anhydrase inhibitor) blocks bicarbonate formation → tissue PCO₂ can rise to 80 mmHg
-
Respiratory acidosis/alkalosis reflects impaired or excessive CO₂ elimination
-
The Haldane effect explains why pulmonary oxygenation is essential not just for O₂ loading but also for efficient CO₂ unloading
-
Guyton & Hall Textbook of Medical Physiology, Ch. 41
-
Morgan & Mikhail's Clinical Anesthesiology 7e, Ch. 23
-
Ganong's Review of Medical Physiology 26e, Ch. 35
Oxygen consumption
Oxygen consumption (VO₂) is the amount of O₂ used by tissues per unit time, normally ~250 mL/min at rest in a 70 kg adult. Let me pull the full textbook content.
Searching sources...
Finding Sources
Finding Sources
Excellent - great sources found. Reading the key sections in parallel.
Reading File
Reading File
Reading File
Reading File
Good content. Now let me get the Fick principle details, oxygen delivery/consumption relationships, and the VO₂max section.
Reading File
Reading File
Finding Sources
Excellent - now let me get the critical DO₂ / VO₂ relationship and the regional O₂ consumption table.
Reading File
Reading File
Loading Image
I now have comprehensive data from all major physiology and clinical textbooks. Here is the complete answer.
Oxygen Consumption (VO₂)
Oxygen consumption (VO₂) is the volume of oxygen extracted from the blood and utilized by the tissues per unit time. At rest in a 70 kg adult, VO₂ = ~250 mL/min (or ~3.5 mL/kg/min).
1. Definition and the Fick Principle
The Fick principle states that in the steady state, oxygen consumed by tissues equals the oxygen delivered minus the oxygen returned to the lungs:
VO₂ = Cardiac Output (CO) × (CaO₂ - CvO₂)
Where:
- CaO₂ = arterial O₂ content (mL O₂/dL blood)
- CvO₂ = mixed venous O₂ content (mL O₂/dL blood)
- (CaO₂ - CvO₂) = arteriovenous O₂ difference (a-v DO₂ difference), normally 4-6 mL/100 mL blood
Rearranging:
Cardiac Output = VO₂ ÷ (CaO₂ - CvO₂)
Example (Costanzo Physiology 7e):
- VO₂ = 250 mL O₂/min
- CaO₂ = 0.20 mL O₂/mL blood
- CvO₂ = 0.15 mL O₂/mL blood
- CO = 250 ÷ (0.20 - 0.15) = 5000 mL/min = 5 L/min ✓
(Costanzo Physiology 7e; Ganong's Review of Medical Physiology 26e)
2. Oxygen Delivery (DO₂) - The Supply Side
Before VO₂ can occur, O₂ must be delivered to tissues:
DO₂ = CO × CaO₂ × 10
CaO₂ = (Hb × 1.34 × SaO₂) + (PaO₂ × 0.0031)
- Normal CaO₂ = 16-22 mL O₂/dL
- Normal DO₂ = 700-1400 mL/min
- Under normal conditions, DO₂ exceeds VO₂ by ~75% (delivery far exceeds demand)
Key determinants of DO₂:
| Factor | Normal Value | Effect on DO₂ |
|---|---|---|
| Cardiac output | 5 L/min | ↑ CO → ↑ DO₂ |
| Hemoglobin | 14-16 g/dL | ↓ Hb (anemia) → ↓ DO₂ |
| SaO₂ | 97-99% | ↓ SaO₂ (hypoxia) → ↓ DO₂ |
| PaO₂ | 95-100 mmHg | Dissolved O₂ is negligible |
(Creasy & Resnik's Maternal-Fetal Medicine)
3. Relationship of DO₂ to VO₂ - The Critical Threshold
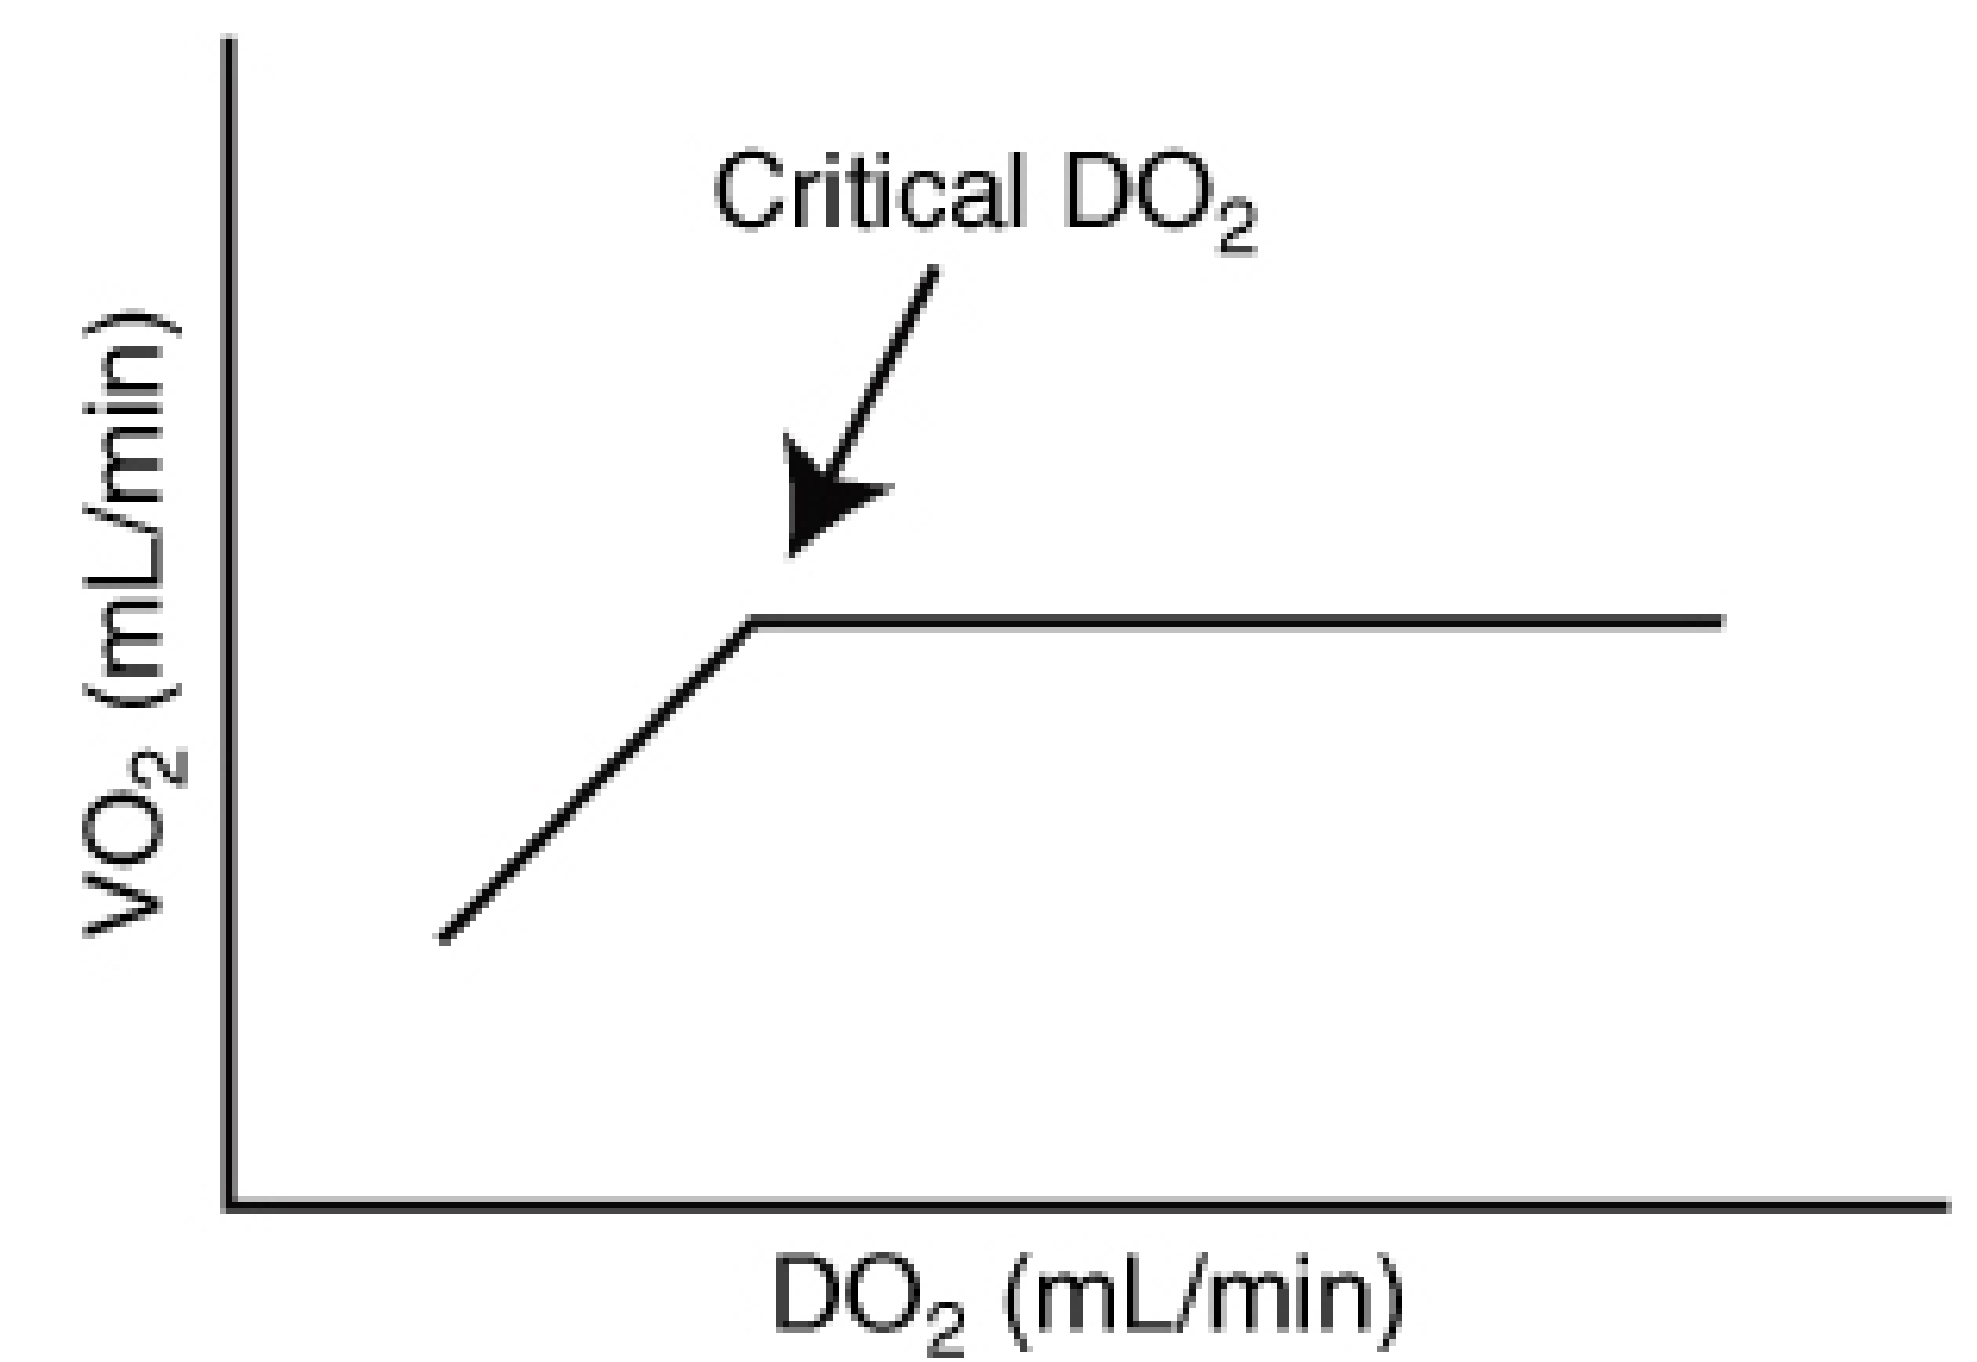
This is one of the most important physiological concepts in critical care:
- Above the critical DO₂ threshold: VO₂ is independent of DO₂ - tissues extract more O₂ as needed (increased O₂ extraction ratio), keeping VO₂ constant over a wide range of delivery
- Below the critical DO₂ threshold: VO₂ becomes supply-dependent - tissues cannot extract enough O₂ to meet metabolic needs → anaerobic metabolism begins → lactic acidosis
Compensation mechanism: As DO₂ falls, tissues increase the O₂ extraction ratio (O₂ER):
O₂ER = (CaO₂ - CvO₂) / CaO₂ (normal ~25%)
When O₂ extraction is maxed out (~60-70%), VO₂ can no longer be maintained → supply-dependent zone.
(Miller's Anesthesia 10e; Fischer's Mastery of Surgery 8e)
4. Normal Resting Values
| Parameter | Normal Value |
|---|---|
| VO₂ (whole body, rest) | ~250 mL/min (3.5 mL/kg/min) |
| DO₂ (whole body, rest) | 700-1400 mL/min |
| a-v O₂ difference | 4-6 mL/100 mL blood |
| O₂ extraction ratio | ~25% |
| Mixed venous O₂ saturation (SvO₂) | 70-75% |
5. Regional O₂ Consumption
Different organs have vastly different metabolic demands and extraction:
| Organ | Blood Flow | A-V O₂ Difference | Notes |
|---|---|---|---|
| Heart (myocardium) | ~0.5 mL/g/min | 114 mL/L | Highest extraction; basal O₂ consumption ~2 mL/100g/min |
| Brain | ~0.5 mL/g/min | 62 mL/L | ~20% of total resting VO₂; no O₂ reserve |
| Kidneys (cortex) | ~5 mL/g/min | 14 mL/L | High flow, low extraction (filtration function) |
| Kidneys (medulla) | ~0.6 mL/g/min | High extraction | Vulnerable to hypoxia; PO₂ ~15 mmHg |
| Skeletal muscle (rest) | 2-4 mL/100g/min | Low | Huge reserve; major contributor during exercise |
(Ganong's Review of Medical Physiology 26e, Table 33-1)
6. Myocardial O₂ Consumption - Special Case
The heart is unique because it extracts ~75% of delivered O₂ at rest (near maximum). Therefore, the only way to increase myocardial O₂ delivery during increased demand is to increase coronary blood flow (unlike skeletal muscle which can increase extraction).
Determinants of myocardial VO₂ (in order of importance):
- Wall tension (pressure work) - dominant determinant; explains why aortic stenosis causes massive ↑ in myocardial O₂ consumption
- Heart rate - more contractions per minute = more O₂ used
- Contractility - increased inotropy increases O₂ consumption
- Volume work (less costly than pressure work)
Key point (Costanzo Physiology 7e): Pressure work is far more metabolically expensive than volume work. This is why:
- Aortic stenosis → greatly ↑ myocardial VO₂ (high pressure work even with low CO)
- Exercise → ↑ VO₂ but less than pressure overload states
- Left ventricle wall is thicker than right ventricle → compensates for higher pressure work (aortic pressure 100 mmHg vs. pulmonary 15 mmHg) via the Law of Laplace (P = 2HT/r)
7. VO₂max (Maximal Oxygen Consumption)
VO₂max = maximum O₂ uptake by the body despite increasing workload - the upper limit of cardiovascular-respiratory fitness.
| VO₂max | Clinical Significance |
|---|---|
| >20 mL/kg/min (>75% predicted) | Safe for major lung resection including pneumonectomy |
| 10-15 mL/kg/min (35-75% predicted) | Increased perioperative risk |
| <10 mL/kg/min (<35% predicted) | Extremely high risk; relative contraindication to major anatomic resection |
Changes with exercise (Ganong's data):
| Workload | VO₂ (mL/min) | Heart Rate | Cardiac Output | A-V O₂ diff |
|---|---|---|---|---|
| Rest | 267 | 64 | 6.4 L/min | 4.3 mL/dL |
| Moderate | 1430 | 122 | 15.2 L/min | 9.4 mL/dL |
| Heavy | 3007 | 173 | 20.9 L/min | 14.5 mL/dL |
During exercise, both ↑ cardiac output AND ↑ O₂ extraction contribute to meeting the increased VO₂ demand.
(Barash's Clinical Anesthesia 9e; Ganong's Review of Medical Physiology 26e)
8. Clinical Relevance
| Condition | Effect on VO₂ |
|---|---|
| Septic shock / ARDS | Maldistribution of flow; supply-demand mismatch despite normal/high global DO₂ |
| Hypothermia | ↓ VO₂ (used therapeutically in cardiac surgery, neonatal hypoxic-ischemic encephalopathy) |
| Fever / hyperthyroidism | ↑ VO₂ |
| Anemia | ↓ DO₂; VO₂ maintained initially via ↑ extraction, then fails at critical Hb |
| CO poisoning | Blocks O₂ binding to Hb → ↓ DO₂ and impaired cellular O₂ utilization |
| Cyanide poisoning | Blocks mitochondrial O₂ utilization → ↑ SvO₂ paradoxically (cells can't use O₂) |
Summary
VO₂ = CO × (CaO₂ - CvO₂) Normal ~250 mL/min at rest; increases up to 20x during maximal exercise VO₂ is normally independent of DO₂ (supply-independent zone) Below critical DO₂, VO₂ falls and lactic acidosis ensues Myocardial VO₂ is dominated by pressure work, not volume
- Costanzo Physiology 7e, Ch. on Cardiac Output
- Ganong's Review of Medical Physiology 26e, Ch. 30, 33, 37
- Miller's Anesthesia 10e, Ch. on Shock
- Barash's Clinical Anesthesia 9e, Ch. 38
Buffer system of the body
The body uses chemical buffers (bicarbonate, phosphate, proteins) working alongside respiratory and renal compensatory mechanisms to maintain blood pH at 7.35-7.45. Let me pull the full textbook content.
Searching sources...
Finding Sources
Finding Sources
Finding Sources
Finding Sources
Excellent - found dedicated sections in Guyton & Hall, Lippincott Biochemistry, Basic Medical Biochemistry, and Mulholland Surgery. Reading them all in parallel.
Reading File
Reading File
Reading File
Now let me get the full phosphate, protein/hemoglobin buffer content from Guyton, and the Basic Medical Biochemistry overview.
Reading File
Reading File
Now let me fetch the bicarbonate buffer diagram and get the respiratory/renal compensation sections from Guyton.
Loading Image
Reading File
I now have comprehensive content from all major physiology and biochemistry textbooks. Here is the complete, well-structured answer.
Buffer Systems of the Body
A buffer is a solution of a weak acid and its conjugate base that resists changes in pH when acid or alkali is added. The body normally produces ~22,000 mEq of acid per day from metabolism; without buffers, this would drop blood pH below 1. Instead, pH is maintained between 7.35-7.45 through three integrated lines of defense:
- Chemical buffer systems (immediate, seconds)
- Respiratory regulation (minutes)
- Renal regulation (hours to days)
Key Concept: Henderson-Hasselbalch Equation
All buffer systems obey this equation:
pH = pKa + log ([A⁻] / [HA])
For the bicarbonate system specifically:
pH = 6.1 + log (HCO₃⁻ / 0.03 × PCO₂)
- Normal: pH = 6.1 + log (24 / 1.2) = 6.1 + log 20 = 6.1 + 1.3 = 7.4
- HCO₃⁻ regulated by kidneys; PCO₂ regulated by lungs
(Guyton & Hall Medical Physiology)
LINE 1: Chemical Buffer Systems
1. Bicarbonate-Carbonic Acid Buffer System - THE PRIMARY EXTRACELLULAR BUFFER (~70%)
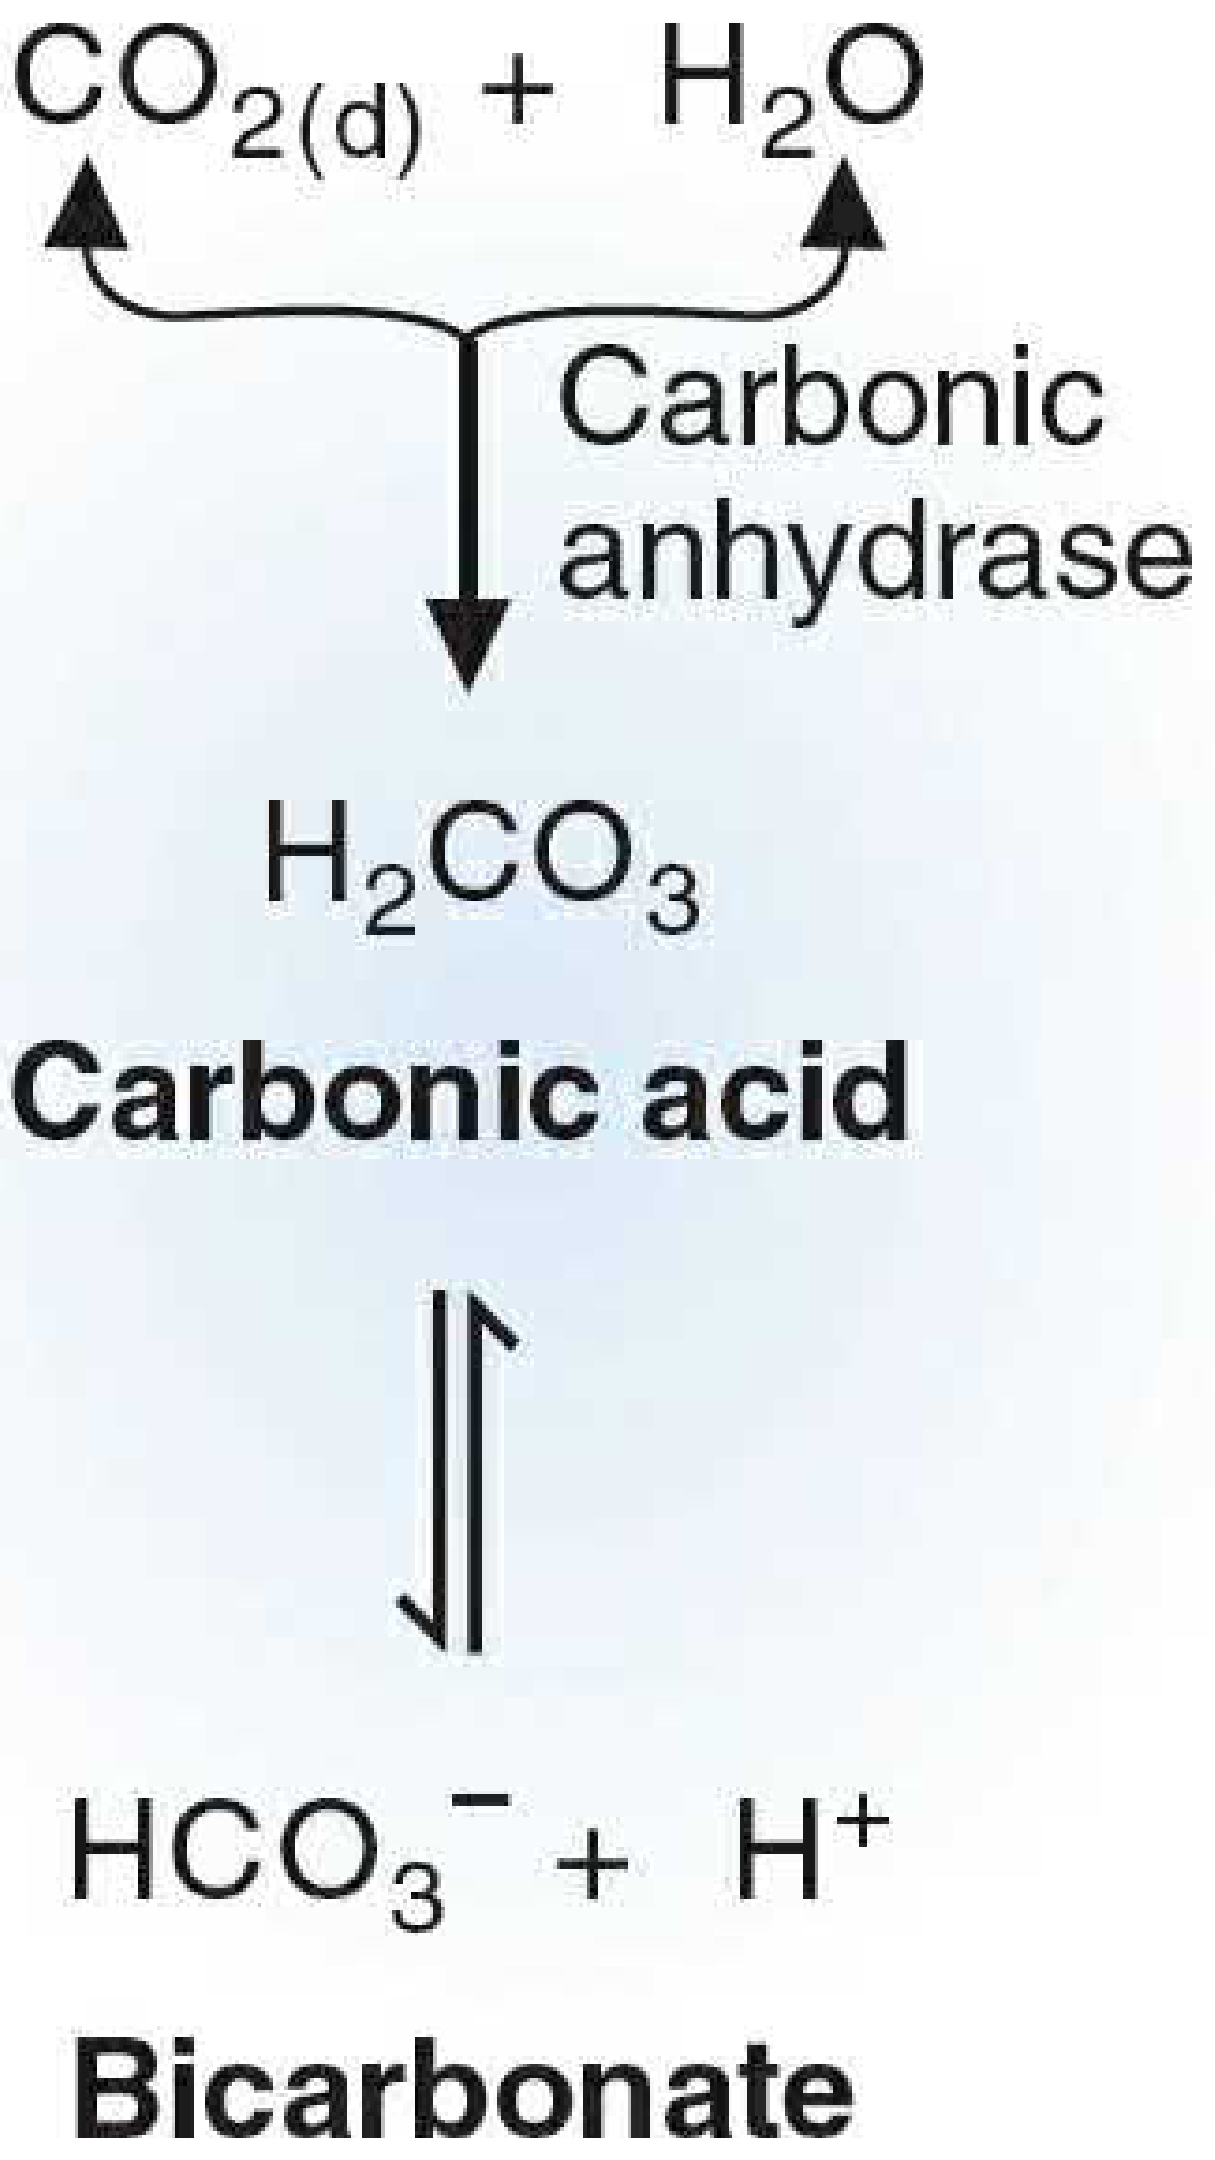
Components: H₂CO₃ (carbonic acid) / HCO₃⁻ (bicarbonate)
Reaction:
CO₂ + H₂O ⇌ H₂CO₃ ⇌ H⁺ + HCO₃⁻
When acid is added:
H⁺ + HCO₃⁻ → H₂CO₃ → CO₂ + H₂O (CO₂ exhaled by lungs)
When base is added:
OH⁻ + H₂CO₃ → HCO₃⁻ + H₂O
Why it is so effective despite a pKa of only 6.1 (far from pH 7.4):
- Present in large quantities in ECF (HCO₃⁻ ~24 mEq/L)
- The "acid" component (CO₂) is continuously produced by metabolism - inexhaustible supply
- CO₂ is a volatile acid that can be rapidly blown off by the lungs - the system is "open" and continuously regenerated
- HCO₃⁻ is regulated by the kidneys
(Mulholland & Greenfield's Surgery 7e; Basic Medical Biochemistry 6e)
2. Phosphate Buffer System
Components: H₂PO₄⁻ (dihydrogen phosphate) / HPO₄²⁻ (monohydrogen phosphate)
Reactions:
- Buffering an acid:
HCl + Na₂HPO₄ → NaH₂PO₄ + NaCl (strong acid HCl replaced by weak acid NaH₂PO₄)
- Buffering a base:
NaOH + NaH₂PO₄ → Na₂HPO₄ + H₂O (strong base NaOH replaced by weak base Na₂HPO₄)
pKa = 6.8 - closer to physiological pH than the bicarbonate system, so it operates nearer its maximum buffering power.
Roles:
| Location | Importance |
|---|---|
| Extracellular fluid | Minor - only ~8% the concentration of bicarbonate |
| Renal tubular fluid | Major role - phosphate is concentrated in tubules; lower tubular pH brings it closer to its pKa of 6.8; critical for urinary H⁺ excretion as titratable acid |
| Intracellular fluid | Important - intracellular phosphate concentration is much higher than ECF; lower intracellular pH is closer to pKa 6.8 |
(Guyton & Hall Medical Physiology)
3. Protein Buffer System - THE LARGEST INTRACELLULAR BUFFER
Proteins (including enzymes and structural proteins) are the most abundant buffers in the body due to their high intracellular concentration.
Mechanism: Proteins contain many ionizable groups - particularly the imidazole group of histidine (pKa ~6.0-7.0), which can accept or donate H⁺ near physiological pH:
Protein-NH₂ + H⁺ ⇌ Protein-NH₃⁺ (acts as base) Protein-COOH ⇌ Protein-COO⁻ + H⁺ (acts as acid)
Isohydric principle (Guyton & Hall): All buffer systems in the same solution are in equilibrium with the same H⁺ concentration. So when one buffer system shifts, all others shift simultaneously:
H⁺ = K₁ × [HA₁]/[A₁⁻] = K₂ × [HA₂]/[A₂⁻] = K₃ × [HA₃]/[A₃⁻]
This means each buffer system effectively "buffers" all the others.
4. Hemoglobin Buffer System - MOST IMPORTANT BLOOD BUFFER
Location: Inside red blood cells (RBCs)
Why hemoglobin is such a powerful buffer:
- Present in very high concentration inside RBCs
- Rich in histidine residues (imidazole groups)
- Deoxyhemoglobin is a weaker acid than oxyhemoglobin → accepts H⁺ more readily in tissues
Reaction in tissues:
H⁺ + Hb⁻ ⇌ HHb
The H⁺ generated during CO₂ hydration (bicarbonate formation) is immediately buffered by Hb:
CO₂ + H₂O → H₂CO₃ → H⁺ + HCO₃⁻ H⁺ + Hb⁻ → HHb (prevents pH from falling sharply)
Contribution to CO₂ transport: This buffering of H⁺ by Hb also forms the basis of the Haldane effect - deoxygenation of Hb in tissues allows more CO₂ to be carried as bicarbonate.
(Guyton & Hall; Basic Medical Biochemistry 6e)
5. Bone Buffer System
- More than half of total body alkaline buffer content is outside the ECF, largely in bone
- Bone mineral (calcium carbonate and calcium phosphate) can release HCO₃⁻ and phosphate to buffer chronic acidosis
- Important in chronic metabolic acidosis (e.g., renal failure) - explains why chronic acidosis causes demineralization of bone
(Mulholland & Greenfield's Surgery 7e)
LINE 2: Respiratory Regulation (Second Line of Defense - Minutes)
The lungs control PCO₂ and thus pH:
↑ H⁺ (acidosis) → ↑ respiratory rate → ↓ PCO₂ → pH rises ↓ H⁺ (alkalosis) → ↓ respiratory rate → ↑ PCO₂ → pH falls
Power: Respiratory compensation can return pH 60-75% back toward normal - it cannot fully correct pH because rising PCO₂ (from hypoventilation) itself stimulates ventilation again, preventing complete compensation.
Speed: Acts within minutes; maximally effective in 12-24 hours.
(Guyton & Hall Medical Physiology)
LINE 3: Renal Regulation (Third Line - Slowest but Most Powerful)
The kidneys are the only mechanism that can completely restore pH to normal by:
- Excreting H⁺ into tubular urine
- Regenerating HCO₃⁻ (reabsorbing filtered bicarbonate or generating new HCO₃⁻)
- Excreting titratable acid (H₂PO₄⁻ via the phosphate buffer)
- Excreting NH₄⁺ (ammonium) - ammonia combines with secreted H⁺ → NH₄⁺
Speed: Hours to days for maximal effect.
Summary Table: Buffer Systems
| Buffer System | Location | pKa | % Buffering | Key Feature |
|---|---|---|---|---|
| Bicarbonate/H₂CO₃ | ECF (plasma) | 6.1 | ~35-50% | Open system; regulated by lungs + kidneys; most important ECF buffer |
| Hemoglobin | RBCs | ~7.3 (histidine) | ~35% | Most important blood buffer overall; linked to O₂ transport |
| Proteins | ICF + plasma | ~6-7 | ~15-20% | Most plentiful by mass; histidine key residue |
| Phosphate | ICF + renal tubules | 6.8 | ~5% ECF; major ICF + renal | Critical for urinary acid excretion |
| Bone | Skeleton | - | Chronic only | Prevents chronic acidosis; demineralizes in renal failure |
Acid-Base Disorders and Compensation
| Disorder | Primary Change | Compensation |
|---|---|---|
| Metabolic acidosis | ↓ HCO₃⁻ | ↑ ventilation → ↓ PCO₂ (respiratory) |
| Metabolic alkalosis | ↑ HCO₃⁻ | ↓ ventilation → ↑ PCO₂ (respiratory) |
| Respiratory acidosis | ↑ PCO₂ | Kidneys retain HCO₃⁻ (metabolic) |
| Respiratory alkalosis | ↓ PCO₂ | Kidneys excrete HCO₃⁻ (metabolic) |
- Guyton & Hall Textbook of Medical Physiology, Ch. 31
- Basic Medical Biochemistry: A Clinical Approach 6e, Ch. 4
- Lippincott's Illustrated Reviews: Biochemistry 8e, Ch. 1
- Mulholland & Greenfield's Surgery 7e, Ch. 11
How to calculate the decrease in lung capacity / total lung capacity in a patient who is planned to undergo pneumonectomy
Predicting post-pneumonectomy lung function uses the "predicted postoperative" (PPO) formula based on the number of functional lung segments being removed. Let me pull the authoritative textbook content.
Searching sources...
Finding Sources
Finding Sources
Excellent - found dedicated content in Sabiston, Schwartz, Morgan & Mikhail, Fishman's, and Mulholland. Reading all key sections in parallel.
Reading File
Reading File
Reading File
Excellent content. Now let me get the Sabiston worked example and the Fishman's/Mulholland full algorithm details.
Reading File
Reading File
Reading File
Now let me fetch the ACCP algorithm flowchart image and get the Sabiston worked calculation example.
Loading Image
Reading File
I now have comprehensive, detailed content from five authoritative surgical and pulmonary textbooks. Here is the complete answer.
Calculating Predicted Decrease in Lung Capacity After Pneumonectomy
The goal is to calculate the predicted postoperative (PPO) lung function values - primarily ppoFEV₁ and ppoDLCO - to determine whether a patient will have adequate pulmonary reserve after removing an entire lung.
Why It Matters
After pneumonectomy, the patient lives on a single lung for the rest of their life. The key question is: will that remaining lung support life?
- A ppoFEV₁ ≤40% is associated with significantly increased risk of postoperative dependence on supplemental oxygen and/or mechanical ventilation
- Both ppoFEV₁% and ppoDLCO% <50% are associated with increased perioperative complications
- Risk increases in a stepwise fashion for every 10% decline
Step 1: Establish Baseline Pulmonary Function
Measure pre-operative spirometry and DLCO (post-bronchodilator values are used):
- FEV₁ - Forced Expiratory Volume in 1 second (most important)
- FVC - Forced Vital Capacity
- DLCO - Diffusing capacity for carbon monoxide (reflects alveolar-capillary surface area)
- TLC - Total Lung Capacity
If preoperative FEV₁ and DLCO are both ≥80% predicted and the patient has no dyspnea on exertion, the patient is cleared for pneumonectomy with no further testing needed.
Step 2: Calculate PPO Values
There are two methods depending on availability of perfusion scanning:
METHOD A: Segment Counting Method (for lobectomy; used when perfusion scan unavailable)
Based on the fact that the lungs have a known total of 42 functional segments (19 right, 23 left - or approximately 20 right, 22 left in many texts):
ppoFEV₁ = preopFEV₁ × (1 - y/z)
Where:
- y = number of functional segments to be removed
- z = total number of functional segments (obstructed/non-functional segments excluded)
Lung segment counts:
| Lung | Lobes | Segments |
|---|---|---|
| Right lung | Upper (3), Middle (2), Lower (5) | 10 segments |
| Left lung | Upper (3+2 lingula), Lower (5) | 10 segments |
| Total | ~20 total (simplified) |
Example (Schwartz's Principles of Surgery):
- Planned right lobectomy removing 3 segments, total 20 functional segments
- Patient retains (20 - 3) = 17 segments → 85% of original lung capacity remains
- If baseline FEV₁% = 30%: ppoFEV₁ = 30% × 0.85 = 25% (high risk)
- If baseline FEV₁% = 59%: ppoFEV₁ = 59% × 0.85 = 50% (acceptable)
METHOD B: Quantitative Perfusion (Q) Scan - PREFERRED FOR PNEUMONECTOMY
This is the recommended method for pneumonectomy (per ACCP guidelines). A radionuclide perfusion scan measures the fractional perfusion contribution of each lung/lobe:
ppoFEV₁ = preopFEV₁ × (1 - fraction of total perfusion going to the resected lung)
ppoDLCO = preopDLCO × (1 - fraction of total perfusion going to the resected lung)
(Morgan & Mikhail's Clinical Anesthesiology 7e; Mulholland & Greenfield's Surgery 7e)
Why Q scan? The perfusion scan directly measures how much that lung actually contributes to function - a tumor-obstructed, atelectatic lung may contribute very little perfusion, so its removal has minimal functional impact.
Worked Example (from Sabiston Textbook of Surgery)
Patient: 67-year-old male, planned left pneumonectomy
- Preoperative FEV₁ = 2.83 L predicted; measured = 2.23 L (79% predicted)
- Quantitative perfusion scan: left lung contributes 46% of total perfusion
Calculation:
ppoFEV₁ = 2.83 L × (1 - 0.46) = 2.83 × 0.54 = 1.53 L
As % predicted:
ppoFEV₁% = 79% × 0.54 = ~43% predicted
(Another Sabiston example: preop FEV₁ = 2.83L × [1 - 0.537 left perfusion fraction] = 1.31L = 46.5% predicted → functionally tolerated)
Schwartz example - Right pneumonectomy:
- Perfusion scan: right lung = 21% of total perfusion (tumor-obstructed)
- Baseline FEV₁% = 60%
- ppoFEV₁% = 60% × (1 - 0.21) = 60% × 0.79 = 47% → tolerable
- If right lung = 55% normal perfusion: ppoFEV₁% = 60% × 0.45 = 27% → high risk
Step 3: Risk Stratification Based on PPO Values
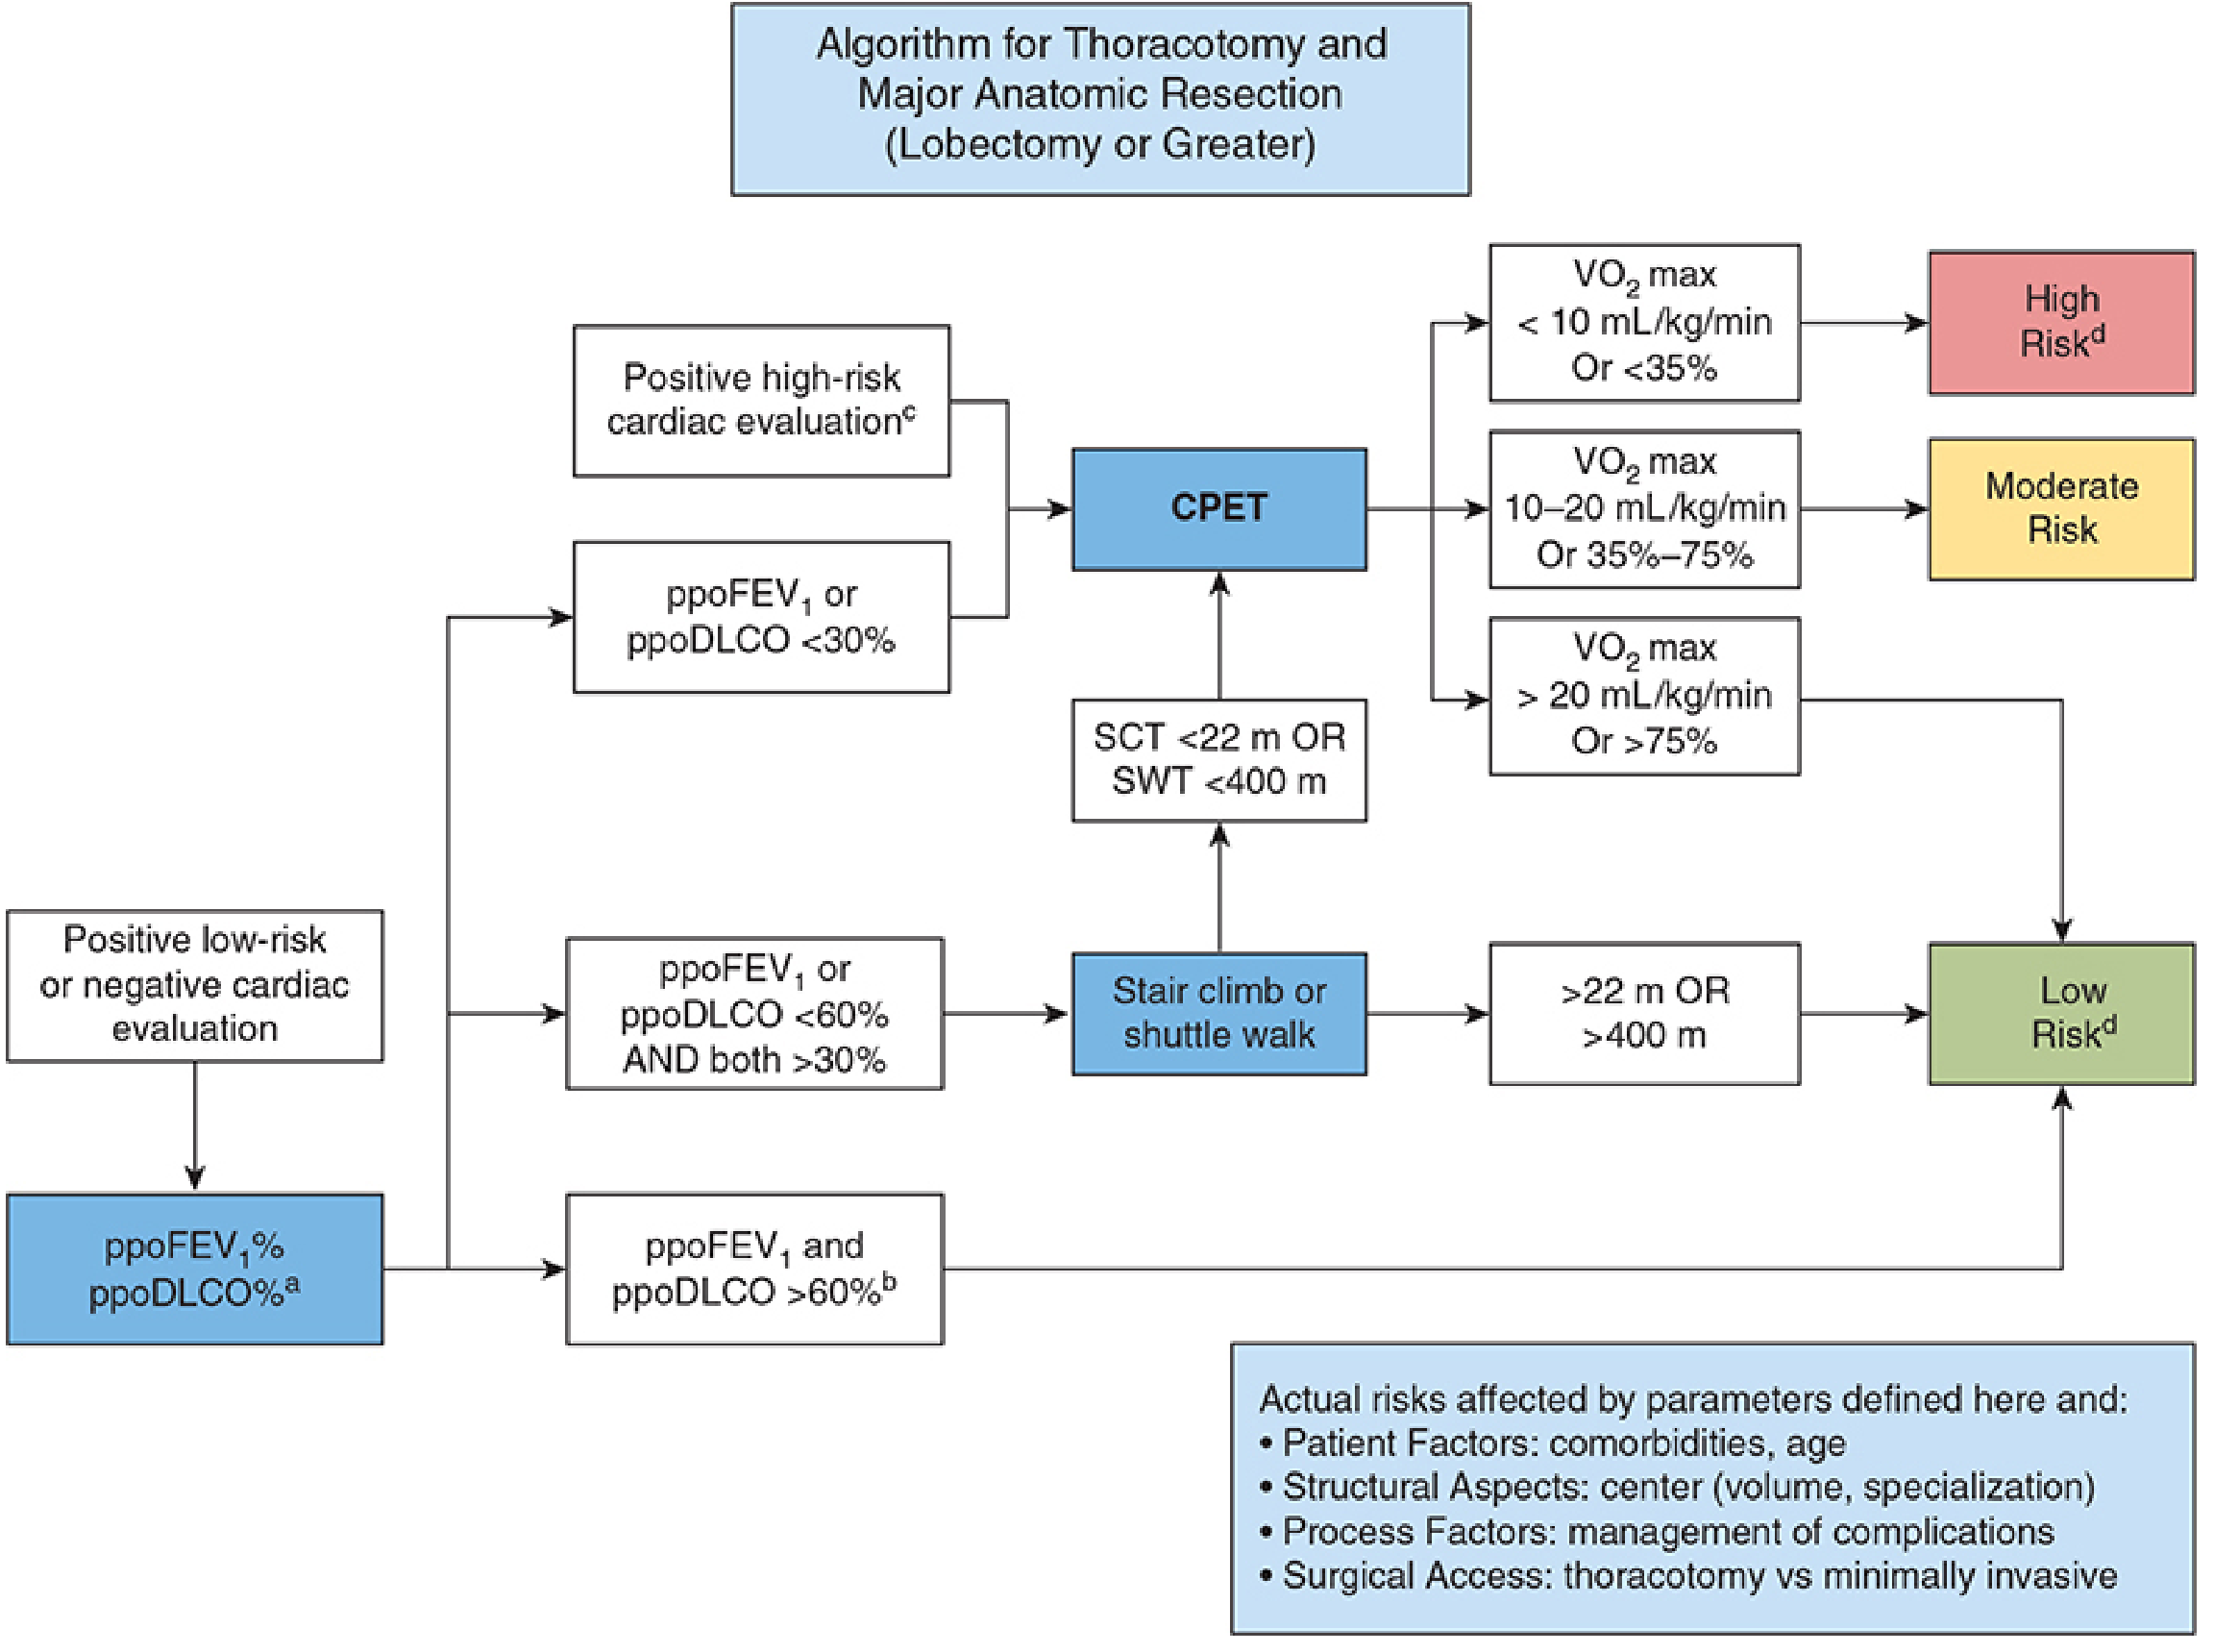
| ppoFEV₁% or ppoDLCO% | Risk Category | Action |
|---|---|---|
| Both >60% | Low risk | Cleared for pneumonectomy |
| Both ≥40% | Acceptable | Cleared; no further testing needed |
| 30-60% (either) | Moderate/Borderline | Proceed to stair climb or shuttle walk test |
| <30% (either) | High risk | Proceed to CPET; consider alternative (lobectomy/non-operative) |
Step 4: Functional Exercise Testing (if ppo values borderline)
Stair Climbing Test (SCT):
| Performance | Estimated VO₂max | Implication |
|---|---|---|
| >22 m (5 flights) | >20 mL/kg/min | Low risk |
| 12-22 m | ~15-20 mL/kg/min | Moderate risk |
| <12 m (1 flight) | <10 mL/kg/min | High risk |
Shuttle Walk Test (SWT): >400 m = low risk; <400 m → CPET needed
CPET (Gold Standard):
| VO₂max | Risk |
|---|---|
| >20 mL/kg/min (>75% predicted) | Low - proceed safely |
| 10-20 mL/kg/min (35-75%) | Moderate |
| <10 mL/kg/min (<35%) | High risk - relative contraindication |
(Fishman's Pulmonary Diseases 2-Vol Set; Barash's Clinical Anesthesia 9e)
Summary: The Complete Calculation Formula
For pneumonectomy (using Q scan - preferred):
ppoFEV₁ = preop FEV₁ × [1 - fraction of perfusion to resected lung]
ppoDLCO = preop DLCO × [1 - fraction of perfusion to resected lung]
For lobectomy (segment counting):
ppoFEV₁ = preop FEV₁ × [1 - (segments removed ÷ total functional segments)]
Key thresholds:
- ppoFEV₁ or ppoDLCO >60% = low risk, cleared
- ppoFEV₁ or ppoDLCO 40-60% = acceptable with exercise testing
- ppoFEV₁ or ppoDLCO <30% = high risk, consider alternatives
Important caveat (Morgan & Mikhail): Removal of extensively diseased, non-ventilated but perfused lung (e.g., tumor-obstructed main bronchus) does not necessarily reduce function and may actually improve oxygenation by eliminating shunt - so clinical context always matters alongside the formula.
- Sabiston Textbook of Surgery, Ch. 110
- Schwartz's Principles of Surgery 11e, Ch. 19
- Morgan & Mikhail's Clinical Anesthesiology 7e, Ch. 25
- Fishman's Pulmonary Diseases and Disorders, Ch. 102
- Mulholland & Greenfield's Surgery 7e, Ch. 14
Rapid shallow breathing index for 5 marks
The Rapid Shallow Breathing Index (RSBI) = respiratory rate / tidal volume, and a value <105 predicts successful weaning from mechanical ventilation. Let me pull the full textbook content.
Searching sources...
Finding Sources
Finding Sources
Excellent - found rich content in Miller's, Morgan & Mikhail, Washington Manual, Fischer's, Sabiston, and Mulholland. Reading all key sections in parallel.
Reading File
Reading File
Reading File
Reading File
Excellent - rich content from multiple sources. Let me get the Sabiston section and the Mulholland section for additional clinical detail and the full weaning criteria table.
Reading File
Reading File
I now have comprehensive, multi-source content. Here is the complete 5-mark answer.
Rapid Shallow Breathing Index (RSBI)
Definition
The Rapid Shallow Breathing Index (RSBI), also called the frequency-to-tidal volume ratio (f/VT), is a bedside parameter used to predict whether a mechanically ventilated patient can be successfully weaned from and extubated off the ventilator.
It was first described by Yang and Tobin (1991) and remains the most widely used and validated weaning predictor in clinical practice.
Formula
RSBI = Respiratory Rate (f) ÷ Tidal Volume (VT in litres)
RSBI = f (breaths/min) / VT (L)
Example (Fischer's Mastery of Surgery):
- RR = 20 breaths/min, VT = 500 mL (0.5 L)
- RSBI = 20 / 0.5 = 40 → low, favourable for extubation
Example of failure:
- RR = 35 breaths/min, VT = 250 mL (0.25 L)
- RSBI = 35 / 0.25 = 140 → high, predicts weaning failure
Physiological Basis
The RSBI captures the pattern of breathing during respiratory distress:
- Healthy, comfortable breathing: Patient breathes slowly with large tidal volumes → low RSBI
- Respiratory distress / muscle fatigue: Patient breathes rapidly with small tidal volumes (rapid and shallow) → high RSBI
When a patient cannot sustain adequate ventilation, the respiratory muscles fatigue and the patient compensates by increasing rate while allowing depth to fall - exactly the "rapid and shallow" pattern that elevates the RSBI. (Miller's Anesthesia 10e)
How to Measure RSBI
- Patient is placed on minimal ventilator support: either
- T-piece (disconnected from ventilator, breathing room air/O₂ through the ETT)
- CPAP 5 cm H₂O with minimal or no pressure support
- Low PSV (e.g., PSV 7 / PEEP 5) - essentially only compensating for ETT resistance
- Observe for 1-2 minutes of spontaneous breathing
- Measure respiratory rate (f) and tidal volume (VT in litres)
- Calculate RSBI = f / VT
This is typically done as part of a Spontaneous Breathing Trial (SBT) lasting 30-120 minutes.
(Morgan & Mikhail's Clinical Anesthesiology 7e; Sabiston Textbook of Surgery)
Threshold Values and Interpretation
| RSBI Value | Interpretation |
|---|---|
| <105 breaths/min/L | Predicts successful weaning and extubation (~85% success rate) |
| <100 | Criterion used by some institutions (Morgan & Mikhail Table 58-5) |
| <108 | Associated with liberation from invasive ventilation (Fischer's Surgery) |
| >105 | Accurately predicts weaning failure |
| >120 | Patient should retain mechanical ventilator support |
Key clinical point (Washington Manual):
"RSBI >105 accurately predicts weaning failure, but RSBI ≤105 is less accurate at predicting weaning success"
This means RSBI is a better rule-out tool (high RSBI = definitely not ready) than a definitive rule-in test (low RSBI = likely ready, but not guaranteed). Failure rates after extubation remain ~6-24% even with favourable RSBI.
RSBI in Context: Other Weaning Criteria
RSBI is one of several parameters assessed together before extubation:
| Parameter | Criterion for Weaning |
|---|---|
| RSBI | <100-105 breaths/min/L |
| Maximum inspiratory pressure (NIF/MIP) | More negative than -20 to -25 cm H₂O |
| Tidal volume | >5 mL/kg |
| Vital capacity | >10 mL/kg |
| Minute ventilation | <10 L/min |
| Respiratory rate | <25-30 breaths/min |
| FiO₂ | <0.5 with SpO₂ >90% |
| PEEP | ≤5 cm H₂O |
| pH | >7.25 (at patient's baseline) |
| Mental status | Awake, alert, able to cooperate |
| Haemodynamic stability | No vasopressors or signs of myocardial ischaemia |
(Morgan & Mikhail's Clinical Anesthesiology 7e, Table 58-5; Washington Manual of Medical Therapeutics)
Prerequisites Before Measuring RSBI
Before performing an SBT and measuring RSBI, the underlying cause of respiratory failure must be addressed:
- Reversal or control of the precipitating illness
- Treatment of bronchospasm, infection, heart failure
- Correction of acid-base disorders, anaemia
- Adequate nutrition (malnutrition → respiratory muscle wasting)
- Adequate analgesia and sedation interruption
- Intact airway reflexes (cough, gag) and ability to handle secretions
Limitations of RSBI
- Moderate sensitivity, poor specificity - a recent meta-analysis (cited in Sabiston) found only moderate sensitivity and poor specificity across a variety of cutoff values
- Affected by sedation - sedation reduces respiratory drive and artificially lowers RSBI
- Does not assess airway protection - a patient can have a low RSBI but still fail extubation due to inability to clear secretions, aspiration risk, or stridor from laryngeal oedema
- ETT size matters - smaller ETTs impose more resistance; low-level PSV used to compensate may affect the measured VT
- Not superior to clinical judgement - newer aids (lung ultrasound, diaphragm thickening fraction, age, maximal inspiratory pressure) have been studied but none is clearly better than RSBI
Newer Adjuncts to RSBI
- Diaphragm thickening fraction (DTF) on ultrasound combined with RSBI improves weaning prediction accuracy
- Lung ultrasound - aeration score before and after SBT helps identify patients at risk for post-extubation respiratory failure
- Cuff leak test - absence of cuff leak after ETT cuff deflation suggests laryngeal oedema; preclude extubation and treat with IV corticosteroids for 12-24 hours
Summary (5 Marks)
| Point | Content |
|---|---|
| 1. Definition | RSBI = f (RR) / VT (L); ratio of respiratory rate to tidal volume; introduced by Yang and Tobin 1991 |
| 2. Measurement | Measured during T-piece or CPAP/minimal PSV trial (SBT); after sedation hold and reversal of precipitating illness |
| 3. Threshold | RSBI <105 predicts successful extubation; RSBI >105 predicts failure; >120 = retain ventilator support |
| 4. Physiology | Respiratory muscle fatigue → rapid shallow breathing (↑RR, ↓VT) → high RSBI; comfort → slow deep breathing → low RSBI |
| 5. Limitations | Better at ruling out readiness than confirming it; affected by sedation; does not assess airway protection; used alongside other criteria (NIF, VT, FiO₂, haemodynamics) |
- Morgan & Mikhail's Clinical Anesthesiology 7e, Ch. 58
- Miller's Anesthesia 10e, Ch. on Weaning
- Sabiston Textbook of Surgery, Ch. on Critical Care
- Washington Manual of Medical Therapeutics
- Fischer's Mastery of Surgery 8e
- Mulholland & Greenfield's Surgery 7e
NAVA
NAVA (Neurally Adjusted Ventilatory Assist) is a mode of mechanical ventilation that uses the electrical activity of the diaphragm (Edi) to trigger and proportionally control ventilator support. Let me pull the full textbook content.
Searching sources...
Finding Sources
Finding Sources
Good - found content in Murray & Nadel, Goldman-Cecil, and Miller's. Reading the key sections in parallel.
Reading File
Reading File
Good foundation content. Let me now search for deeper NAVA content including the Edi catheter, NAVA level, patient-ventilator interaction, and clinical applications.
Finding Sources
Finding Sources
Let me search specifically for the patient-ventilator interaction and NAVA clinical details sections in Murray & Nadel.
Finding Sources
Reading File
Let me read the Innovations in Mechanical Ventilatory Support section and the PAV/NAVA section from Murray & Nadel, and also the patient-ventilator dyssynchrony content.
Reading File
Reading File
Reading File
I now have comprehensive content from Murray & Nadel, Goldman-Cecil, and Miller's. I have enough for a thorough answer covering all key aspects of NAVA.
Neurally Adjusted Ventilatory Assist (NAVA)
Definition
NAVA (Neurally Adjusted Ventilatory Assist) is an innovative mode of mechanical ventilation in which the ventilator delivers inspiratory pressure in direct proportion to the electrical activity of the diaphragm (Edi) - the neural signal from the respiratory centre that drives breathing. It was developed by Christer Sinderby and colleagues and represents a fundamentally different triggering and control paradigm compared to conventional modes.
The Core Problem NAVA Solves: Patient-Ventilator Dyssynchrony
In conventional ventilator modes (pressure support, volume control, SIMV):
- The ventilator is triggered by pressure or flow changes in the circuit
- This creates a time lag between neural inspiration and ventilator response
- The delivered pressure/volume is independent of patient effort - too much support during weak effort, too little during strong effort
- This mismatch is called patient-ventilator dyssynchrony and occurs during all three phases: triggering, flow delivery, and breath cycling
- Dyssynchrony causes discomfort, increases sedation requirements, and may contribute to ventilator-induced lung injury (VILI) and diaphragm injury
NAVA specifically addresses all three phases of this dyssynchrony. (Murray & Nadel's Respiratory Medicine 2-Vol Set)
How NAVA Works - The Mechanism
Step 1: The Edi Catheter
- A specially modified nasogastric tube is placed into the oesophagus (positioned near the gastro-oesophageal junction)
- It contains miniaturised EMG electrodes that detect the electrical activation of the diaphragmatic crura (the neural signal travelling from the brainstem via the phrenic nerve to the diaphragm)
- This signal is the Edi (electrical activity of the diaphragm)
Step 2: Signal Processing
- The raw EMG signal is filtered, amplified, and processed by the ventilator
- The Edi signal waveform is continuous - it rises with each inspiratory effort and falls at end-inspiration
Step 3: Pressure Delivery
Paw (airway pressure) = NAVA Level × Edi (μV) + PEEP
- The ventilator triggers as soon as the Edi signal rises above a threshold (neural trigger)
- It delivers pressure proportional to the magnitude of the Edi signal throughout inspiration
- It cycles off when the Edi signal falls (typically to 70% of peak Edi)
- The clinician sets the NAVA Level (cmH₂O/μV) - the proportionality gain between Edi and delivered pressure
The result: as the patient breathes harder (larger Edi), the ventilator provides more support; as effort decreases, support decreases automatically.
Key Features and Terminology
| Term | Meaning |
|---|---|
| Edi | Electrical activity of the diaphragm (μV); the neural respiratory drive signal |
| Edi catheter | Modified NG tube with EMG electrodes positioned at crura level |
| NAVA Level | Gain factor set by clinician (cmH₂O/μV) - determines how much pressure per unit Edi |
| Edi trigger | Neural triggering threshold (default ~0.5 μV above baseline) |
| Edi peak | Maximum Edi per breath - reflects respiratory demand |
| Edi min | Tonic/resting Edi - reflects intrinsic PEEP or tonic drive |
| Backup ventilation | Safety mode (pressure control/pressure support) if Edi signal is lost or unstable |
Advantages of NAVA Over Conventional Modes
| Advantage | Mechanism |
|---|---|
| Superior patient-ventilator synchrony | Neural triggering eliminates the pressure/flow trigger delay; cycling synchronises with neural expiration |
| Proportional assist | Delivered pressure scales with effort - prevents both under- and over-assist |
| Preserved tidal volume variability | Breath-to-breath VT variation (as in normal breathing) - may have lung-protective benefits |
| Reduced need for sedation | Better synchrony → less discomfort → lower sedation requirements |
| Overcomes auto-PEEP trigger failure | Neural trigger works even when intrinsic PEEP makes flow/pressure triggering difficult (e.g., COPD, severe asthma) |
| Diaphragm monitoring | Edi waveform provides continuous real-time assessment of respiratory drive and effort |
| Self-limiting assist | Patient's own neural feedback regulates VT - reduces risk of over-distension (VILI) |
| Applicable noninvasively (NIV-NAVA) | Can be used with face mask or helmet NIV |
(Murray & Nadel; Goldman-Cecil Medicine)
Comparison: NAVA vs. Pressure Support Ventilation (PSV)
| Feature | PSV | NAVA |
|---|---|---|
| Trigger | Pressure/flow change in circuit | Neural (Edi) signal |
| Trigger delay | 50-300 ms | Near zero (neural) |
| Delivered pressure | Fixed preset level | Proportional to Edi |
| Cycling | When flow drops to % of peak | When Edi falls to 70% of peak |
| Effect of auto-PEEP | May cause missed triggers | Not affected |
| Response to effort change | None - fixed pressure | Automatic increase/decrease |
| VT variability | Low | High (preserves natural variability) |
| Sedation requirement | Higher | Lower |
Limitations and Concerns
- Signal instability: The Edi catheter can move within the oesophagus, causing artefactual changes in signal amplitude - all NAVA patients need careful monitoring and a backup ventilation mode must always be active
- Low respiratory drive: Since NAVA provides no minimum flow/pressure, it cannot support patients with absent or very weak respiratory drive (e.g., heavy sedation, neuromuscular disease, brainstem injury) - PAV has the same limitation
- NAVA Level titration: There is no established consensus on the optimal NAVA level for different clinical scenarios - titration remains partly empirical
- Limited RCT evidence: The single major randomized controlled trial published (Kacmarek et al., 2020, Intensive Care Med) found no benefit from NAVA compared to PSV in acute respiratory failure patients, despite improved synchrony metrics
- Availability: Not available on all ventilators; requires specific Edi catheter equipment
- Cardiac EMG interference: Cardiac electrical activity can occasionally auto-trigger NAVA (reported in case reports)
(Murray & Nadel 2-Vol Set; Goldman-Cecil Medicine; Miller's Anesthesia 10e)
Clinical Applications
| Setting | Notes |
|---|---|
| ARDS / Acute respiratory failure | RCT showed no outcome benefit vs. PSV (Kacmarek 2020); may reduce VILI through VT variability |
| COPD exacerbation | Neural triggering overcomes auto-PEEP trigger failure |
| Weaning from mechanical ventilation | Edi monitoring guides readiness; NAVA may reduce sedation and shorten weaning |
| Paediatrics / Neonates | Particularly valuable - smaller infants have greater trigger delays with conventional modes; Edi catheter available in paediatric sizes |
| NIV (Non-invasive NAVA) | Helmet NIV with NAVA improves synchrony (helmet interface creates compliance that worsens conventional triggering) |
| Tetanus, agitation | Case reports of improved synchrony in patients with unstable diaphragmatic electrical activity |
Edi as a Monitoring Tool (Separate from NAVA)
Even without using NAVA mode, the Edi catheter can be placed purely for monitoring:
- Edi peak rising over time → increasing respiratory load/distress → early warning of impending failure
- Edi min elevated → auto-PEEP present → guide PEEP titration
- Edi absent during weaning → patient may be over-supported → reduce support
- Neuro-ventilatory efficiency (NVE) = VT/Edi - assesses how much volume is generated per unit of neural effort
Summary
| Key Point | Detail |
|---|---|
| What | Ventilation mode using diaphragm EMG (Edi) to trigger and proportionally control pressure delivery |
| How | Paw = NAVA Level × Edi + PEEP; Edi catheter via NG route detects crural diaphragm EMG |
| Why | Eliminates trigger delay; proportional assist; synchrony in all 3 phases; preserves VT variability |
| Advantage over PSV | No trigger delay; auto-adapts to effort; works with auto-PEEP; less sedation |
| Limitations | Signal instability; needs backup mode; no benefit shown in RCT vs PSV; not universal availability |
| Best applications | Difficult synchrony (COPD, ARDS), paediatrics/neonates, NIV with helmet, weaning |
- Murray & Nadel's Textbook of Respiratory Medicine 2-Vol Set, Ch. 135
- Goldman-Cecil Medicine International Edition, Ch. on Mechanical Ventilation
- Miller's Anesthesia 10e
Stellate ganglion block
The stellate ganglion is the fused inferior cervical and first thoracic sympathetic ganglion; its block interrupts sympathetic supply to the head, neck, upper limb, and heart. Let me pull the full textbook content.
Searching sources...
Finding Sources
Finding Sources
Excellent - found dedicated sections in Miller's, Morgan & Mikhail, Bradley & Daroff, and Barash. Reading all in parallel.
Reading File
Reading File
Reading File
Excellent content from three sources. Let me now get the complications, the signs of successful block, and fetch the anatomy diagram.
Reading File
Loading Image
Loading Image
I now have comprehensive content with the anatomy diagram. Here is the complete answer.
Stellate Ganglion Block (SGB)
1. Anatomy of the Stellate Ganglion
The stellate ganglion (cervicothoracic ganglion) is formed by the fusion of the inferior cervical ganglion and the first thoracic sympathetic ganglion - this fusion is present in approximately 80% of individuals.
Location:
- Lies anterior to the longus colli muscle
- Posterior to the origin of the vertebral artery from the subclavian artery
- Anterior to the first rib and the transverse process of C7
- Anteromedial to the scalene muscles
- Medial to the carotid sheath
- At the level of the C7 vertebral body (though injection is typically performed at C6 for safety)
Sympathetic territories supplied:
- Ipsilateral head and neck
- Ipsilateral upper extremity (including T1 contribution)
- Upper thoracic viscera (heart, great vessels, lungs)
- Note: T2-T3 sympathetic fibres to the arm may travel via Kuntz nerves joining the brachial plexus in the axilla - these can be missed by a stellate block but not by an axillary block
(Morgan & Mikhail's Clinical Anesthesiology 7e)
2. Anatomy Diagram
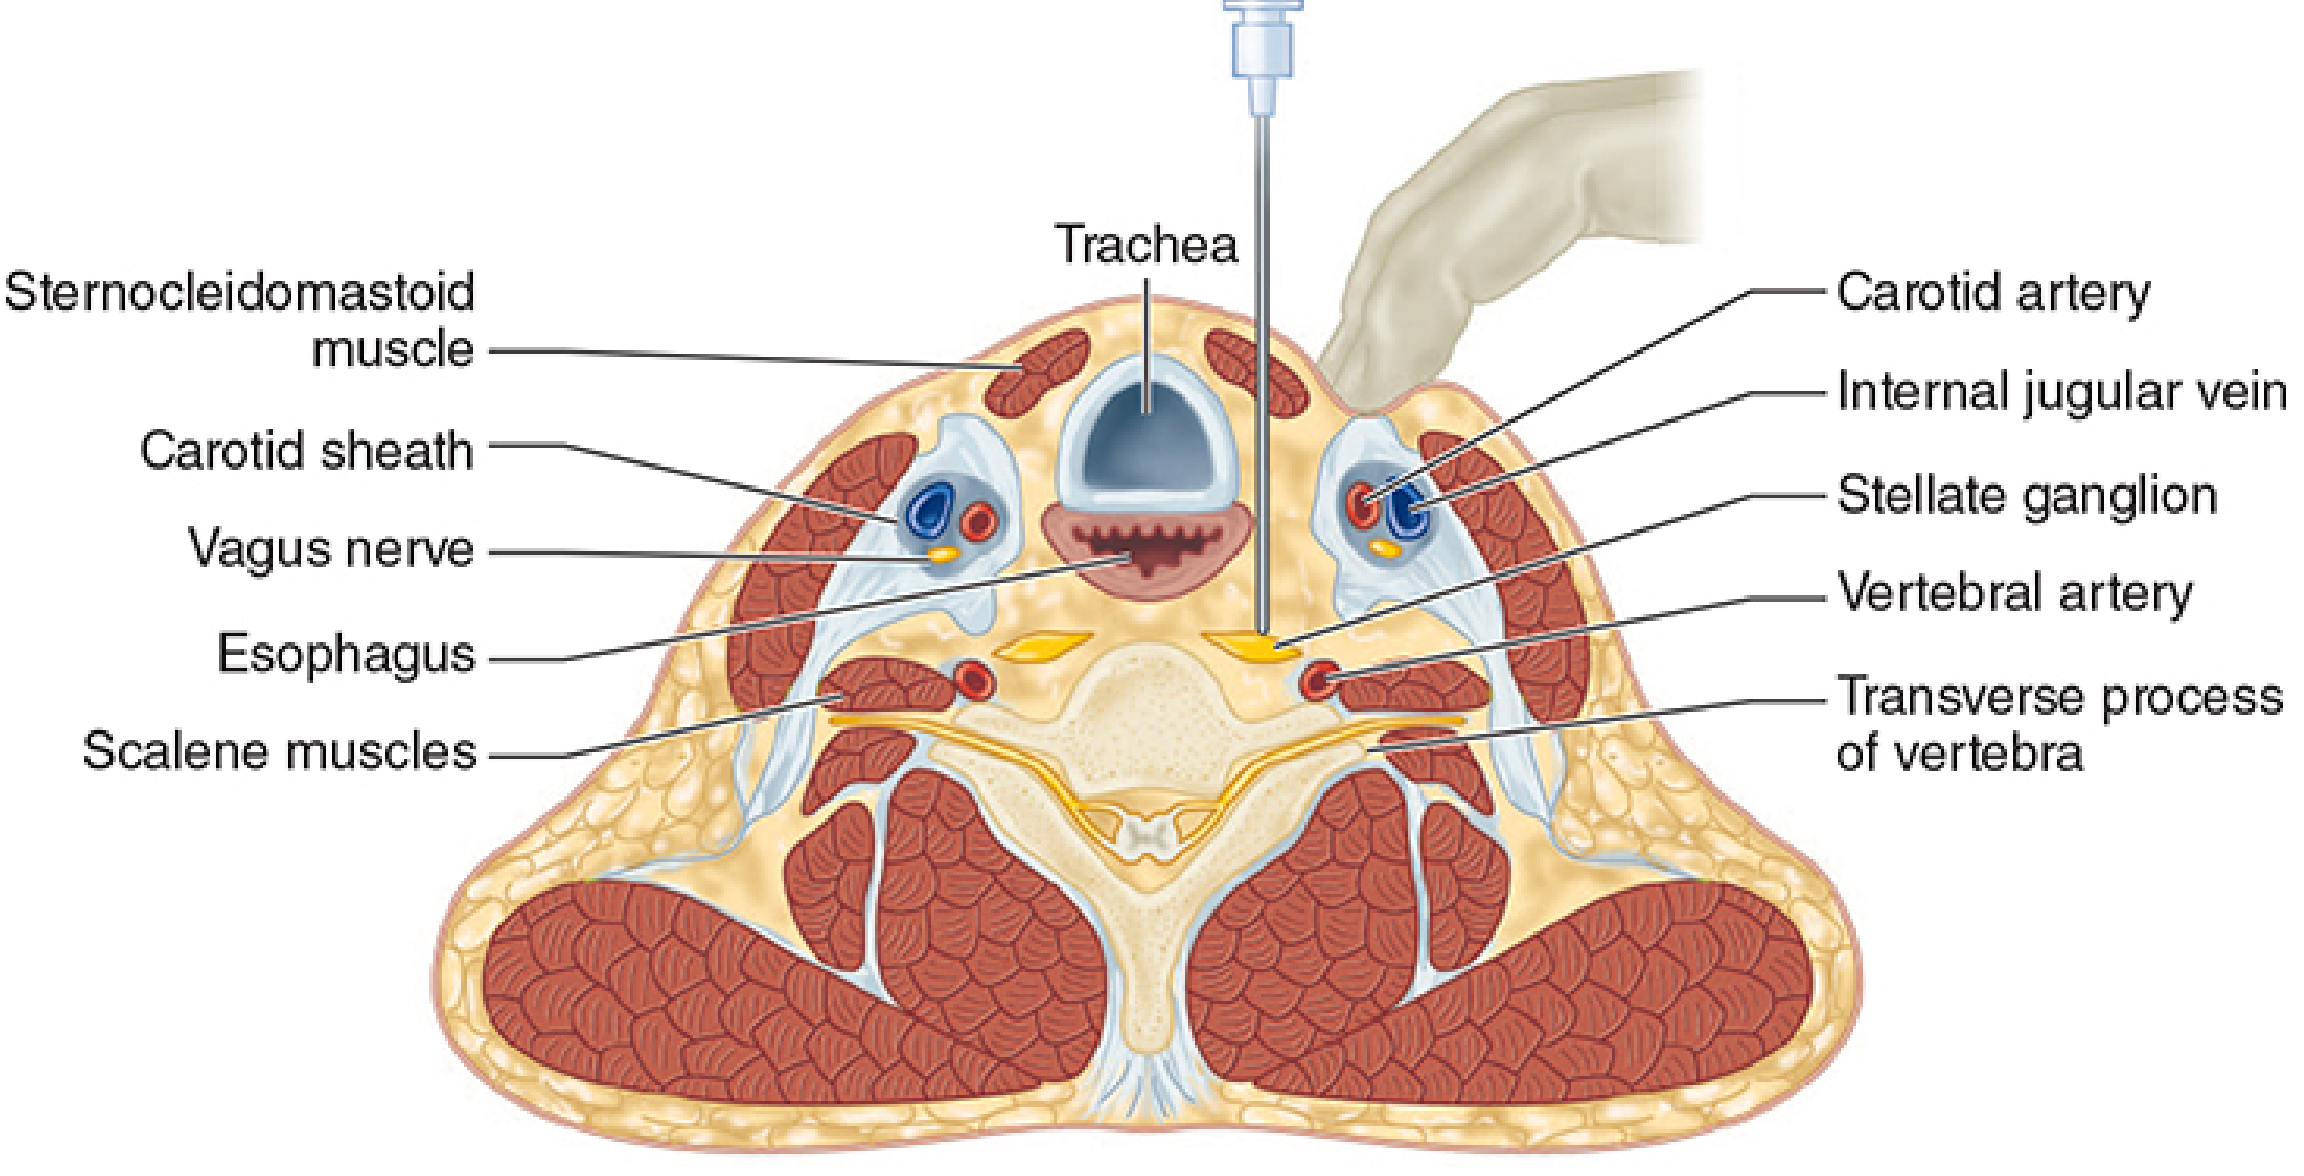
FIGURE: Stellate ganglion block - cross-section showing ganglion posterior to carotid sheath, anterior to transverse process, with needle inserted paratracheal medial to SCM. (Morgan & Mikhail's Clinical Anesthesiology 7e)
3. Indications
Pain indications:
- Complex Regional Pain Syndrome (CRPS) Type I and II affecting the head, neck, and upper extremities - primary indication; may even reverse early-stage CRPS I
- Acute herpes zoster (shingles) involving head, neck, upper limb - pain relief and possibly reduces risk of postherpetic neuralgia
- Postherpetic neuralgia
- Cancer pain of head, neck, and upper extremity
Vascular indications:
- Peripheral vascular disease and vasospastic disorders of the upper extremity (Raynaud's phenomenon, obliterative arterial disease)
- Vascular insufficiency of the arm - improves blood flow by blocking vasoconstrictor tone
Cardiac:
- Refractory ventricular tachycardia (VT) / ventricular arrhythmias - particularly left stellate ganglion block for long-QT syndrome-associated VT (left SGB reduces cardiac sympathetic drive)
- Electrical storm (recurrent refractory VT)
Other:
- Post-traumatic stress disorder (PTSD) - emerging indication; reduces sympathetic nervous system hyperactivity
- Severe vasomotor symptoms associated with menopause (hot flushes)
- Hyperhidrosis of the face, head, neck
(Morgan & Mikhail; Miller's Anesthesia 10e; Bradley & Daroff's Neurology)
4. Contraindications
| Absolute | Relative |
|---|---|
| Patient refusal | Coagulopathy / anticoagulation |
| Local infection at injection site | Contralateral phrenic nerve palsy (bilateral block risks bilateral phrenic palsy) |
| Allergy to local anaesthetic | Previous neck surgery or irradiation |
| — | Contralateral pneumothorax |
| — | Glaucoma (miosis may confound monitoring) |
5. Technique
Patient Positioning
- Supine, neck hyperextended, head turned slightly to contralateral side
- IV access mandatory; resuscitation equipment available
Landmark (Paratracheal) Technique - C6 Level (Traditional)
- Identify Chassaignac's tubercle - the anterior tubercle of the C6 transverse process (at level of cricoid cartilage, ~3 cm above clavicle)
- Retract the sternocleidomastoid muscle and carotid sheath laterally with the non-operative hand to displace carotid artery away from midline
- Insert a 22-gauge, 4-5 cm needle at the medial edge of SCM, perpendicular to skin, advancing to the transverse process of C6
- Withdraw needle 2-3 mm (to come off the transverse process/longus colli) before injection
- Aspirate in two planes to exclude intravascular placement
- Inject 1 mL test dose first - observe for intravascular signs (tachycardia, metallic taste, dizziness)
- Inject 5-10 mL of local anaesthetic (e.g., 0.25-0.5% bupivacaine or 1-1.5% lignocaine)
Why C6 preferred over C7:
- At C7, the vertebral artery has already entered the transverse foramen - risk of vertebral artery puncture is higher
- At C6, the vertebral artery is still lateral and protected in the foramen
Ultrasound-Guided Technique (Preferred)
- Linear probe placed transversely over cricoid cartilage, moved laterally until C6 transverse process (Chassaignac tubercle) is visualised
- Identify: carotid artery, internal jugular vein, longus colli muscle, and the tubercle
- In-plane needle approach from lateral to medial
- Target: medial to Chassaignac tubercle, anterior to the prevertebral fascia (on the longus colli muscle surface)
- Test dose 1 mL after negative aspiration, then 4-5 mL total
- Ultrasound visualises local anaesthetic spread in the correct fascial plane
(Morgan & Mikhail's Clinical Anesthesiology 7e)
6. Signs of Successful Block - Horner's Syndrome
Correct block is confirmed by the appearance of Horner's syndrome on the ipsilateral side (within 5-10 minutes):
| Sign | Mechanism |
|---|---|
| Ptosis (drooping upper eyelid) | Loss of sympathetic to superior tarsal (Müller's) muscle |
| Miosis (pupil constriction) | Loss of pupillary dilator tone |
| Enophthalmos (sunken eye) | Loss of smooth muscle in eyelid |
| Anhydrosis (loss of sweating) | Face, neck, ipsilateral arm |
| Nasal congestion | Vasodilation of nasal mucosa |
| Flushing and warmth of ipsilateral face and arm | Cutaneous vasodilation from sympathetic blockade |
| ↑ skin temperature of ipsilateral hand | Vasodilation - objective measure of success |
Horner's syndrome confirms cervical sympathetic block but does not guarantee adequate thoracic sympathetic block of the upper extremity.
7. Complications
| Complication | Mechanism | Notes |
|---|---|---|
| Intravascular injection | Into carotid or vertebral artery | Seizures, cardiovascular collapse, loss of consciousness; most feared |
| Subarachnoid/epidural injection | Needle enters dural sleeve around nerve root | Total spinal anaesthesia, respiratory arrest |
| Pneumothorax | Apical pleura puncture | Higher risk with C7 or posterior approach |
| Haematoma | Carotid, jugular, vertebral artery puncture | Risk of airway compression |
| Recurrent laryngeal nerve block | Local anaesthetic spread | Hoarseness, temporary |
| Phrenic nerve block | Spread to C3-C5 roots | Diaphragmatic weakness - dangerous if contralateral phrenic palsy |
| Brachial plexus block | Spread laterally | Motor/sensory block of arm |
| Oesophageal puncture | Left-sided approach | Risk of mediastinitis, oesophageal fistula |
| Horner's syndrome | Intended effect - may be unwanted | Miosis can mask neurological assessment |
| Bilateral block | Bilateral procedure | Should never be done simultaneously |
Most dangerous: Intra-arterial injection into the vertebral artery - very small volumes (0.5 mL) of local anaesthetic can cause immediate seizure and cardiovascular collapse due to proximity to brainstem.
(Bradley & Daroff; Morgan & Mikhail)
8. Agents Used
| Agent | Concentration | Volume | Duration |
|---|---|---|---|
| Lignocaine (lidocaine) | 1-1.5% | 5-10 mL | 1-3 hours |
| Bupivacaine | 0.25-0.5% | 5-10 mL | 8-12 hours |
| Ropivacaine | 0.2-0.5% | 5-10 mL | 8-12 hours |
- For neurolytic (permanent) blocks: phenol or alcohol (rarely used)
- For cardiac arrhythmia emergencies: faster-onset agents (lignocaine) preferred
9. Summary Table
| Feature | Detail |
|---|---|
| Structure | Fused inferior cervical + T1 sympathetic ganglia |
| Location | Anterior to longus colli, posterior to vertebral artery, C7 level |
| Main indications | CRPS head/neck/arm, herpes zoster, VT/long-QT, vascular insufficiency, PTSD, hot flushes |
| Injection site | C6 transverse process (Chassaignac's tubercle), paratracheal |
| Volume | 5-10 mL local anaesthetic |
| Sign of success | Ipsilateral Horner's syndrome + warm hand |
| Dangerous complication | Vertebral/carotid artery injection → seizure/cardiac arrest; subarachnoid injection → total spinal |
| Guidance | Fluoroscopy or ultrasound strongly recommended |
- Morgan & Mikhail's Clinical Anesthesiology 7e, Ch. 47
- Miller's Anesthesia 10e, Ch. 74
- Bradley & Daroff's Neurology in Clinical Practice, Ch. 52
Post herpetic neuralgia
Postherpetic neuralgia (PHN) is persistent neuropathic pain lasting >3 months after acute herpes zoster (shingles), caused by nerve damage from varicella-zoster virus reactivation. Let me pull the full textbook content.
Searching sources...
Finding Sources
Finding Sources
Your credits are exhausted. You can purchase a top-up or subscribe to a plan to continue using Orris. If you're already subscribed, your daily credits will reset tomorrow.
This is a shared conversation. Sign in to Orris to start your own chat.