
pericardial diseases
"pericardial disease" OR "pericarditis"
pericardial effusion cardiac tamponade echocardiogram
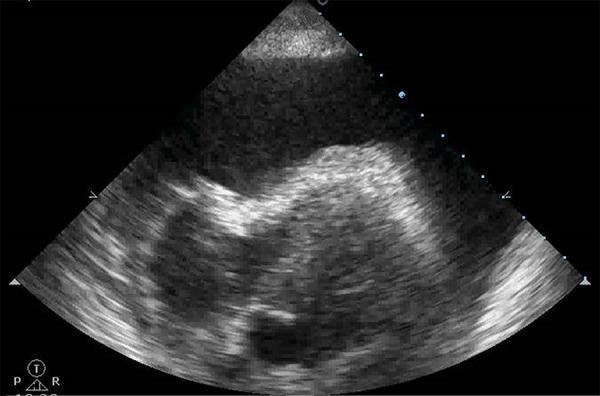
This diagnostic image is a transthoracic echocardiogram (ultrasound) in a subcostal or apical view, demonstrating a large pericardial effusion leading to cardiac tamponade. The most prominent feature is a significant, echo-free (anechoic to hypoechoic) space surrounding the cardiac structures, which represents fluid accumulation within the pericardial sac. Centrally, the heart appears relatively small or compressed within this large volume of fluid. The ultrasound shows the characteristic grayscale appearance of the myocardium and endocardium, though the cardiac chambers are obscured by the surrounding effusion. Clinically, this visual finding is pathognomonic for cardiac tamponade when associated with hemodynamic instability, as the intrapericardial pressure exceeds intracardiac filling pressure, compromising cardiac output. This image serves as a critical educational tool for emergency physicians and cardiologists in identifying life-threatening obstructive shock through point-of-care ultrasound (POCUS).
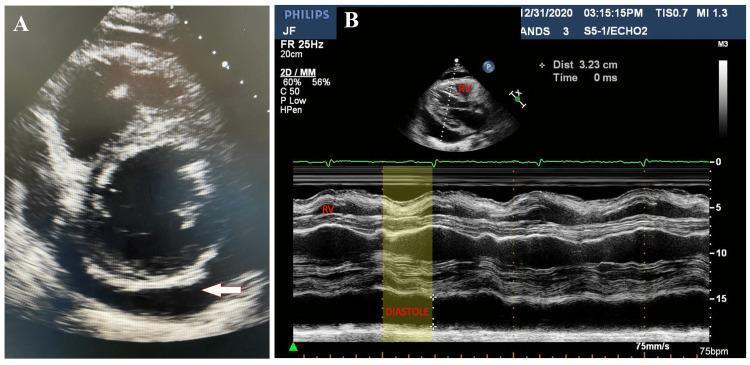
Two-panel echocardiographic study demonstrating pericardial effusion and signs of cardiac tamponade. Panel A shows a 2D transthoracic echocardiogram in a parasternal short-axis view at the basal level of the left ventricle. A large, anechoic (dark) space representing a circumferential pericardial effusion is visible surrounding the cardiac structures; a white arrow specifically highlights the posterior fluid collection. Panel B displays an M-mode echocardiogram with a simultaneous EKG trace. A yellow-shaded region highlights early diastolic collapse of the right ventricular (RV) free wall, a critical diagnostic indicator of increased intrapericardial pressure leading to hemodynamic compromise. The imagery illustrates key pathophysiological findings of cardiac tamponade, specifically the inward motion of the right ventricular wall during diastole when ventricular pressure is lowest, caused by the external pressure of the large effusion.
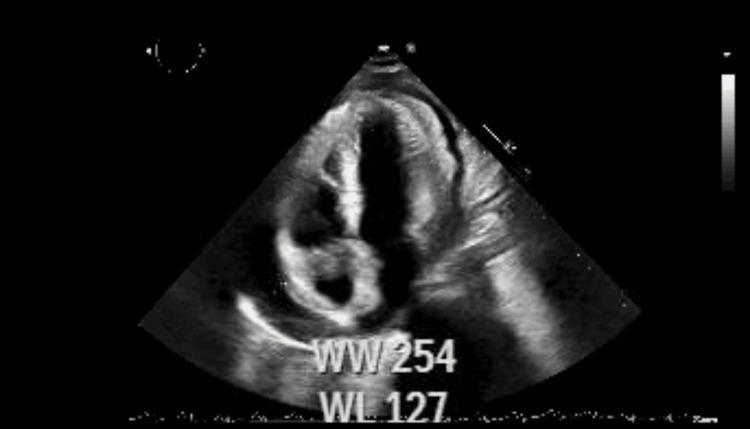
A diagnostic echocardiogram in the apical four-chamber view showing the early hemodynamic signs of cardiac tamponade. The image demonstrates a small-to-moderate circumferential pericardial effusion, visible as an anechoic (dark) space between the hyperechoic pericardium and the epicardium. Key clinical findings include visible compression and diastolic collapse of the right heart chambers, particularly the right atrium and right ventricle, due to increased intrapericardial pressure. There is evidence of abnormal septal motion, often associated with pericardial constriction or tamponade physiology. The overall cardiac silhouette appears slightly distorted by the external fluid pressure. This diagnostic image is intended for intermediate to advanced medical learners to illustrate the pathophysiology of obstructive shock secondary to pericardial effusion and the importance of echocardiography in identifying early signs of cardiac tamponade.
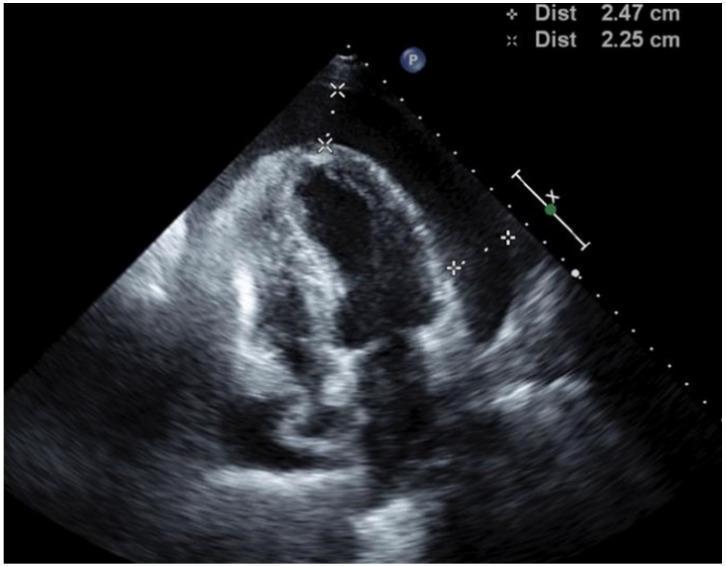
Diagnostic Image: This transthoracic echocardiogram (TTE) in a four-chamber view illustrates a large, circumferential pericardial effusion, visible as a prominent echo-free (anechoic) space surrounding the myocardium. The maximum depth of the effusion is quantified by calipers measuring 2.47 cm and 2.25 cm. Key hemodynamic findings indicative of cardiac tamponade are present, specifically the inward invagination and diastolic collapse of the right atrium and right ventricle. These visual signs suggest that intrapericardial pressure exceeds the filling pressures of the right-sided heart chambers. The image provides critical diagnostic evidence for urgent clinical intervention, such as pericardiocentesis. The educational focus is on identifying sonographic markers of tamponade physiology in the context of oncological complications, such as metastatic adenocarcinoma of the lung.
ECG pericarditis diffuse ST elevation saddle shaped PR depression
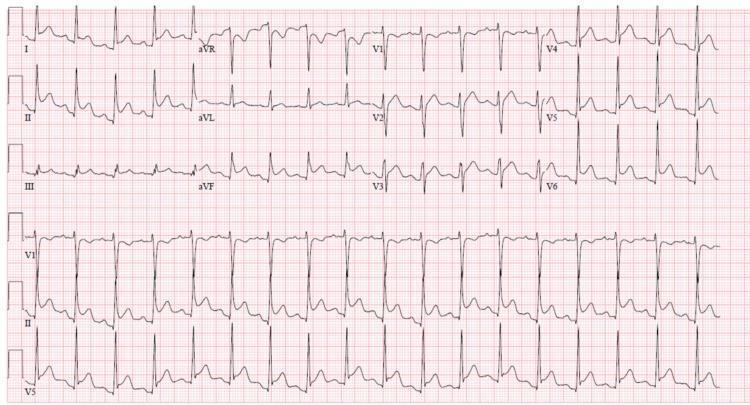
A standard 12-lead electrocardiogram (ECG) demonstrating findings characteristic of acute pericarditis. The tracing shows diffuse, concave 'saddle-shaped' ST-segment elevation across multiple leads, including I, II, III, aVF, and V2 through V6. Conversely, lead aVR displays reciprocal ST-segment depression. A notable diagnostic feature present is PR-segment depression, most clearly visualized in lead II, while lead aVR shows reciprocal PR-segment elevation. Additionally, the TP segments exhibit a subtle downward slope (Spodick's sign) in several leads. The heart rhythm is sinus tachycardia, consistent with a systemic inflammatory process. These combined visual features—diffuse ST elevation and PR segment changes—are classic indicators used to differentiate pericarditis from localized ST-elevation myocardial infarction (STEMI).
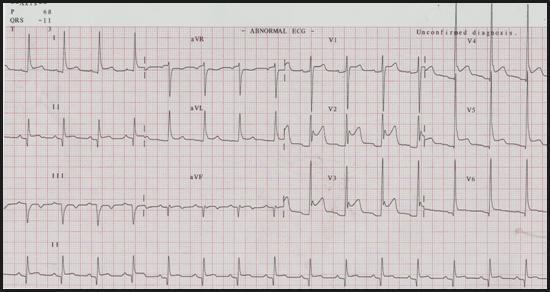
This diagnostic image is a standard surface 12-lead electrocardiogram (ECG) demonstrating several pathological findings. The primary abnormality is a diffuse ST-segment elevation with a concave or 'saddle-shaped' morphology, most prominent in the precordial leads V1-V5, as well as the high lateral leads I and aVL. Accompanying these changes is widespread PR-segment depression, particularly visible in the limb leads, which is a classic indicator of pericardial inflammation. In the inferior leads (II, III, and aVF), there is evidence of previous myocardial injury as indicated by the presence of pathological Q-waves and T-wave inversions. The baseline rhythm appears to be sinus. Clinically, these findings in combination—persistent ST elevation and PR depression following an initial ischemic event—are highly suggestive of Dressler syndrome or post-myocardial infarction pericarditis, often associated with a pericardial effusion. This ECG serves as an educational example for distinguishing between acute ST-segment elevation myocardial infarction (STEMI) and pericarditis in a post-surgical or post-procedural clinical setting.
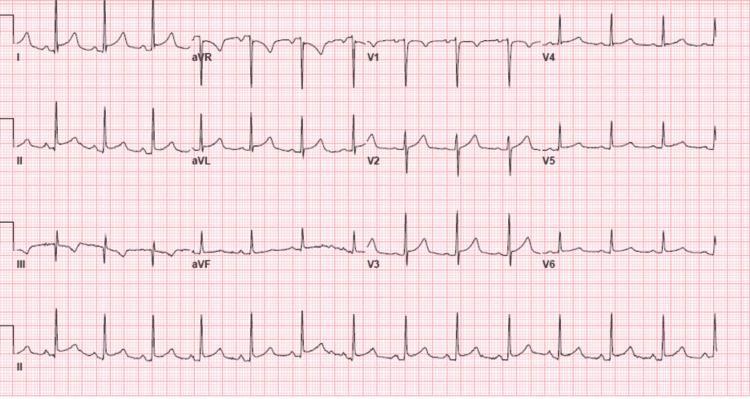
This diagnostic image is a standard 12-lead electrocardiogram (ECG) displayed on a traditional grid background. The tracing demonstrates a normal sinus rhythm with characteristic features of acute pericarditis. Primary findings include diffuse, concave-upward (saddle-shaped) ST-segment elevation visible across multiple vascular territories, specifically in limb leads I, II, III, aVF, and precordial leads V2 through V6. Correspondingly, lead aVR shows reciprocal ST-segment depression. A highly specific finding for pericarditis is the presence of PR-segment depression, most notably seen in leads II, III, aVF, and V4-V6, while lead aVR displays reciprocal PR-segment elevation. The baseline rhythm is stable with a normal QRS morphology and no evidence of localized pathological Q-waves. This ECG serves as a classic educational example for distinguishing inflammatory pericardial processes from acute myocardial infarction through the diffuse nature of the ST changes and the presence of PR-segment shifts.
constrictive pericarditis pericardium calcification
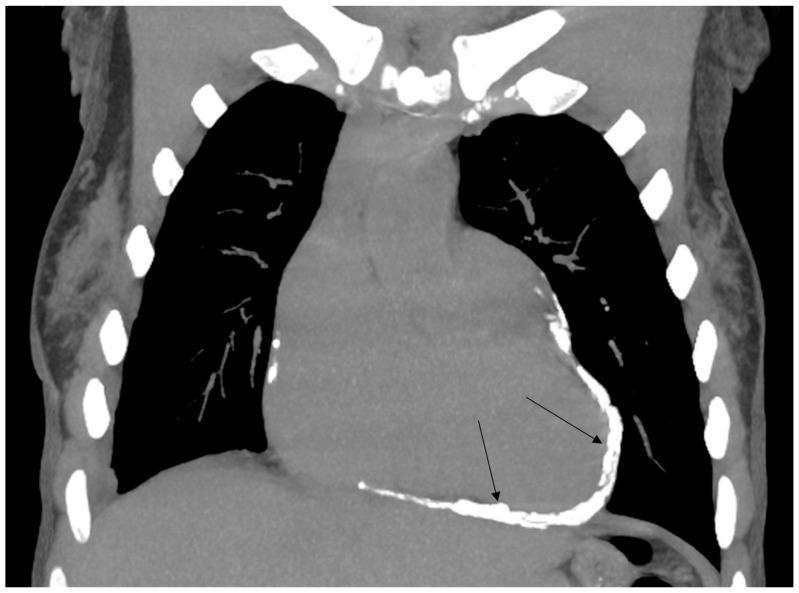
This diagnostic image is a coronal Computed Tomography (CT) scan of the thorax demonstrating a classic presentation of constrictive pericarditis. The primary pathology is characterized by extensive, circumferential, high-density calcification and thickening of the pericardium, indicated by black arrows. The pericardium appears as a bright, hyperdense rim encasing the heart, particularly along the inferior and lateral borders of the cardiac silhouette. This dense calcification is a hallmark sign of chronic pericardial inflammation, often resulting from prior radiotherapy or infection. Within the thoracic cavity, the heart occupies a central position with an altered, somewhat tubular shape due to the rigid pericardial shell. The bilateral lung fields appear hypodense (dark), contrasting with the skeletal structures of the rib cage and vertebrae. This visual material is highly relevant for cardiology and radiology education, illustrating the structural manifestations of radiation-induced cardiac disease and the pathophysiology of diastolic heart failure caused by pericardial constriction.
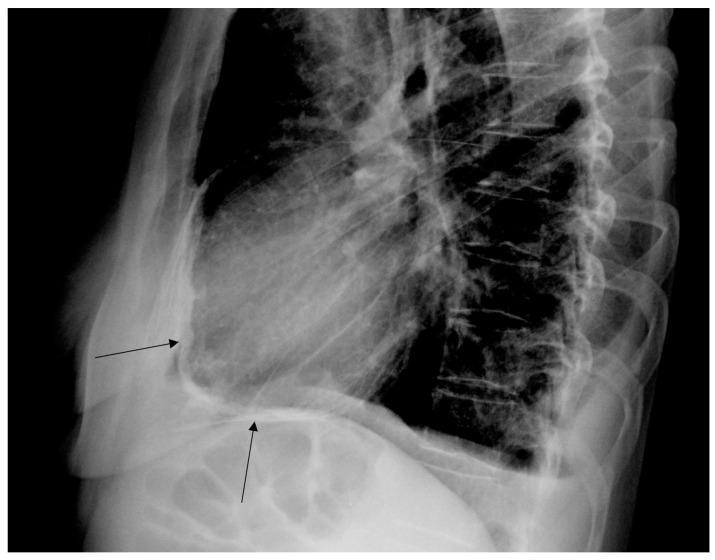
This lateral chest X-ray illustrates the diagnostic hallmarks of constrictive pericarditis. The image prominently features heavy, curvilinear calcification of the pericardium, highlighted by black arrows. These dense, radio-opaque deposits are clearly visible along the anterior and inferior borders of the cardiac silhouette, situated in the retrosternal space and above the diaphragm. Key anatomical landmarks include the sternum anteriorly, the vertebral column and ribs posteriorly, and the shadow of the heart within the thoracic cavity. The thick, white band of calcium outlining the heart is a classic radiographic sign of chronic pericardial inflammation and fibrosis, often seen as a late sequela of radiation therapy or chronic infection. This visual finding is highly suggestive of impaired ventricular filling and restrictive cardiac physiology. The educational focus is on identifying extracardiac calcification as a marker for constrictive pericarditis in patients with characteristic clinical symptoms.
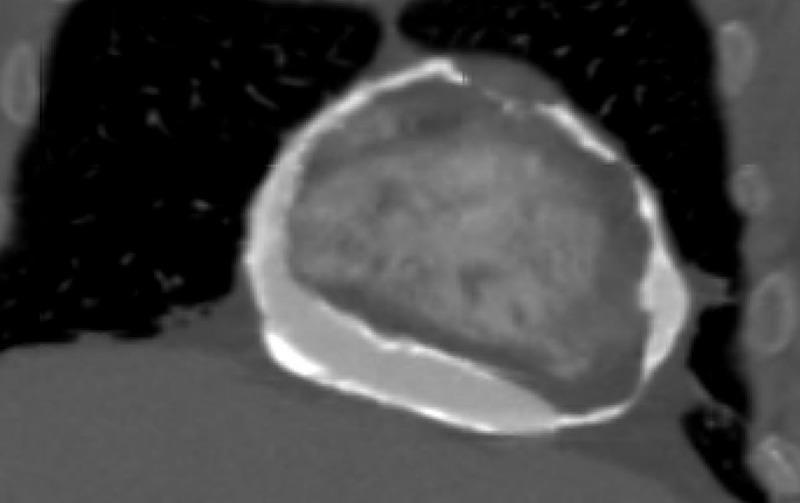
This diagnostic image is a coronal cross-section from a chest computed tomography (CT) scan focusing on the mediastinum. The image demonstrates severe, extensive pericardial calcification, a hallmark of chronic constrictive pericarditis. The calcification appears as a high-attenuation (bright white), hyperdense rim or band of irregular thickness that nearly circumferentially encases the heart. This 'eggshell' calcification is most prominent along the diaphragmatic and lateral surfaces of the pericardium. The anatomical appearance suggests a rigid, non-compliant fibrous shell that likely restricts normal cardiac diastolic filling and chamber expansion. This finding is clinically significant for diagnosing constrictive physiology in patients presenting with symptoms of heart failure or impaired cardiac output. The surrounding lung parenchyma appears dark (hypodense) in contrast to the dense, mineralized pericardial sac.
Pericardial Diseases
Anatomy & Normal Physiology
- Maintain the heart's position in the mediastinum
- Lubricate the cardiac surface
- Prevent spread of adjacent infections
- Prevent cardiac overdilation
- Maintain normal pressure-volume relationships of cardiac chambers
Classification of Pericardial Diseases
| Category | Examples |
|---|---|
| Inflammatory | Acute pericarditis, myopericarditis |
| Effusive | Pericardial effusion, hemopericardium, chylous pericarditis |
| Compressive | Cardiac tamponade |
| Constrictive | Constrictive pericarditis |
| Congenital | Absence of pericardium |
1. Acute Pericarditis
Etiology
- Viral (Coxsackievirus, echovirus, EBV, CMV, influenza, HIV, SARS-CoV-2)
- Bacterial (uncommon; Staphylococcus, Streptococcus, Mycobacterium tuberculosis - common in developing countries)
- Fungal, parasitic
- Post-injury syndromes: post-MI (Dressler syndrome), post-cardiac surgery, blunt/penetrating trauma, radiation
- Systemic diseases: SLE, rheumatoid arthritis, sarcoidosis, scleroderma, amyloidosis
- Metabolic: uremia (most common systemic cause)
- Malignancy: metastatic tumor, primary cardiac tumors
- Medications (hydralazine, procainamide, isoniazid)
- Aortic dissection
Clinical Features
- Sharp, pleuritic chest pain - the hallmark
- Pain is relieved by sitting forward (leaning forward) and worsened by lying supine, deep inspiration, or swallowing
- Fever, myalgias, malaise (especially with viral etiology)
- Pericardial friction rub - pathognomonic; a scratchy, leathery sound
- Best heard: lower left sternal border, with patient leaning forward in full expiration
- Can be triphasic (atrial systole, ventricular systole, early diastole)
- Intermittent and migratory - may disappear as effusion develops
ECG Changes (4 Classic Stages)
| Stage | Timing | Findings |
|---|---|---|
| Stage 1 | Hours to days | Diffuse concave ("saddle-shaped") ST elevation + PR depression (most leads); ST elevation in aVR |
| Stage 2 | Days to weeks | ST and PR normalization; T-wave flattening |
| Stage 3 | Weeks | Deep, symmetric T-wave inversions |
| Stage 4 | Weeks to months | ECG returns to normal (T inversions may persist) |
- ST elevation is concave upward (vs. convex in STEMI)
- Diffuse (not territory-bound to one coronary artery)
- No simultaneous T-wave inversions in Stage 1
- No Q-wave development
- PR depression is present (highly specific)
Diagnostic Criteria
- Characteristic chest pain
- Pericardial friction rub
- New widespread ST elevation or PR depression on ECG
- New or worsening pericardial effusion
- Elevated CRP (marker of inflammation, guides treatment duration)
- Elevated ESR, leukocytosis (non-specific)
- Echo: effusion present in up to 60% (normal echo does NOT exclude diagnosis)
- Cardiac MRI: pericardial delayed gadolinium enhancement suggests active inflammation
- Troponin: elevated if myopericarditis is present
Morphology (Pathology)
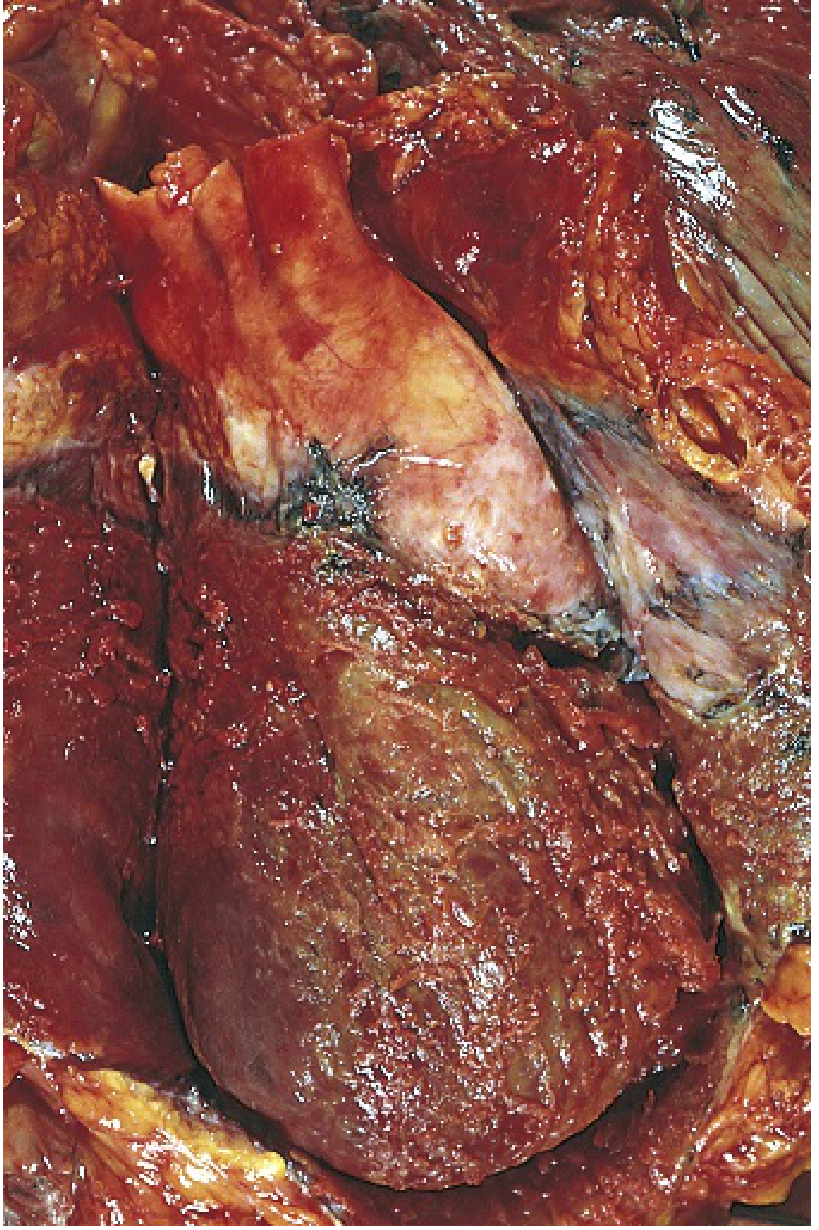
- Viral/uremic pericarditis: fibrinous exudate - irregular, shaggy "bread and butter" appearance
- Bacterial pericarditis: fibrinopurulent/suppurative exudate with pus
- Tuberculous: caseation
- Malignant: shaggy fibrinous exudate + bloody effusion
Management
- NSAIDs (first-line): Ibuprofen 600 mg QID or indomethacin 25-50 mg TID for 10 days; aspirin 650 mg TID is an alternative
- Colchicine (add to NSAIDs): 0.5-0.6 mg BID for 3 months - reduces recurrence by ~50% and improves treatment success
- Restrict activity: Avoid strenuous exercise until symptom-free and CRP normalizes
- Corticosteroids: Reserve for cases refractory to NSAIDs + colchicine, or contraindications to NSAIDs (e.g., pregnancy, renal failure); prednisone 0.2-0.5 mg/kg/day with slow taper. NOTE: steroids increase recurrence risk and should be avoided as first-line therapy
- Treat underlying disease (dialysis for uremia; antimicrobials for bacterial/TB etiology)
- Fever >38°C
- Subacute onset
- Large effusion / tamponade
- Immunosuppressed / on anticoagulants
- Elevated troponin (myopericarditis)
- Failure to respond to NSAIDs after 1 week
2. Pericardial Effusion
Types & Causes
| Type | Fluid | Causes |
|---|---|---|
| Serous | Protein-rich transudate | CHF, hypoalbuminemia |
| Serosanguineous | Bloody fluid | Blunt chest trauma, malignancy, ruptured MI, aortic dissection |
| Purulent/exudative | Pus | Bacterial infection |
| Chylous | Chyle (lymph) | Mediastinal lymphatic obstruction |
| Hemopericardium | Pure blood | Trauma, aortic dissection, MI rupture |
Volume and Clinical Significance
- Normal pericardial fluid: <50 mL
- Slowly accumulating effusions (<500 mL): pericardium stretches - may be asymptomatic; only finding is "water bottle" globular cardiac silhouette on CXR
- Rapidly accumulating effusions (200-300 mL): can produce cardiac tamponade even with small volumes due to lack of pericardial compliance
3. Cardiac Tamponade
Pathophysiology
Classic Clinical Triad - Beck's Triad (acute tamponade)
- Hypotension (low cardiac output)
- Elevated JVP (increased venous pressure)
- Muffled heart sounds (fluid attenuates sounds)
Other Signs
- Pulsus paradoxus: fall in systolic BP >10 mmHg during inspiration - cardinal sign
- Mechanism: inspiratory increase in RV filling (septal shift) compresses LV, reducing LV stroke volume and systolic BP
- Tachycardia (compensatory)
- Kussmaul's sign: absent in tamponade (present in constrictive pericarditis)
- ECG: electrical alternans (alternating QRS axis due to heart swinging within the effusion) + sinus tachycardia; low-voltage QRS
Echocardiography (Diagnostic Gold Standard)
- Large anechoic (echo-free) space surrounding cardiac chambers
- Right atrial diastolic collapse (earliest sign)
- Right ventricular diastolic collapse (more specific for tamponade physiology)
- Plethoric inferior vena cava (>2 cm, <50% collapse with inspiration)
- Exaggerated respiratory variation in mitral/tricuspid inflow velocities
Management
- Urgent pericardiocentesis (needle drainage) - life-saving
- Preferred approach: subxiphoid (subcostal) under echo guidance
- Even removing 50-100 mL provides dramatic hemodynamic improvement
- Surgical drainage (pericardial window) if loculated effusion or recurrent
- IV fluid bolus as temporizing measure to maintain preload
- Avoid vasodilators, diuretics, and beta-blockers (worsen cardiac output)
4. Constrictive Pericarditis
Pathophysiology
Causes
- Tuberculosis (most common worldwide)
- Prior cardiac surgery (most common in developed countries)
- Prior radiation therapy (chest radiation for lymphoma, breast cancer)
- Viral/idiopathic pericarditis (recurrent)
- Bacterial pericarditis
- Malignancy, renal failure
Clinical Features
- Signs of right heart failure: elevated JVP, hepatomegaly, ascites, peripheral edema
- Low cardiac output: fatigue, dyspnea, cachexia
- Kussmaul's sign: paradoxical rise (or failure to fall) in JVP with inspiration
- Pericardial knock: early diastolic sound (abrupt cessation of ventricular filling)
- Pulsus paradoxus: usually absent (unlike tamponade) - unless effusive-constrictive type
- Atrial fibrillation common
Key Differentiation: Tamponade vs. Constrictive Pericarditis vs. Restrictive Cardiomyopathy
| Feature | Tamponade | Constrictive Pericarditis | Restrictive CMP |
|---|---|---|---|
| Pulsus paradoxus | Present | Usually absent | Absent |
| Kussmaul's sign | Absent | Present | Present |
| Pericardial knock | Absent | Present | Absent |
| RVDP dip-plateau pattern | Absent | Present | Present |
| Pericardial calcification | No | Possible | No |
| Echo: RV collapse | Present | Absent | Absent |
| Septal bounce | No | Present | No |
| Myocardium | Normal | Normal | Abnormal (stiff/infiltrated) |
Imaging
- CXR/CT: pericardial calcification (eggshell appearance) - pathognomonic when present; pericardial thickening >4 mm
- Echo: septal bounce ("septal shudder"), dilated IVC, respiratory septal shift, normal tissue Doppler e' velocity (distinguishes from restrictive CMP where e' is reduced)
- Cardiac MRI: pericardial thickening, inflammation (gadolinium enhancement suggests reversible disease that may respond to anti-inflammatory therapy)
- Cardiac catheterization: "dip-and-plateau" (square root sign) pattern in ventricular pressure tracings; equalization of diastolic pressures across all 4 chambers
Management
- Pericardiectomy (surgical stripping): definitive treatment; mortality 5-10% at experienced centers
- Anti-inflammatory therapy (NSAIDs + colchicine) if transient/reversible constrictive pericarditis
- Diuretics for symptomatic relief of congestion (use cautiously - ventricular filling is preload-dependent)
- Treat underlying cause (e.g., anti-TB therapy for TB constrictive pericarditis before surgery)
5. Recurrent Pericarditis
- Occurs in 15-30% of patients after a first episode
- Defined as: recurrence after a symptom-free interval of at least 4-6 weeks
- Management: NSAIDs + colchicine (extended course); steroids for refractory cases
- IL-1 blockade (Anakinra, Rilonacept): increasingly used for corticosteroid-dependent or refractory recurrent pericarditis - rilonacept is FDA-approved for recurrent pericarditis
6. Specific Syndromes
Dressler Syndrome (Post-Myocardial Infarction Pericarditis)
- Autoimmune pericarditis developing weeks to months after MI, cardiac surgery, or trauma
- Mechanism: antibodies against injured myocardium (anti-myosin, anti-actin)
- Presents with fever, pleuritic chest pain, pericardial rub, elevated ESR/CRP
- ECG may show diffuse ST changes (may be difficult to distinguish from infarct extension)
- Treat with aspirin (preferred post-MI) + colchicine; avoid indomethacin (impairs scar healing)
Tuberculous Pericarditis
- Common cause in endemic regions (Sub-Saharan Africa, Southeast Asia)
- Often presents subacutely with fever, weight loss, night sweats + signs of pericardial disease
- Large effusions with high lymphocyte count, elevated adenosine deaminase (ADA)
- High risk of progressing to constrictive pericarditis
- Treatment: standard 4-drug anti-TB therapy + adjunctive corticosteroids reduce risk of constriction
Uremic Pericarditis
- Occurs in patients with severe renal failure (BUN >60 mg/dL)
- Fibrinous pericarditis - often hemorrhagic
- Treat with intensive dialysis (first-line); NSAIDs and colchicine have limited evidence
Quick Reference Summary
| Disease | Key Feature | Diagnosis | Treatment |
|---|---|---|---|
| Acute pericarditis | Pleuritic pain, friction rub, saddle-shaped ST elevation + PR depression | ECG, echo, CRP | NSAIDs + colchicine |
| Pericardial effusion | Globular cardiac silhouette on CXR | Echo | Treat cause; drain if tamponade |
| Cardiac tamponade | Beck's triad, pulsus paradoxus, electrical alternans | Echo (RV collapse) | Urgent pericardiocentesis |
| Constrictive pericarditis | Kussmaul's sign, pericardial knock, right heart failure | CT (calcification), Echo (septal bounce) | Pericardiectomy |
| Recurrent pericarditis | Recurrence after symptom-free interval | Clinical | NSAIDs + colchicine; IL-1 blockade |