
What is rhtyms in pulse how we can say regular irregular rhythm
pulse rhythm regular irregular ECG pattern
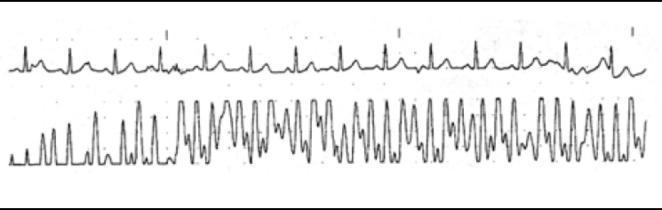
This diagnostic image displays a dual-trace physiological monitoring strip consisting of an electrocardiogram (ECG) and a pulse oximeter plethysmogram (PPG). The top trace is a standard ECG showing a regular sinus rhythm with visible P waves, QRS complexes, and T waves, maintaining a consistent baseline with minor noise. In contrast, the bottom trace depicts a pulse oximeter plethysmogram waveform exhibiting significant signal distortion and interference. The PPG waveform shows irregular morphology, fluctuating amplitudes, and high-frequency artifacts that obscure the typical dicrotic notch and pulsatile flow pattern. This visual evidence demonstrates optical crosstalk or external infrared interference, specifically attributed to surgical navigation systems like the StealthStation. The clinical significance lies in the recognition of artifact-induced waveform corruption, which can lead to erroneous SpO2 readings and false clinical alarms in a perioperative or critical care environment.
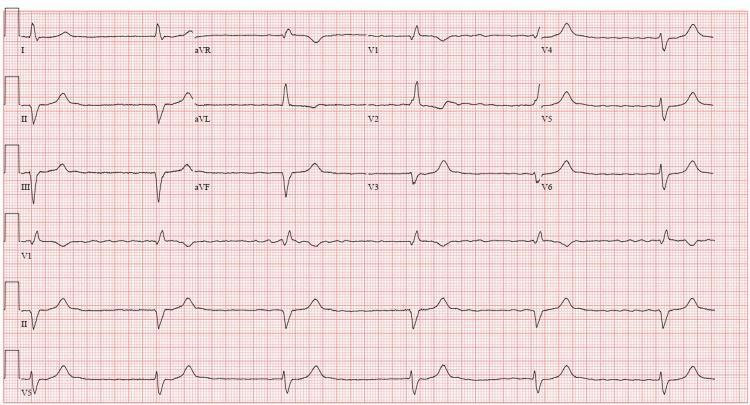
A standard 12-lead electrocardiogram (ECG) demonstrating a bradycardic rhythm at approximately 35 beats per minute. The baseline shows a fine, irregular fibrillatory pattern without organized P waves, most prominent in lead V1, consistent with underlying atrial fibrillation. The ventricular response is regular, indicating AV dissociation and a high-grade or complete heart block (CHB) with a junctional or ventricular escape rhythm. The QRS complexes are wide (approximately 160 ms), exhibiting a broad, notched, or slurred morphology. Lead V1 shows a predominantly negative QRS complex. The ST segments are largely isoelectric across most leads; however, non-specific T-wave inversions are present in the lateral leads (I and aVL), and there is generalized low T-wave amplitude. This ECG is a classic representation of CHB in the setting of permanent atrial fibrillation, demonstrating the characteristic 'regularized' rhythm that signifies total AV nodal conduction failure.
This diagnostic comparison chart features two side-by-side electrocardiography (ECG) waveform graphs used for pattern recognition and signal processing validation. The top graph, titled 'REJECTED ECG Pattern,' displays a highly irregular and non-physiological red waveform characterized by significant baseline drift, lack of rhythmic periodicity, and an isolated, high-amplitude artifact near the end of the time sample window. This represents a corrupted or non-compliant signal typically discarded by automated diagnostic algorithms. The bottom graph, titled 'ACCEPTED ECG TimeSerie,' displays a high-fidelity black waveform exhibiting classic physiological characteristics. It shows a regular sinus rhythm with clearly defined, repetitive QRS complexes, P-waves, and T-waves at a consistent frequency and amplitude. The comparison serves an educational purpose by illustrating the distinction between clinical-grade ECG data and signals corrupted by noise or motion artifacts, emphasizing the importance of signal quality in medical diagnostics and the functionality of pattern recognition pipelines in cardiology.
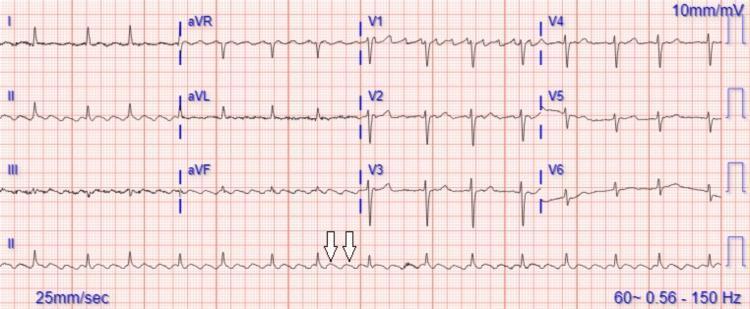
This diagnostic image is a 12-lead electrocardiogram (ECG) recorded at a standard paper speed of 25 mm/sec and calibration of 10 mm/mV. The tracing demonstrates a classic atrial flutter rhythm characterized by a continuous, rapid 'saw-tooth' baseline pattern, most prominent in the inferior leads (II, III, and aVF). White arrows in the long rhythm strip (Lead II) highlight these regular flutter waves. The ventricular rate is irregular due to variable atrioventricular (AV) conduction, where the ratio of atrial impulses to QRS complexes changes periodically. The QRS complexes are relatively narrow with normal morphology, and there is a notable absence of electrical alternans—the QRS amplitude remains stable beat-to-beat, which is an important clinical finding used to rule out significant pericardial effusion causing cardiac tamponade in certain contexts. The ST segments and T waves are largely obscured by the underlying flutter baseline. This ECG serves as an educational example of macro-reentrant supraventricular tachycardia and the identification of variable block patterns.
regularly irregular pulse ectopic beats Wenckebach
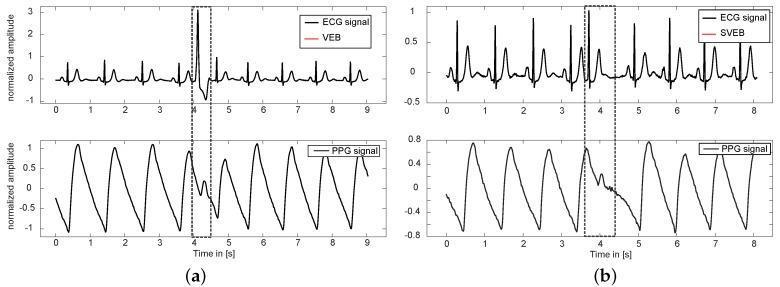
This Comparison Chart displays synchronized waveforms of Electrocardiography (ECG) and Photoplethysmography (PPG) to illustrate the effects of cardiac arrhythmias on arterial pulse waves. Panel (a) shows a Premature Ventricular Ectopic Beat (VEB) occurring at t=4s, characterized by a high-amplitude, widened, and distorted QRS complex on the ECG, which correlates with a significant reduction in amplitude and a notched morphology in the corresponding PPG pulse wave. Panel (b) illustrates a Premature Supraventricular Ectopic Beat (SVEB) at t=3.8s, where the ECG morphology remains relatively similar to normal beats, but the PPG signal exhibits a diminished amplitude and an irregular, notched peak. Both examples demonstrate how ectopic beats lead to decreased left ventricular stroke volume and arterial pulse degradation, complicating automated heart rate monitoring and Pulse Arrival Time (PAT) estimation. The charts use normalized amplitude on the y-axis and time in seconds on the x-axis, highlighting the diagnostic challenges posed by premature beats in synchronized cardiovascular signal analysis.
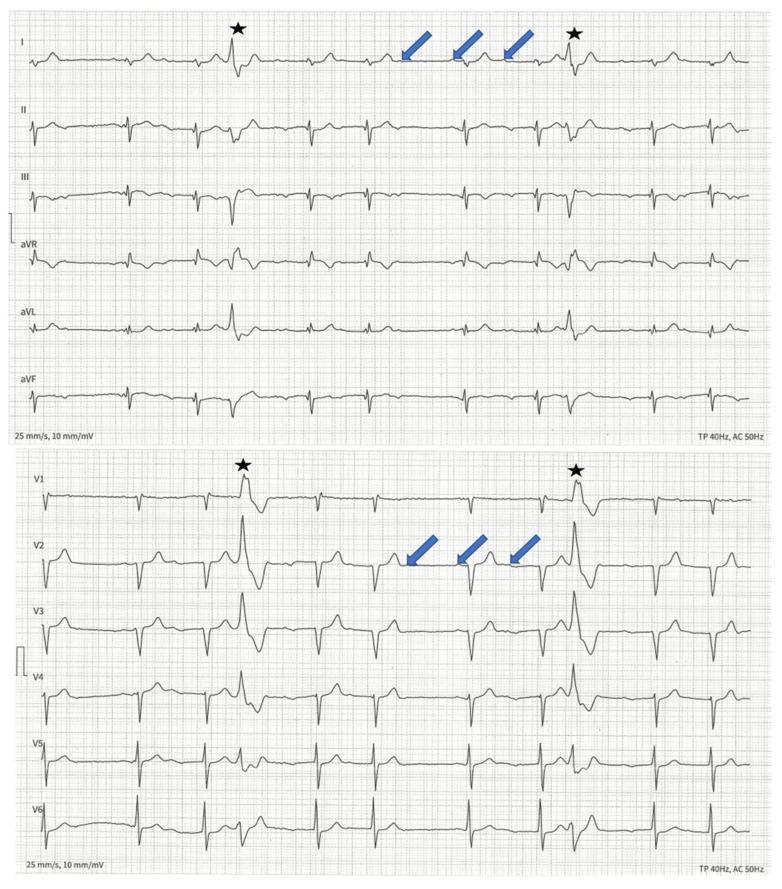
This diagnostic image displays a 12-lead electrocardiogram (ECG) tracing on a standard grid (25 mm/s, 10 mm/mV) demonstrating significant conduction abnormalities. The ECG features a second-degree type I atrioventricular (AV) block, also known as Wenckebach phenomenon. Blue arrows in leads I and V2 highlight P-waves, illustrating a progressive prolongation of the PR interval (PQ interval) in successive beats until a P-wave fails to conduct to the ventricles, resulting in a dropped QRS complex. Additionally, the tracing shows ventricular ectopy in the form of premature ventricular contractions (PVCs), identified by black stars in leads I and V1. These PVCs exhibit characteristic wide, distorted QRS complexes followed by compensatory pauses. The ECG is representative of cardiac conduction system disease, often associated with laminopathies (LMNA mutations), and serves as an educational tool for identifying progressive AV nodal delay and ectopic ventricular activity in the context of inherited cardiomyopathies.
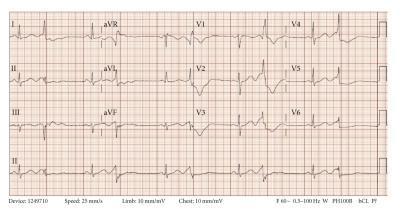
A 12-lead electrocardiogram (EKG) demonstrating a diagnostic pattern of ventricular bigeminy. The tracing reveals a regularly irregular rhythm where every sinus beat is followed by a premature ventricular complex (PVC). The sinus beats show a relatively narrow QRS morphology, while the PVCs are characterized by wide, bizarre QRS complexes with high amplitude and T-wave discordance. Notably, the EKG exhibits a significantly prolonged QTc interval of approximately 550 ms, indicating delayed ventricular repolarization. The precordial leads (V1-V6) show prominent morphological differences between the conducted and ectopic beats, with the PVCs displaying an altered axis and sequence of depolarization. This clinical diagnostic image is used to illustrate electrolyte imbalances or drug-induced long QT syndrome leading to ventricular ectopy and increased risk of Torsades de Pointes. The tracing includes limb leads (I, II, III, aVR, aVL, aVF) and precordial leads, providing a comprehensive view of the cardiac electrical activity.
Rhythms of the Pulse: Regular vs. Irregular
The Three Types of Pulse Rhythm
1. Regular (Normal) Rhythm
- Every beat arrives at exactly equal intervals
- The interval between beats does not vary
- This reflects normal sinus rhythm from the sinoatrial (SA) node
- On examination: when you count "1-2-3-4" in time with the pulse, each beat falls predictably
2. Regularly Irregular (Periodic Irregularity)
| Condition | What you feel |
|---|---|
| Sinus arrhythmia | Pulse speeds up with inspiration, slows with expiration - a rhythmic waxing and waning |
| Ventricular/atrial bigeminy | Every normal beat is followed by a premature beat and a pause - feels like "beat - beat (weak) - pause - beat - beat (weak) - pause" |
| Trigeminy | Pattern repeats every 3 beats |
| 2nd degree AV block (Wenckebach / Mobitz I) | Progressive lengthening of PR interval followed by a dropped beat - feels like beats getting progressively closer together, then a pause |
| 2nd degree AV block (Mobitz II) | Sudden dropped beats at fixed ratio (e.g., every 3rd or 4th beat is dropped) |
3. Irregularly Irregular (Completely Irregular)
- Atrial flutter with variable block (variable AV conduction ratio)
- Multifocal atrial tachycardia (MAT)
- Multiple ectopic beats in rapid succession
How to Clinically Assess Pulse Rhythm at the Bedside
- If every beat comes like a metronome → Regular
- If some beats are off → move to step 3
- Feel for 20-30 seconds. Does the same pattern repeat?
- "Normal beat, weak beat, pause... normal beat, weak beat, pause..." → Regularly Irregular (bigeminy)
- Completely chaotic, no pattern at all → Irregularly Irregular (think AF)
- Have one person count the apical rate (with stethoscope at apex) and another count the radial pulse simultaneously for 60 seconds
- A difference (apical > radial) = pulse deficit, confirming that some beats are too weak to generate a palpable peripheral pulse - classic in AF
Quick Summary Table
| Feature | Regular | Regularly Irregular | Irregularly Irregular |
|---|---|---|---|
| Spacing between beats | Equal | Unequal but patterned | Completely chaotic |
| Can you predict next beat? | Yes | Yes (after recognizing pattern) | No |
| Classic cause | Normal sinus rhythm | Bigeminy, Wenckebach | Atrial fibrillation |
| ECG rhythm | Regular P-QRS | Repeating cycle | No two R-R intervals equal |
| Pulse deficit | No | Sometimes (after dropped/ectopic beat) | Yes (common in AF) |
Key Points to Remember
- Sinus arrhythmia (speeds up with breathing in, slows down breathing out) is a normal, physiological regularly irregular rhythm - common in young people and athletes.
- Bigeminy is the most commonly examined "regularly irregular" rhythm at the bedside.
- AF is the most important cause of irregularly irregular pulse - requires further workup for stroke risk (CHA₂DS₂-VASc), rate/rhythm control.
- Always confirm with ECG - the pulse examination gives you the clue, the ECG gives the diagnosis.
- S Das A Manual on Clinical Surgery lists rhythm among the 6 key pulse parameters: rate, rhythm, tension, force, volume, character, and vessel wall condition.
Vetricular premature complex
premature ventricular complex PVC ECG wide QRS compensatory pause
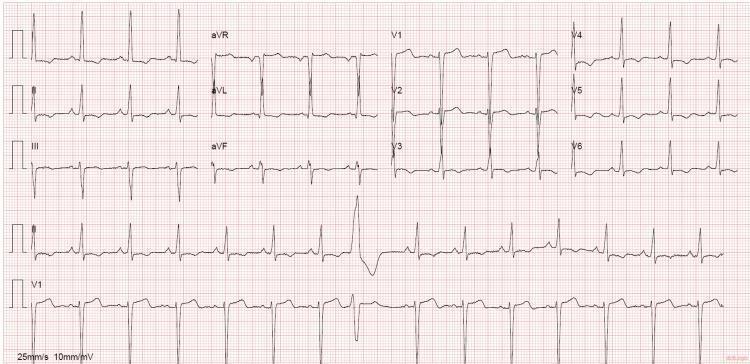
A 12-lead electrocardiogram (ECG) printed on standard grid paper (25 mm/s, 10 mm/mV) showing a baseline sinus rhythm with a notable single premature ventricular contraction (PVC). The PVC is characterized by a wide, bizarre QRS complex followed by a compensatory pause, most clearly visible in the long rhythm strip at the bottom. Across the precordial leads, specifically V4 through V6, there is evidence of ventricular repolarization abnormalities, including ST-segment depression and T-wave inversion. These findings are clinically suggestive of left ventricular overload or myocardial ischemia. The QRS axis appears normal to slightly leftward, and the rhythm strip at the bottom (lead II and V1) confirms a regular underlying rate disrupted by the ectopic beat. This diagnostic image is significant for evaluating hypertensive heart disease, cardiomyopathy, or ischemic cardiac events in a clinical setting.
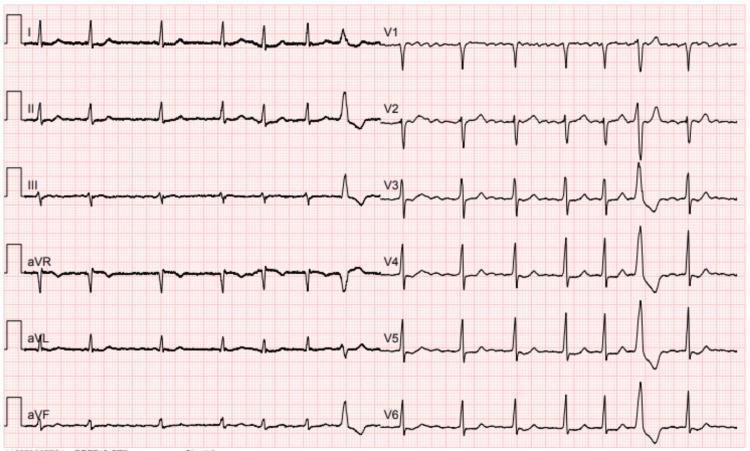
A standard 12-lead diagnostic electrocardiogram (ECG) printed on red grid paper demonstrating atrial fibrillation with a single premature ventricular complex (PVC). The rhythm is characterized by an 'irregularly irregular' pattern of R-R intervals and the absence of organized P waves, which are replaced by low-amplitude fibrillatory waves most visible in the inferior leads (II, III, aVF) and lead V1. The majority of the QRS complexes are narrow (<120 ms), indicating normal intraventricular conduction. A single wide, bizarrely shaped QRS complex is observed towards the end of the tracing, representing a premature ventricular complex (PVC). The T waves are generally concordant with the QRS complexes except for the compensatory pause following the PVC. This diagnostic image is a classic educational example of an atrial arrhythmia with associated ectopic ventricular activity, relevant for medical education in cardiology and emergency medicine to teach rhythm identification and ECG interpretation.
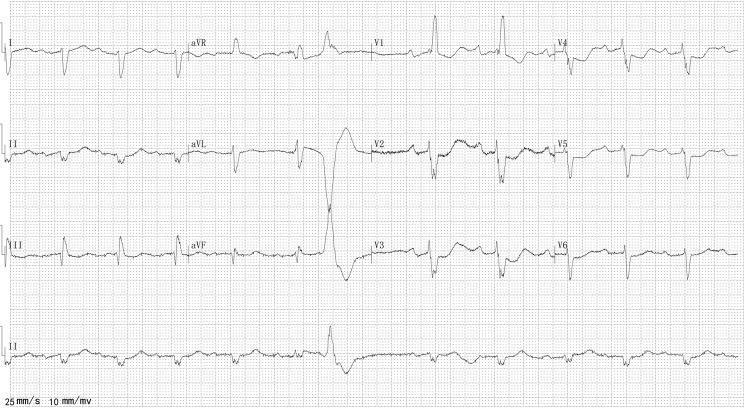
This diagnostic image is a 12-lead electrocardiogram (ECG) showing cardiac rhythm and conduction abnormalities. The tracing displays an irregularly irregular ventricular rhythm with an absence of distinct P waves, replaced by low-amplitude, irregular fibrillatory waves (f-waves), diagnostic of atrial fibrillation. The QRS complexes are wide (duration >120 ms), particularly evident in the right precordial lead V1, which exhibits an rSR' pattern (M-shaped complex) and secondary ST-T wave changes, characteristic of a complete right bundle branch block (RBBB). Additionally, a premature ventricular contraction (PVC) is visible, characterized by a wide, bizarre QRS morphology and a compensatory pause. The limb leads show a leftward axis deviation. This ECG is a critical educational tool for identifying atrial fibrillation in the presence of pre-existing bundle branch blocks and ventricular ectopy, typically seen in patients with structural heart disease or cardiomyopathy.
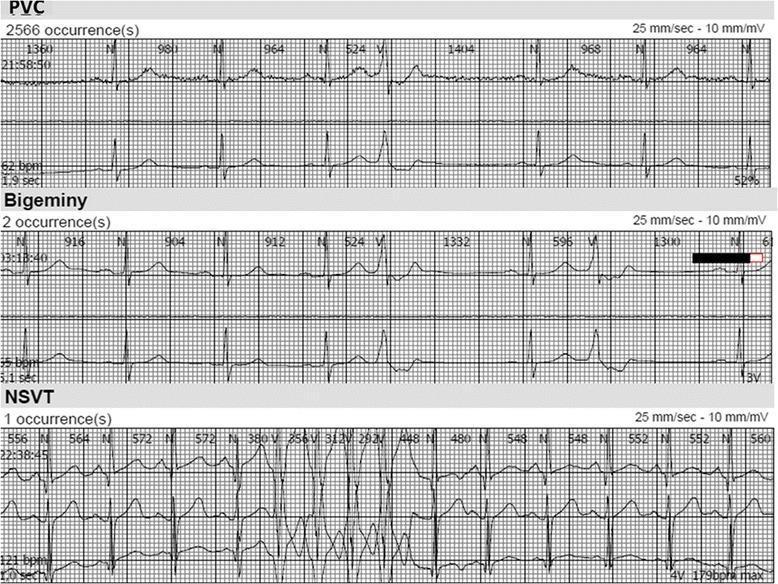
This diagnostic image displays three electrocardiography (ECG) rhythm strips illustrating various forms of ventricular ectopy. The recordings are calibrated at a standard paper speed of 25 mm/sec and a voltage of 10 mm/mV. 1. PVC (Premature Ventricular Contraction): The top strip shows frequent isolated ectopic beats. Each 'V' complex is characterized by a premature, wide, and bizarre QRS morphology lacking a preceding P-wave, followed by a compensatory pause. 2. Bigeminy: The middle strip demonstrates a repetitive pattern where every normal sinus beat ('N') is followed by one premature ventricular contraction ('V'). This 1:1 ratio between normal and ectopic beats is a hallmark of ventricular bigeminy. 3. NSVT (Nonsustained Ventricular Tachycardia): The bottom strip depicts a brief run of four consecutive wide-complex ventricular beats at a rate of 121 bpm, which spontaneously terminates and returns to sinus rhythm. Each strip includes metadata such as the heart rate, duration of the event, time of recording, and occurrence count, providing clinical context for arrhythmia burden assessment in a cardiology or sleep apnea study setting.
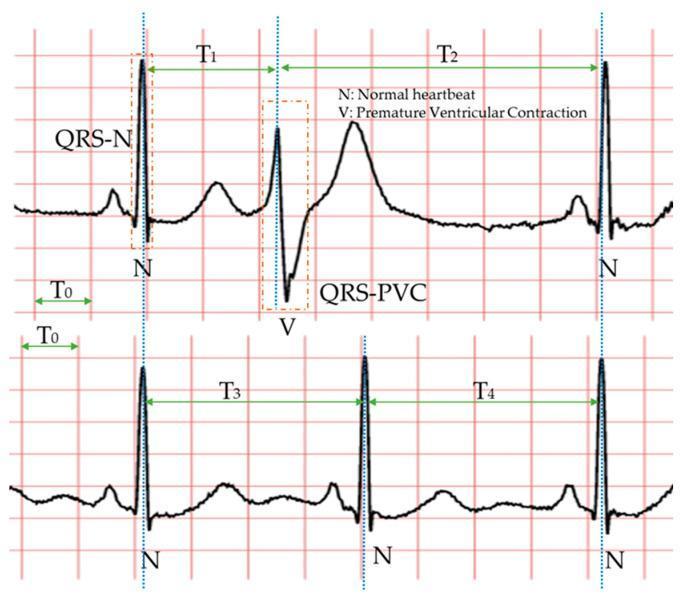
This diagnostic image provides a comparative electrocardiogram (ECG) analysis of a normal sinus rhythm versus a premature ventricular contraction (PVC). The top tracing illustrates a normal heartbeat (N) followed by a PVC (V). Key visual features include the morphology of the QRS-V complex, which is characterized by a broader duration and higher amplitude compared to the narrow, standard QRS-N complex. The PVC lacks a preceding P-wave and exhibits a discordant T-wave. Temporal markers compare the R-R intervals: T1 represents the shortened interval before the PVC (pre-prematurity), and T2 represents the subsequent compensatory pause. In the lower tracing of a regular sinus rhythm, T3 and T4 represent equal R-R intervals. The diagram highlights the clinical principle of a full compensatory pause, where T1 + T2 is approximately equal to T3 + T4. This educational graphic is designed to teach medical professionals the morphological and rhythmic identifiers used to diagnose ventricular arrhythmias, specifically focusing on QRS widening and interval disturbances.
Ventricular Premature Complex (VPC / PVC)
Mechanisms of Origin
- Enhanced automaticity - an ectopic ventricular focus fires spontaneously due to increased slope of phase 4 depolarization
- Triggered activity - early or delayed afterdepolarizations reach threshold (seen with ischemia, digoxin toxicity, catecholamines)
- Reentry - a circular re-excitation loop in ventricular myocardium or Purkinje system (most common in structural heart disease)
ECG Characteristics (How to Recognize a PVC)
| Feature | Description |
|---|---|
| Timing | Premature - occurs early, before the next expected sinus beat |
| P wave | Absent before the QRS (no preceding P wave) |
| QRS width | Wide and bizarre - duration >120 ms (0.12 sec) |
| QRS amplitude | High voltage - because only one ventricle depolarizes at a time, no cancellation effect |
| T wave | Large and in the opposite direction (discordant) to the QRS complex - because the first areas to depolarize are also the first to repolarize |
| Compensatory pause | Almost always a full compensatory pause follows |
Why the QRS is Wide - The Physiology
The Compensatory Pause - Explained
- After a PVC, the impulse travels retrogradely up through the His-Purkinje system
- It either blocks in the AV node or collides with the incoming sinus impulse
- The sinus node is not reset - it keeps firing on time
- So the next sinus beat arrives exactly on schedule after the PVC
- Result: the R-R interval from the beat before the PVC to the beat after it = exactly 2x the normal R-R interval
- Interpolated PVC: Falls between two sinus beats without disturbing rhythm at all - no pause whatsoever
- Non-compensatory pause: If the PVC conducts retrogradely to the atrium and resets the SA node
QRS Morphology and Site of Origin
| PVC Morphology in V1 | Origin |
|---|---|
| LBBB pattern (dominant S wave in V1) | Right ventricle or interventricular septum |
| RBBB pattern (dominant R wave in V1) | Left ventricle |
| Superior axis (negative II, III, aVF) | Inferior wall origin |
| Inferior axis (positive II, III, aVF) | Superior / outflow tract origin |
Repetitive Patterns of PVCs
| Pattern | Definition |
|---|---|
| Bigeminy | Every normal sinus beat followed by 1 PVC (N-V-N-V-N-V) |
| Trigeminy | Every 2 normal beats followed by 1 PVC (N-N-V-N-N-V) |
| Couplet | 2 PVCs in a row |
| Triplet / NSVT | 3 or more PVCs in a row at >100 bpm, lasting <30 seconds |
| Unifocal | All PVCs have the same morphology (one focus) |
| Multifocal | PVCs with different morphologies (multiple foci - more ominous) |
| Fusion beat | A PVC that partially collides with a sinus beat - hybrid morphology |
| R-on-T | PVC falls on the peak of the preceding T wave (vulnerable period) - risk of VF |
Clinical Features
- Often asymptomatic and discovered incidentally on ECG/Holter
- Palpitations ("skipped beat", "heart flip", "thump in chest")
- The patient often feels the pause more than the ectopic beat itself
- Fatigue, dyspnea (if frequent)
- Caffeine, nicotine, alcohol, cocaine, amphetamines
- Anxiety, stress, lack of sleep
- Hypokalemia, hypomagnesemia
- Myocardial ischemia
- Cardiomyopathy
- Digoxin toxicity
- Hypoxia, hyperthyroidism
PVC-Induced Cardiomyopathy
- Sinus QRS >130 ms
- PVC burden <17%
- Significant LV dilation
- Multifocal PVCs
- Late gadolinium enhancement on cardiac MRI
R-on-T Phenomenon
- Acute myocardial infarction
- Long QT syndrome
- Electrolyte disturbances
Management
When NO treatment is needed:
- Asymptomatic PVCs in a structurally normal heart
- Occasional PVCs without high burden
General measures (all patients):
- Correct triggers: electrolyte abnormalities (K⁺, Mg²⁺), ischemia, hypoxia
- Avoid caffeine, alcohol, stimulants
Pharmacological treatment (when symptoms require):
- Beta-blockers (metoprolol) - first line; IV 5-10 mg or oral 25-50 mg
- Non-dihydropyridine CCBs (verapamil, diltiazem) - especially for RVOT PVCs
- Membrane-active antiarrhythmics (flecainide, propafenone, mexiletine, amiodarone) - for refractory cases, but side effect profile requires careful consideration
- Lidocaine IV - do NOT use just for PVCs; only if sustained VT is also present (risk of asystole)
Catheter ablation:
- Recommended when dominant PVC morphology exists and drug therapy is ineffective, not tolerated, or not preferred
- Success rate ~90% for idiopathic PVCs
- Especially effective for RVOT PVCs
In acute MI:
- Beta-blockers + correction of hypokalemia/hypomagnesemia reduce risk of VF
- Routine prophylactic antiarrhythmics (lidocaine, amiodarone) are NOT indicated for PVCs alone
Summary - Key Points to Remember
- PVC = wide QRS (>120 ms) + no preceding P wave + discordant T wave + compensatory pause
- The pause is compensatory (full) because the SA node is not reset
- LBBB morphology → RV origin; RBBB morphology → LV origin
- >20% PVC burden can cause reversible cardiomyopathy
- Most idiopathic PVCs (RVOT origin) are benign
- PVCs in structural heart disease can be a harbinger of VT/VF
- R-on-T PVCs are dangerous - can trigger VF
Apex pulse deficiet means
apical pulse deficit atrial fibrillation radial pulse measurement
![This diagnostic image demonstrates the echocardiographic measurement of the PA-TDI duration, a marker for total atrial conduction time used in assessing atrial cardiomyopathy and atrial fibrillation risk. The visual content features a synchronized display of a 2D apical four-chamber view with color-coded Doppler flow, a pulse-wave Tissue Doppler Imaging (TDI) tracing (yellow waveform), and a surface electrocardiogram (ECG) (teal waveform). The TDI tracing displays tissue velocity on the Y-axis [cm/s] relative to a zero-baseline. Key measurement landmarks are annotated: the 'Onset P-wave' on the ECG lead II, representing the start of electrical atrial depolarization, and the 'Peak A’-wave' on the TDI tracing, representing active mechanical atrial contraction at the left atrial lateral wall. Vertical dashed lines delineate the 'PA-TDI duration' interval (131.3 ms in this example). This educational visual highlights the integration of electrical and mechanical cardiac data to evaluate atrial remodeling and function.](https://cdn.orris.care/cdss_images/pmc_clinical_VQA_ac1b39cee7290cebd0b7e892c1f3054d012c22be7d6669b0257798448de470c7.jpg)
This diagnostic image demonstrates the echocardiographic measurement of the PA-TDI duration, a marker for total atrial conduction time used in assessing atrial cardiomyopathy and atrial fibrillation risk. The visual content features a synchronized display of a 2D apical four-chamber view with color-coded Doppler flow, a pulse-wave Tissue Doppler Imaging (TDI) tracing (yellow waveform), and a surface electrocardiogram (ECG) (teal waveform). The TDI tracing displays tissue velocity on the Y-axis [cm/s] relative to a zero-baseline. Key measurement landmarks are annotated: the 'Onset P-wave' on the ECG lead II, representing the start of electrical atrial depolarization, and the 'Peak A’-wave' on the TDI tracing, representing active mechanical atrial contraction at the left atrial lateral wall. Vertical dashed lines delineate the 'PA-TDI duration' interval (131.3 ms in this example). This educational visual highlights the integration of electrical and mechanical cardiac data to evaluate atrial remodeling and function.
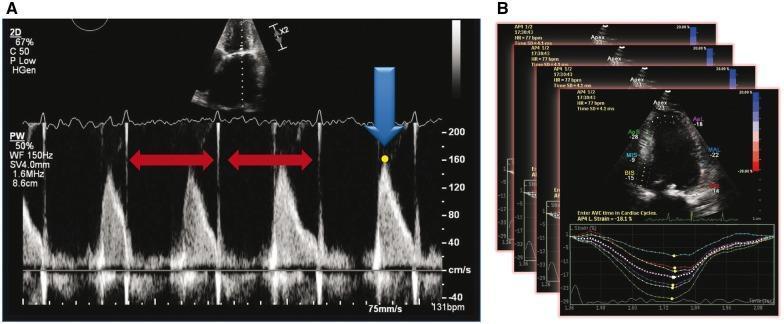
This medical figure illustrates the 'index beat method' for echocardiographic acquisition in patients with atrial fibrillation. Panel A shows a pulse-wave (PW) spectral Doppler tracing of left ventricular outflow tract (LVOT) velocities. Red horizontal arrows highlight the selection of an 'index beat' where the preceding and pre-preceding RR-intervals are similar, ensuring hemodynamic stability for measurement. A blue arrow and yellow dot mark the peak systolic velocity measurement point (approximately 160 cm/s). Panel B demonstrates the application of this method to myocardial strain imaging using speckle tracking echocardiography. It features a layered representation of multiple cardiac cycles, where individual index beats are analyzed and averaged. Each layer includes an apical four-chamber view with regional strain values (e.g., basal, mid, apical segments) and a corresponding longitudinal strain-time graph. The graphs show multicomponent curves representing regional deformation, with a dashed white line indicating the average global longitudinal strain. This methodology aims to improve the reproducibility of systolic and diastolic indices in the presence of irregular heart rhythms.
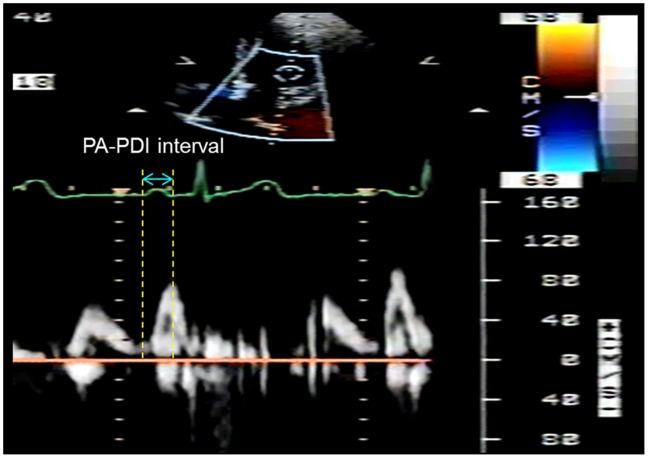
**Imaging Modality:** Transthoracic echocardiogram (TTE) utilizing Pulse-Wave (PW) Doppler imaging synchronized with a simultaneous electrocardiogram (ECG) tracing. **Anatomical Region:** Apical four-chamber view focusing on the mitral valve inflow tract. **Observed Findings:** The image displays a dual-mode display with a color Doppler sector at the top and a PW Doppler spectral tracing at the bottom. The spectral tracing shows the characteristic biphasic mitral inflow pattern, consisting of the early diastolic (E wave) and late diastolic (A wave) peaks. A concurrent ECG tracing (Lead II) is visible above the spectral waveform. **Measurements and Markers:** The "PA-PDI interval" is annotated, representing the atrial electromechanical delay. Vertical calipers mark the duration from the onset of the P-wave on the ECG to the peak of the mitral A-wave on the PW Doppler tracing. **Diagnostic Context:** This measurement is used to evaluate atrial mechanical function and electromechanical coupling. It is a key parameter in assessing atrial remodeling and predicting the risk of atrial arrhythmias, such as atrial fibrillation. The velocity scale on the right indicates flow measurements in cm/s.
Apical-Radial Pulse Deficit
Definition
Pulse Deficit = Apical Rate - Radial Rate
The Core Mechanism - Why Some Beats Don't Reach the Periphery
- Short R-R interval → ventricles don't fill adequately in diastole → small stroke volume
- Small stroke volume → insufficient pressure to open the aortic valve (or barely opens it)
- Insufficient ejection → no palpable pulse wave reaches the wrist
- But the ventricle still contracts, generating a sound heard at the apex with a stethoscope
Classic Cause: Atrial Fibrillation (AF)
- The atria fire chaotically at 350-600 impulses/min
- The AV node conducts these irregularly, at varying R-R intervals
- Some R-R intervals are very short → ventricle barely fills → near-zero stroke volume → no peripheral pulse
- Other R-R intervals are long → good filling → strong peripheral pulse
Other Causes of Pulse Deficit
| Condition | Mechanism |
|---|---|
| Atrial fibrillation | Most common cause - variable RR intervals, many beats too weak to reach periphery |
| Atrial flutter with variable block | Variable ventricular response causes some very short RR intervals |
| Premature ventricular contractions (PVCs) | PVC occurs before ventricle fills - low stroke volume beat |
| Premature atrial contractions (PACs) | Early beat with reduced filling time - weak pulse |
| Severe aortic stenosis | Narrow valve limits ejection even with adequate filling |
| Heart failure | Globally reduced stroke volume - many beats fail to generate adequate peripheral pressure |
How to Measure Pulse Deficit at the Bedside
- Person A places a stethoscope at the cardiac apex (5th intercostal space, midclavicular line) and counts all heart sounds for exactly 60 seconds
- Person B simultaneously palpates the radial pulse and counts beats for 60 seconds
- Both start and stop at the same signal
- Pulse Deficit = Apical count - Radial count
Clinical Significance
| Pulse Deficit | Clinical Implication |
|---|---|
| 0 | Normal - every beat reaches the periphery |
| Small deficit (1-5 bpm) | Occasional ectopic beats (PVCs/PACs), minor irregularity |
| Moderate deficit (>10 bpm) | Significant AF or flutter with variable block |
| Large deficit | Reflects severe disease - Roberts & Hedges: "A greater pulse deficit generally reflects more severe disease" |
Pulse Deficit vs. Pulse Rate - Don't Confuse These
| Measurement | Method | What it tells you |
|---|---|---|
| Radial pulse rate | Palpation at wrist | Effective cardiac output beats per minute |
| Apical rate | Stethoscope at apex | Total ventricular contractions per minute |
| Pulse deficit | Apical minus radial | How many beats are "lost" - severity of arrhythmia |
Key Points Summary
- Pulse deficit = Apical rate - Radial rate (always apical > radial)
- Occurs because some weak contractions don't generate enough stroke volume to produce a palpable peripheral pulse wave
- Diastolic filling time is the critical factor - shorter the RR interval, weaker the beat
- Most important cause: Atrial fibrillation - the irregularly irregular rhythm creates many short RR intervals with near-zero stroke volume
- Measured by two people simultaneously counting apex and radial over 60 seconds
- A larger deficit = more severe/uncontrolled arrhythmia
- It is also present after PVCs and PACs (the post-ectopic beat is actually stronger than normal due to the compensatory pause giving extra filling time)
How volume of pulse will be known
pulse volume assessment palpation radial artery waveform
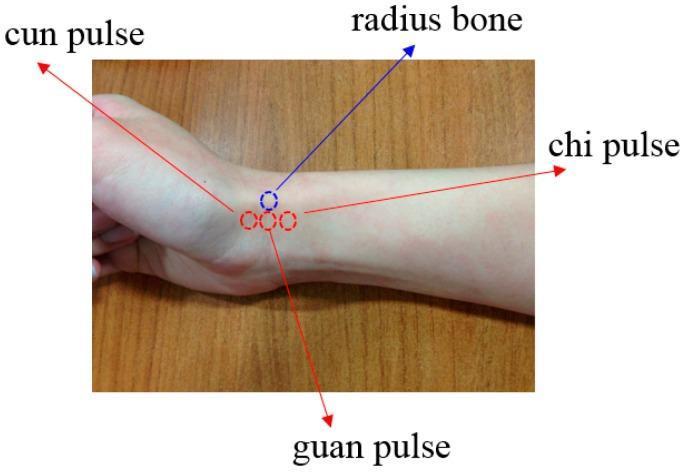
This clinical photograph illustrates the topographical anatomy of the radial pulse as used in Traditional Chinese Medicine (TCM) diagnostic palpation. The image displays a human wrist and forearm with annotations indicating four specific landmarks. Three dashed red circles, aligned along the trajectory of the radial artery, mark the 'Cun' (distal/wrist), 'Guan' (middle), and 'Chi' (proximal/forearm) pulse positions. A dashed blue circle identifies the location of the radial styloid process (labeled as radius bone), which serves as the primary anatomical reference point; the Guan pulse is situated directly adjacent to this bony prominence. This visual guide demonstrates the integration of anatomical landmarks with diagnostic clinical practice, highlighting the specific segments of the radial artery monitored for physiological assessment. The image is intended for educational purposes in both western clinical skills and complementary medicine to teach precise arterial palpation techniques.
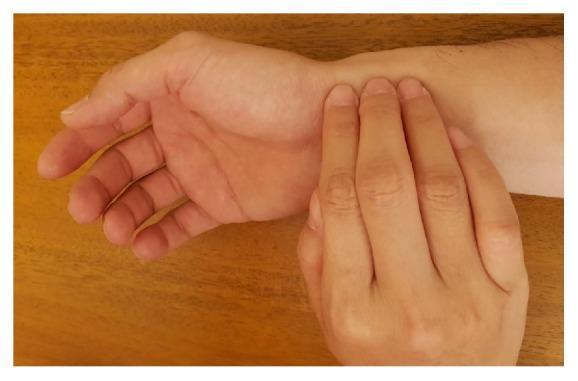
This clinical photograph demonstrates the manual technique for pulse diagnosis, specifically within the context of Traditional Chinese Medicine (TCM). The image shows a patient's right forearm and wrist in a supinated position (palm facing up) resting on a wooden surface. A practitioner is performing palpation using three fingers—the index, middle, and ring fingers—placed along the radial artery at the distal end of the radius. The fingers are aligned longitudinally from the wrist crease toward the elbow, corresponding to the TCM anatomical positions known as the 'inch' (Cun), 'bar' (Guan), and 'cubit' (Chi). The practitioner's fingertips are slightly curved and apply gentle pressure to the radial pulse to assess vascular qualities. This visual illustrates the traditional 'three positions and nine indicators' method used to evaluate organ health and systemic balance through arterial pulse characteristics. The photograph highlights the specific anatomical placement required for accurate manual arterial assessment in a clinical or educational setting.
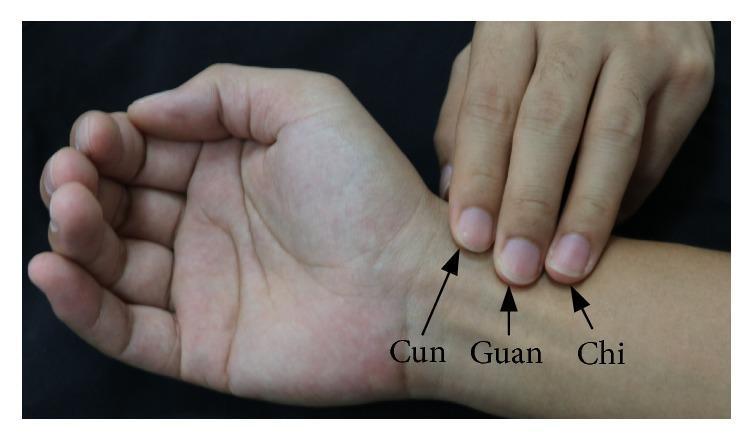
A clinical photograph illustrating the traditional technique for radial artery pulse palpation on the right wrist, often utilized in Traditional Chinese Medicine (TCM). The image shows the index, middle, and ring fingers of one hand placed over the radial styloid region of the opposite wrist. Three specific palpation points are labeled from distal to proximal: 'Cun' (index finger position, nearest the wrist crease), 'Guan' (middle finger position, over the radial styloid process), and 'Chi' (ring finger position, proximal to the styloid). The positioning demonstrates the assessment of arterial pulsations for clinical diagnosis. Anatomical landmarks visible include the distal radius area, the palmar wrist crease, and the tendons of the forearm. This visual is used to teach manual pulse examination techniques and the specific topographic locations required for arterial hemodynamic evaluation in integrative medicine.
pulse waveform types high volume low volume bounding thready
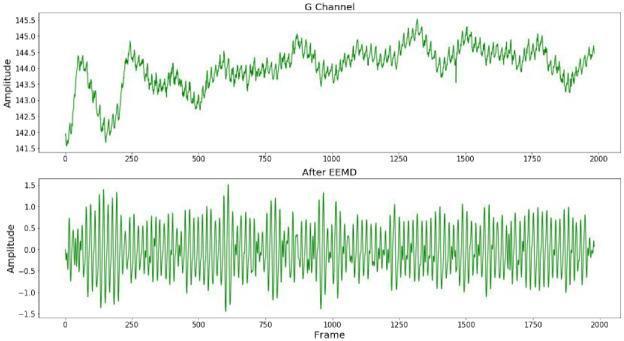
This Comparison Chart displays two signal waveforms related to remote photoplethysmography (rPPG) processing for heart rate extraction. The top panel, labeled 'G Channel,' shows the raw green-channel signal extracted from a facial video. This waveform exhibits significant baseline wander and low-frequency trends, with amplitude values ranging from approximately 141.5 to 145.5. The signal is irregular, containing superimposed noise and physiological artifacts. The bottom panel, labeled 'After EEMD,' illustrates the signal after Ensemble Empirical Mode Decomposition (EEMD) preprocessing. This waveform is centered around a zero baseline (amplitude -1.5 to 1.5) and demonstrates effective detrending and coarse denoising. The resulting oscillatory pattern is more uniform and periodic, isolating high-frequency components relevant to heart rate estimation. Both graphs use 'Frame' number on the x-axis, spanning from 0 to 2000. This visual comparison highlights the effectiveness of EEMD in removing low-frequency interference from facial skin blood volume pulse signals to improve diagnostic accuracy in non-contact cardiovascular monitoring.
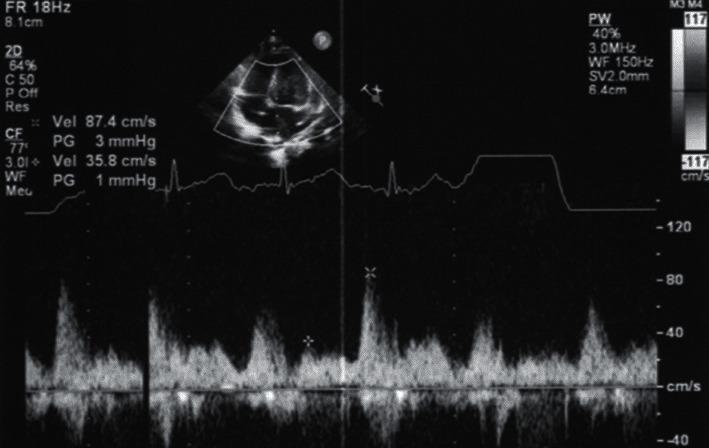
This diagnostic image is a transthoracic echocardiogram of a 4-month-old infant, featuring a 2D anatomical view and a pulse-wave (PW) spectral Doppler tracing. The 2D window at the top left shows a cardiac cross-section used for sample volume placement. Below this, a spectral Doppler waveform displays blood flow velocities over time, synchronized with a simultaneous ECG tracing. The Doppler signal demonstrates a pulsatile, phasic flow pattern across an anastomosis between a common chamber and the left atrium, following surgical repair for Total Anomalous Pulmonary Venous Connection (TAPVC). Measurement cursors identify a peak velocity (Vel) of 87.4 cm/s corresponding to a low pressure gradient (PG) of 3 mmHg, and a secondary velocity of 35.8 cm/s with a 1 mmHg gradient. The lack of continuous high-velocity flow or significant turbulence indicates the absence of anastomotic stenosis. This imaging is clinically significant for postoperative monitoring of pulmonary venous return and assessing for pulmonary vein stenosis in pediatric cardiology.
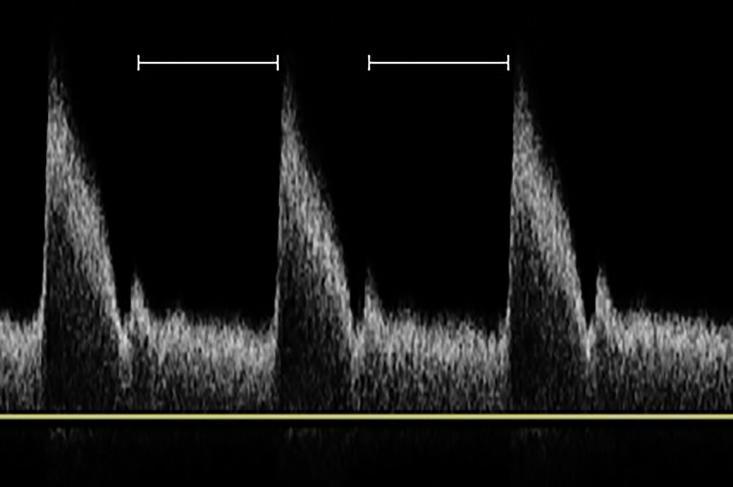
This diagnostic image displays a Doppler ultrasound spectral waveform of an arterial pulse wave, used in clinical imaging to assess hemodynamics. The waveform exhibits a characteristic triphasic or high-resistance pattern, featuring a rapid systolic upstroke (peak) followed by a sharp downstroke and a smaller secondary peak or dicrotic notch, which corresponds to the closure of the aortic valve and the onset of diastole. The base of the waveform shows low-level diastolic flow. White horizontal calipers are overlaid between the systolic peaks, specifically marking the duration of the ventricular diastole phase within the cardiac cycle. This timing is critical in shear wave elastography (SWE) for vascular assessment, as it represents the period when the arterial wall returns to its original morphology, providing a stable window (delta T) for measuring tissue stiffness and Young’s modulus in atherosclerotic plaques without the interference of the high-pressure systolic pulse.
Volume of Pulse - How It Is Assessed
What Is Pulse Volume?
Pulse Pressure = Systolic BP - Diastolic BP (normal ~40 mmHg)
How to Assess Pulse Volume Clinically
Method: Palpation of the Radial Artery
- Place the pads of your index, middle, and ring fingers over the radial artery at the wrist (just medial to the radial styloid)
- Apply gentle, then progressively increasing pressure and feel the nature of the pulsation:
- How forcefully does the vessel expand?
- How easy or difficult is it to obliterate the pulse with pressure?
- How quickly does the vessel rise and fall?
- Compare both radial arteries simultaneously to detect asymmetry
What You Are Feeling
| Finger pressure | What it tells you |
|---|---|
| Light pressure | Feel the rate and rhythm |
| Medium pressure | Feel the volume and character |
| Heavy pressure (obliterating the pulse) | Estimate the tension (reflects diastolic BP) |
The Obliteration Test for Volume
- Normal volume: requires moderate finger pressure to fully obliterate the pulse
- High volume (bounding): very difficult to obliterate - the vessel springs back strongly
- Low volume (thready/weak): easily obliterated with minimal pressure - the vessel barely expands
Classification of Pulse Volume
1. Normal Volume Pulse
- Moderate expansion felt with each beat
- Can be obliterated with firm pressure
- Pulse pressure ~40 mmHg
2. High Volume (Large / Bounding) Pulse
| Condition | Mechanism |
|---|---|
| Aortic regurgitation | Large stroke volume ejected + blood leaks back in diastole → very low diastolic BP → wide pulse pressure |
| Thyrotoxicosis | High cardiac output, low peripheral resistance |
| Anaemia | High cardiac output, low viscosity |
| Fever | Vasodilation → low peripheral resistance |
| Pregnancy | High cardiac output state |
| Beriberi (Vit B1 deficiency) | High output heart failure |
| Patent Ductus Arteriosus (PDA) | Diastolic run-off → low diastolic pressure |
| Arteriovenous fistula | Run-off in diastole |
| Exercise | Increased stroke volume |
- How to elicit it: Raise the patient's arm above the head and palpate the radial pulse - the abrupt rise and sudden collapse becomes unmistakable (the sensation resembles a water-filled toy hammer)
- From Braunwald's: "The arterial pulse often is prominent and can be best appreciated by palpation of the radial artery with the patient's arm elevated"
3. Low Volume (Small / Weak / Thready) Pulse
| Condition | Mechanism |
|---|---|
| Shock (any type) | Reduced cardiac output + vasoconstriction |
| Aortic stenosis | Outflow obstruction → low stroke volume |
| Heart failure | Reduced stroke volume |
| Cardiac tamponade | Reduced filling → low stroke volume |
| Severe mitral stenosis | Reduced forward flow |
| Hypovolaemia | Reduced preload → low stroke volume |
| Constrictive pericarditis | Restricted filling |
- Parvus = small volume
- Tardus = slow-rising (delayed peak)
- The pulse is weak AND takes a long time to reach its peak - because the narrowed valve restricts ejection
Pulse Volume vs. Pulse Tension - Don't Confuse Them
| Parameter | What it reflects | How assessed |
|---|---|---|
| Volume | Pulse pressure (systolic - diastolic BP) / stroke volume | Width of vessel expansion felt with medium pressure |
| Tension | Diastolic blood pressure | Pressure needed to fully obliterate the pulse |
- High tension = high diastolic BP (hypertension) → the artery feels taut and resistant - hard to compress
- Low tension = low diastolic BP (shock, AR) → easy to compress
- In aortic regurgitation: High volume + Low tension (wide pulse pressure - high systolic, very low diastolic)
- In hypertension: Normal volume + High tension
Summary: Pulse Volume Assessment at a Glance
Feel the radial pulse with 3 fingers
         ↓
How much does the vessel EXPAND?
         ↓
┌──────────────────┬──────────────────────┬────────────────────────┐
│   NORMAL         │   HIGH VOLUME        │   LOW VOLUME           │
│                  │   (Bounding)         │   (Thready/Weak)       │
├──────────────────┼──────────────────────┼────────────────────────┤
│ Moderate         │ Wide expansion       │ Minimal expansion      │
│ expansion        │ Hard to obliterate   │ Easily obliterated     │
│                  │ ↑ Stroke volume      │ ↓ Stroke volume        │
│                  │ ↓ Peripheral resist. │ ↑ Peripheral resist.   │
├──────────────────┼──────────────────────┼────────────────────────┤
│ Normal BP        │ AR, thyrotoxicosis,  │ Shock, AS, tamponade,  │
│                  │ anaemia, fever, PDA  │ heart failure, MR      │
└──────────────────┴──────────────────────┴────────────────────────┘
- ↑ Stroke volume OR ↓ Peripheral resistance → High volume pulse
- ↓ Stroke volume OR ↑ Peripheral resistance → Low volume pulse