Explain 10 most common heart disease with Ecg changes and Ecg diagrams. Explain in Simplest words
ECG changes 10 common heart diseases explained simply diagrams 2024
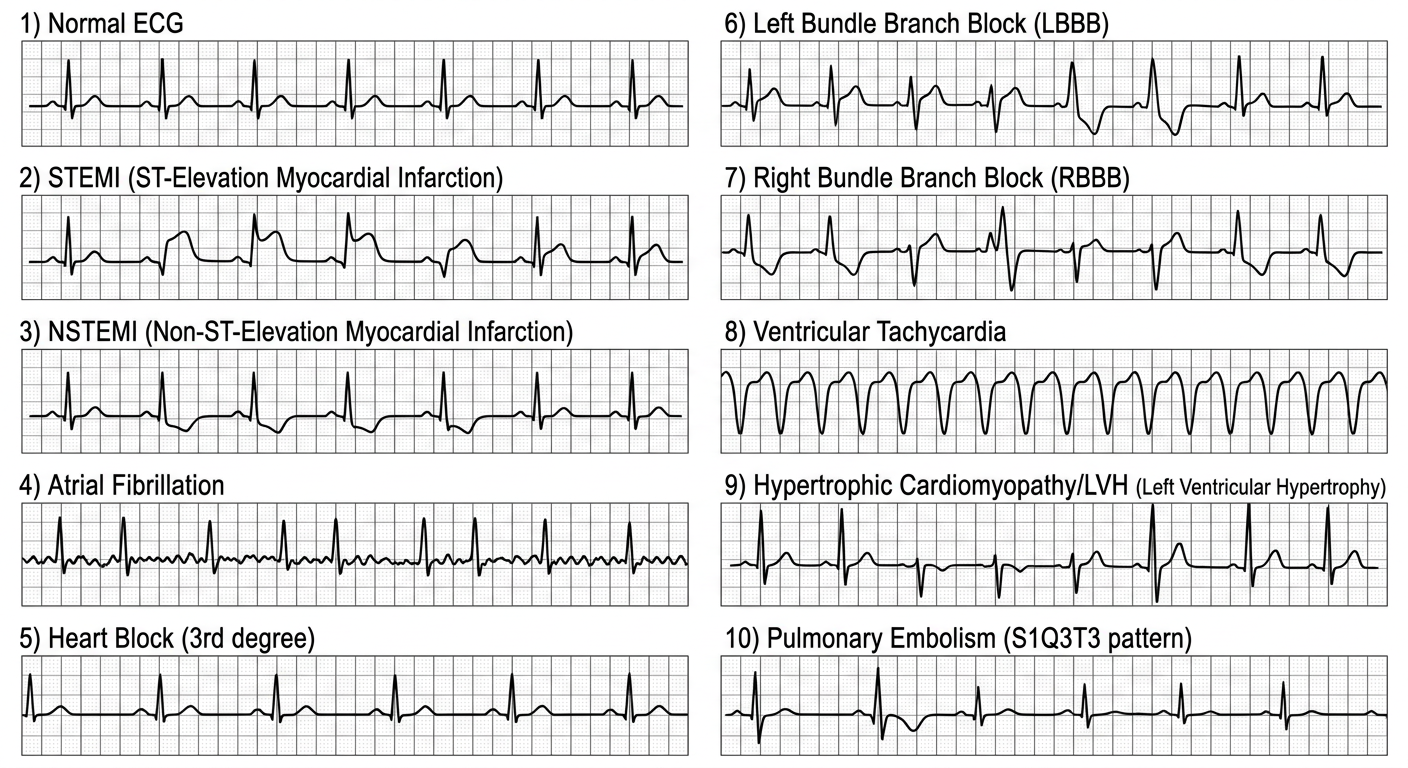
A clean educational medical diagram showing 10 ECG patterns for common heart diseases on a white background. Show 10 labeled ECG strips arranged in a grid (2 columns, 5 rows): 1) Normal ECG - regular PQRST waves, 2) STEMI - elevated ST segment with tombstone shape, 3) NSTEMI - ST depression and T wave inversion, 4) Atrial Fibrillation - no P waves, irregular QRS, wavy baseline, 5) Heart Block (3rd degree) - P waves and QRS completely dissociated, 6) Left Bundle Branch Block - wide QRS with notched M shape in V5-V6, 7) Right Bundle Branch Block - rSR prime pattern in V1, 8) Ventricular Tachycardia - wide bizarre QRS at fast rate, 9) Hypertrophic Cardiomyopathy/LVH - tall R waves with deep S waves, 10) Pulmonary Embolism - S1Q3T3 pattern. Each strip labeled clearly with the condition name. Medical textbook style, clean black lines on ECG grid paper background.
ECG Overview Diagram
First, Understand a Normal ECG
- P wave = Atria contracting (upper chambers pumping)
- QRS complex = Ventricles contracting (lower chambers pumping)
- T wave = Ventricles recovering (recharging)
- PR interval = Travel time from atria to ventricles (should be 0.12-0.20 sec)
- QRS width = Should be narrow (<0.12 sec)
🫀 The 10 Heart Diseases + ECG Changes
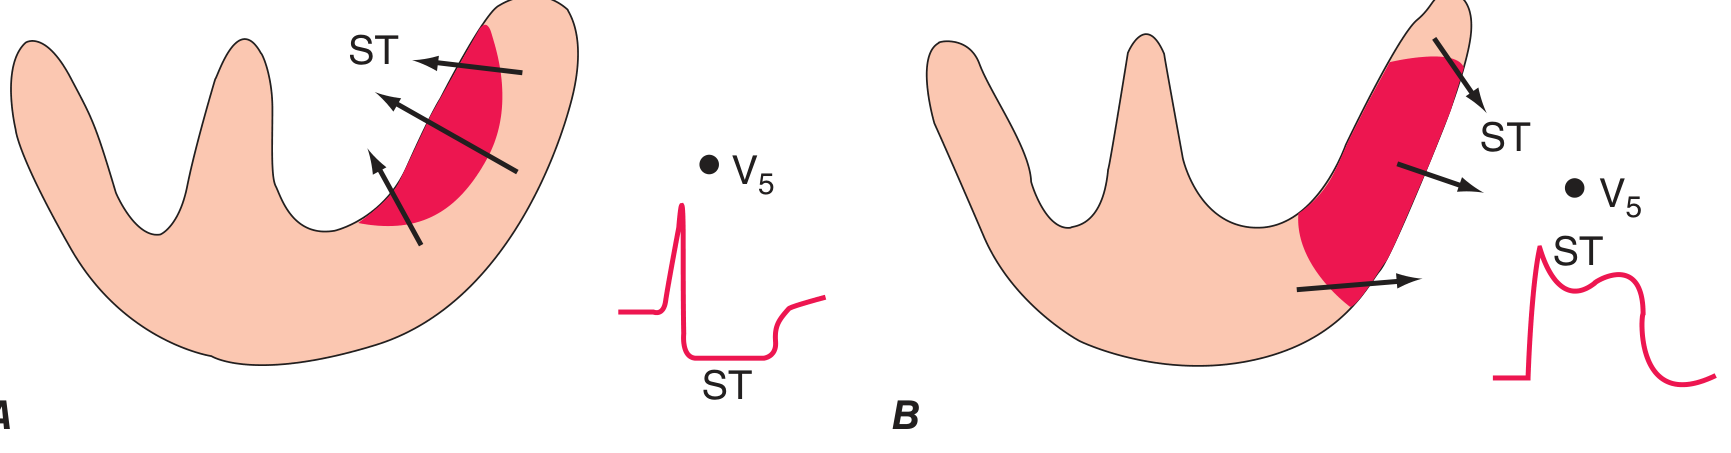
1. STEMI (ST-Elevation Myocardial Infarction) - Heart Attack (Full Blockage)
- ST segment elevation ≥ 1mm in 2 or more leads (looks like a tombstone or "tented" shape)
- Hyperacute T waves - very tall, peaked T waves (earliest sign, within minutes)
- Later: Q waves develop (deep negative deflection = dead tissue scar)
- Mirror-image ST depression in opposite leads
- Inferior MI (blockage in right coronary): ST elevation in leads II, III, aVF
- Anterior MI (blockage in LAD): ST elevation in V1-V4
- Lateral MI: ST elevation in I, aVL, V5-V6
2. NSTEMI (Non-ST-Elevation Myocardial Infarction) - Partial Heart Attack
- ST segment depression (goes DOWN instead of up) - most common finding
- T wave inversion - T wave flips upside down
- No ST elevation (that's the key difference from STEMI)
- No Q waves (usually - though they can appear)
3. Stable Angina (Coronary Artery Disease - Ischemia)
- Horizontal or downsloping ST depression ≥ 1mm
- T wave flattening or inversion
- These changes RESOLVE when pain stops
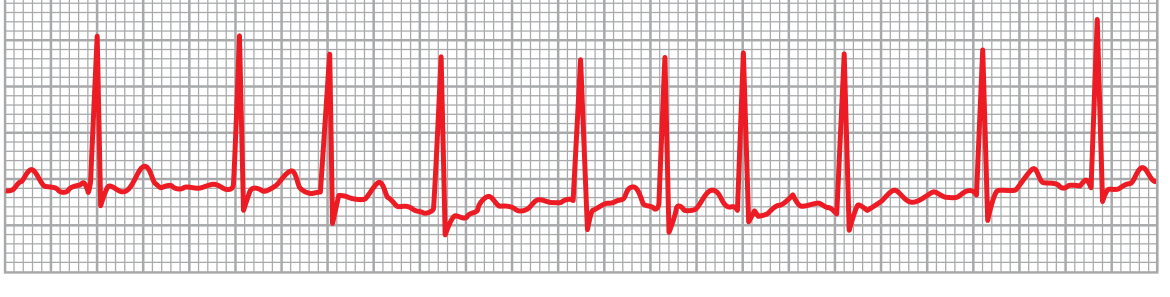
4. Atrial Fibrillation (AF) - Chaotic Upper Chambers
- No P waves - completely absent (replaced by chaotic "fibrillatory" waves - a fuzzy/wavy baseline)
- Irregularly irregular QRS - beats come at completely random intervals (no pattern)
- QRS complexes are narrow and look normal (the lower chambers still work fine)
5. Complete Heart Block (3rd Degree AV Block)
- P waves and QRS complexes are totally dissociated - they march at their own separate rates
- P waves appear at regular intervals (~60-100/min)
- QRS complexes appear at slower regular intervals (~30-50/min)
- Wide, bizarre QRS if escape rhythm comes from ventricles (ventricular escape)
- Narrow QRS if escape rhythm comes from just below AV node (junctional escape)
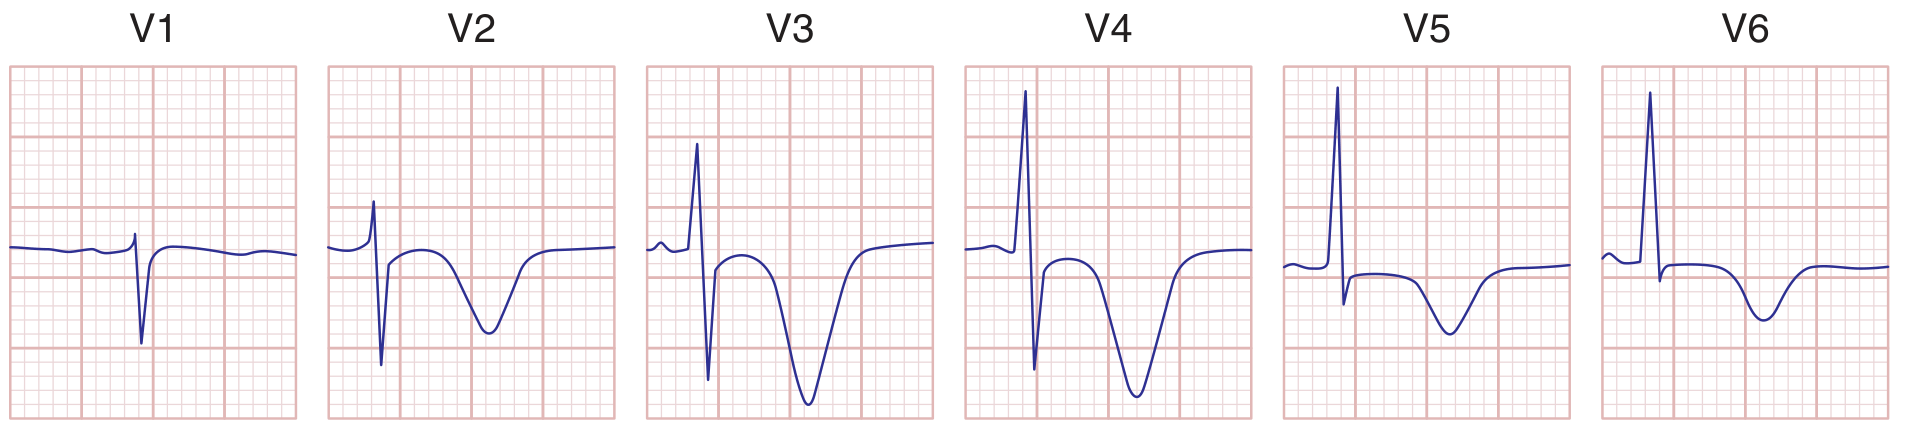
6. Left Bundle Branch Block (LBBB)
- Wide QRS ≥ 0.12 seconds (broad, slurred complexes)
- No Q wave in V5-V6 (an important clue)
- "W" pattern in V1 (rS complex)
- "M" pattern in V5-V6 (broad, notched R wave)
- T wave points OPPOSITE to the main QRS direction (discordant T waves)
7. Right Bundle Branch Block (RBBB)
- Wide QRS ≥ 0.12 seconds
- "rSR' pattern" in V1 (looks like rabbit ears or the letter "M" in V1) - this is the hallmark
- Wide S wave in V5-V6 and lead I (slurred, broad S wave)
- T wave inverted in V1-V2
8. Ventricular Tachycardia (VT)
- Wide, bizarre QRS complexes (>0.12 sec) - because signal spreads abnormally
- Very fast rate - typically 100-250 beats/min
- AV dissociation - P waves may be visible but unrelated to QRS
- "Fusion beats" - occasional normal-looking QRS when sinus beat and VT beat merge
- "Capture beats" - occasional narrow QRS (diagnostic of VT)
- All QRS complexes point in same direction
9. Hypertrophic Cardiomyopathy / Left Ventricular Hypertrophy (HCM/LVH)
- Very tall R waves in V5-V6 (left-sided leads) and/or deep S waves in V1-V2
- Voltage criteria for LVH: S in V1 + R in V5 or V6 > 35mm (Sokolow-Lyon)
- "Strain pattern" - ST depression and T wave inversion in V5-V6 (left ventricle is overloaded)
- Left axis deviation (QRS axis shifted left)
- In HCM specifically: may also see deep Q waves in lateral leads (from septal hypertrophy)
10. Pulmonary Embolism (PE) - Blood Clot in Lung
- Sinus tachycardia - the most common finding (fast heart rate, >100/min)
- Classic S1Q3T3 pattern:
- Deep S wave in Lead I
- Q wave in Lead III
- T wave inversion in Lead III
- (This happens because the right ventricle suddenly enlarges and rotates the heart)
- T wave inversions in V1-V4 (right ventricular strain)
- Right bundle branch block (new RBBB from right heart strain)
- Right axis deviation
Quick Summary Table
| # | Condition | Most Important ECG Finding |
|---|---|---|
| 1 | STEMI | ST elevation + tombstone T waves + Q waves |
| 2 | NSTEMI | ST depression + T wave inversion (no elevation) |
| 3 | Stable Angina | Normal at rest; ST depression on exertion |
| 4 | Atrial Fibrillation | No P waves + totally irregular rhythm |
| 5 | Complete Heart Block | P waves + QRS completely independent |
| 6 | LBBB | Wide QRS + W in V1 + M in V5-V6 |
| 7 | RBBB | Wide QRS + rSR' (rabbit ears) in V1 |
| 8 | Ventricular Tachycardia | Wide + fast + bizarre QRS |
| 9 | LVH/HCM | Tall voltages + strain pattern |
| 10 | Pulmonary Embolism | Sinus tachycardia + S1Q3T3 + T inversions V1-V4 |
ECG Waves Explained Simply (Reference)
         R
         |
     P   |       T
    / \  |      / \
---/   \-|-----/   \---  = Normal beat
        \|    /
         Q   S
- P = atria contract
- QRS = ventricles contract
- T = ventricles recharge
- When the ST segment goes up = the heart muscle is injured (STEMI)
- When the ST goes down = the heart muscle is short of blood (ischemia)
- When there's no P wave = the atria are misfiring (AF)
- When QRS is wide = signal travelling slowly or wrong way (bundle branch block, VT)