
Blood pressure regulation
blood pressure regulation diagram RAAS baroreceptor
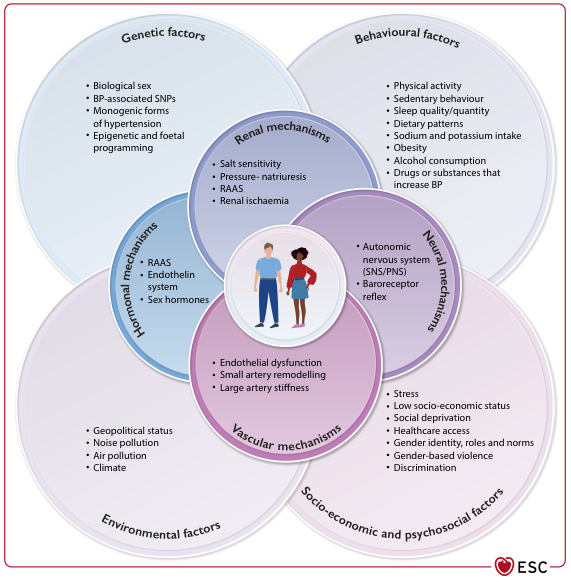
Summary : This figure presents a comprehensive overview of the multifactorial causes and mechanisms underlying blood pressure (BP) elevation and hypertension, organised as overlapping Venn diagrams. It categorises risk factors into genetic, behavioural, environmental, and socio-economic/psychosocial domains, and details the physiological mechanisms (renal, hormonal, neural, vascular) that mediate BP regulation. venn diagram / conceptual illustration: # Main Domains : • Genetic factors: Biological sex, BP-associated SNPs, monogenic forms of hypertension, epigenetic and foetal programming. • Behavioural factors: Physical activity, sedentary behaviour, sleep quality/quantity, dietary patterns, sodium and potassium intake, obesity, alcohol consumption, drugs/substances that increase BP. • Environmental factors: Geopolitical status, noise pollution, air pollution, climate. • Socio-economic and psychosocial factors: Stress, low socio-economic status, social deprivation, healthcare access, gender identity/roles/norms, gender-based violence, discrimination. # Physiological Mechanisms (Central Overlapping Circles) : ## Renal mechanisms : • Salt sensitivity • Pressure-natriuresis • RAAS (Renin-Angiotensin-Aldosterone System) • Renal ischaemia ## Hormonal mechanisms : • RAAS • Endothelin system • Sex hormones ## Neural mechanisms : • Autonomic nervous system (SNS/PNS) • Baroreceptor reflex ## Vascular mechanisms : • Endothelial dysfunction • Small artery remodelling • Large artery stiffness # Central Illustration : • At the centre, a cartoon of a man and woman symbolises the affected population. # Design Encodings : • Each domain is represented by a large, coloured circle with overlapping regions for mechanisms. • Mechanisms are shown as smaller, darker circles overlapping the main domains. • Bulleted lists within each circle detail specific factors/mechanisms. • ESC logo at bottom right. # Analysis : • The figure visually emphasises that hypertension is a complex, multifactorial condition resulting from the interplay of genetic, behavioural, environmental, and socio-economic/psychosocial factors. • Physiological mechanisms (renal, hormonal, neural, vascular) are central and overlap with all domains, indicating their integrative role in BP regulation. • The central placement of the affected individuals highlights the human impact and the need for a holistic approach to hypertension prevention and management. • No quantitative data or statistical relationships are presented; the figure is conceptual and descriptive.
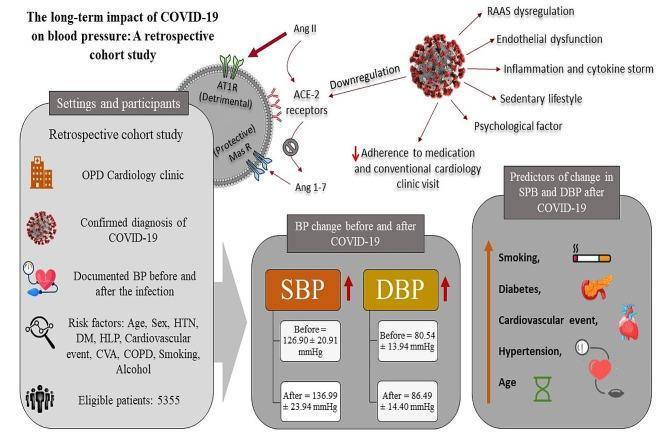
A medical infographic and pathophysiology diagram summarizing the long-term impact of COVID-19 on blood pressure based on a retrospective cohort study. The upper portion illustrates the cellular mechanism where SARS-CoV-2 leads to the downregulation of ACE-2 receptors, causing RAAS dysregulation (increased Ang II binding to AT1R and decreased Ang 1-7 binding to Mas receptors), endothelial dysfunction, and inflammation. The left panel details the 'Settings and participants' section, noting a study of 5,355 eligible patients with documented BP pre- and post-infection. The central 'BP change' panel shows quantitative increases in systolic blood pressure (SBP from 126.90 to 136.99 mmHg) and diastolic blood pressure (DBP from 80.54 to 86.49 mmHg), highlighted with red upward arrows. The right panel lists clinical predictors of BP changes, including smoking, diabetes, cardiovascular events, hypertension, and age, accompanied by illustrative icons. The graphic integrates clinical data with biological mechanisms to demonstrate the cardiovascular sequelae of COVID-19.
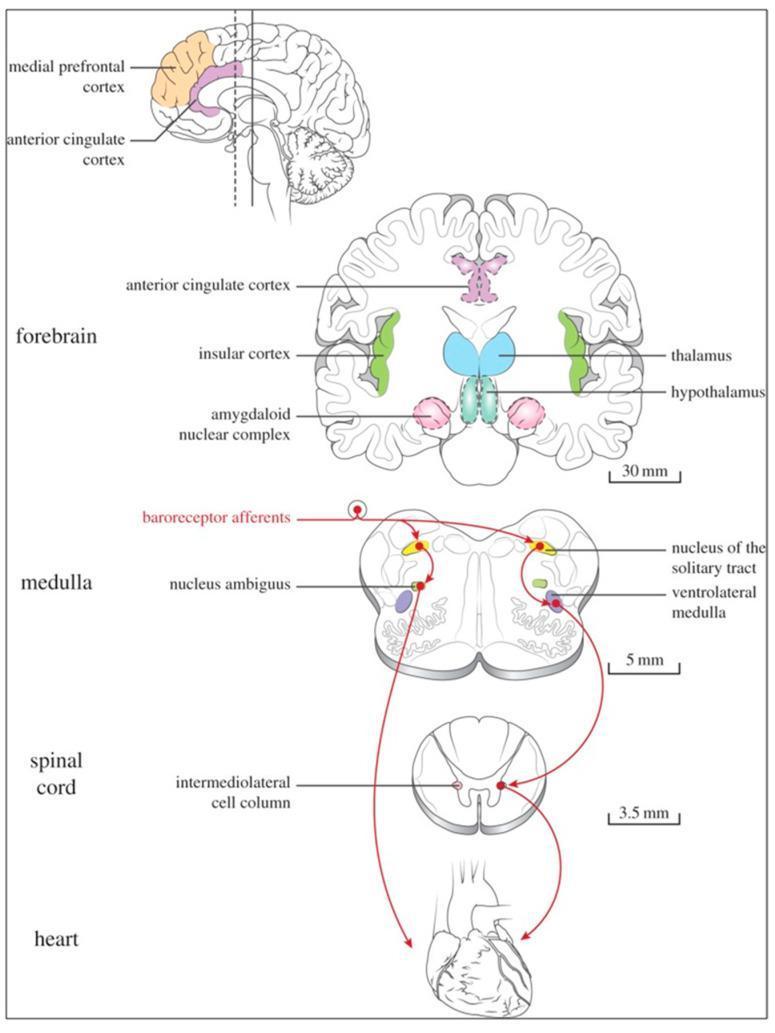
This medical diagram illustrates the central autonomic network and the neural pathways of the brain-heart interaction, specifically highlighting the baroreceptor reflex. The figure is divided into four anatomical levels: heart, spinal cord, medulla, and forebrain. In the forebrain level, a coronal cross-section identifies the anterior cingulate cortex, insular cortex, thalamus, hypothalamus, and the amygdaloid nuclear complex. A sagittal view above it highlights the medial prefrontal cortex and anterior cingulate cortex. The medulla section depicts the nucleus of the solitary tract (NTS), nucleus ambiguus, and ventrolateral medulla. The spinal cord section highlights the intermediolateral cell column. Red arrows trace the baroreceptor reflex pathway: afferent signals originate from the heart, enter the medulla via the NTS, and relay through various brainstem and forebrain nuclei to regulate sympathetic and parasympathetic outflow. This diagram demonstrates the hierarchical organization of homeostatic blood pressure control and the neuroanatomical structures facilitating autonomic regulation in humans.
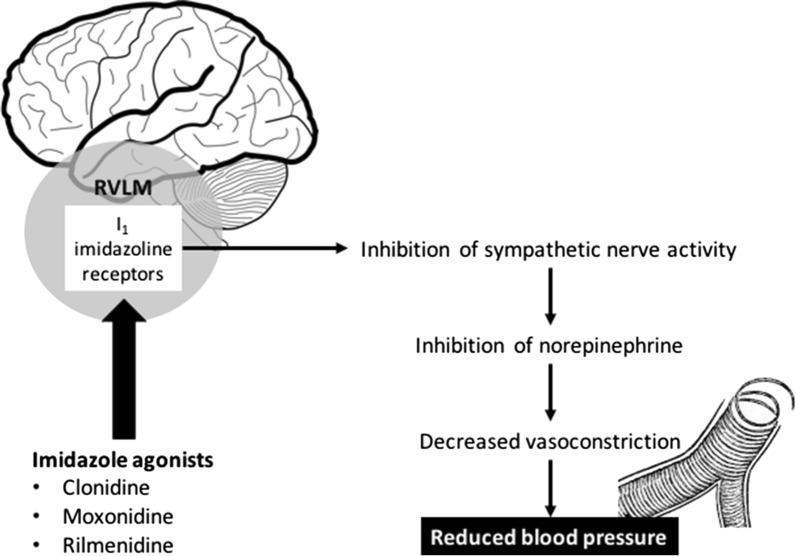
This pathophysiology diagram illustrates the mechanism of action of imidazoline receptor agonists on blood pressure regulation. The visual is divided into a sagittal brain anatomical diagram and a secondary physiological flowchart. On the left, the diagram highlights the 'I1 imidazoline receptors' located within the Rostral Ventrolateral Medulla (RVLM) of the brainstem, situated inferior to the cerebrum and anterior to the cerebellum. Below this, three pharmacological agents—Clonidine, Moxonidine, and Rilmenidine—are listed as imidazole agonists that target these receptors. To the right, a downward flowchart depicts the systemic consequences of receptor activation: stimulation of the RVLM leads to the 'Inhibition of sympathetic nerve activity,' followed by the 'Inhibition of norepinephrine' release. This progression results in 'Decreased vasoconstriction,' visually represented by an illustration of a dilated blood vessel with reduced smooth muscle tension. The final clinical outcome is identified as 'Reduced blood pressure.' The content is designed for intermediate medical education, focusing on neuropharmacology and cardiovascular physiology.
Blood Pressure Regulation
The Core Equation
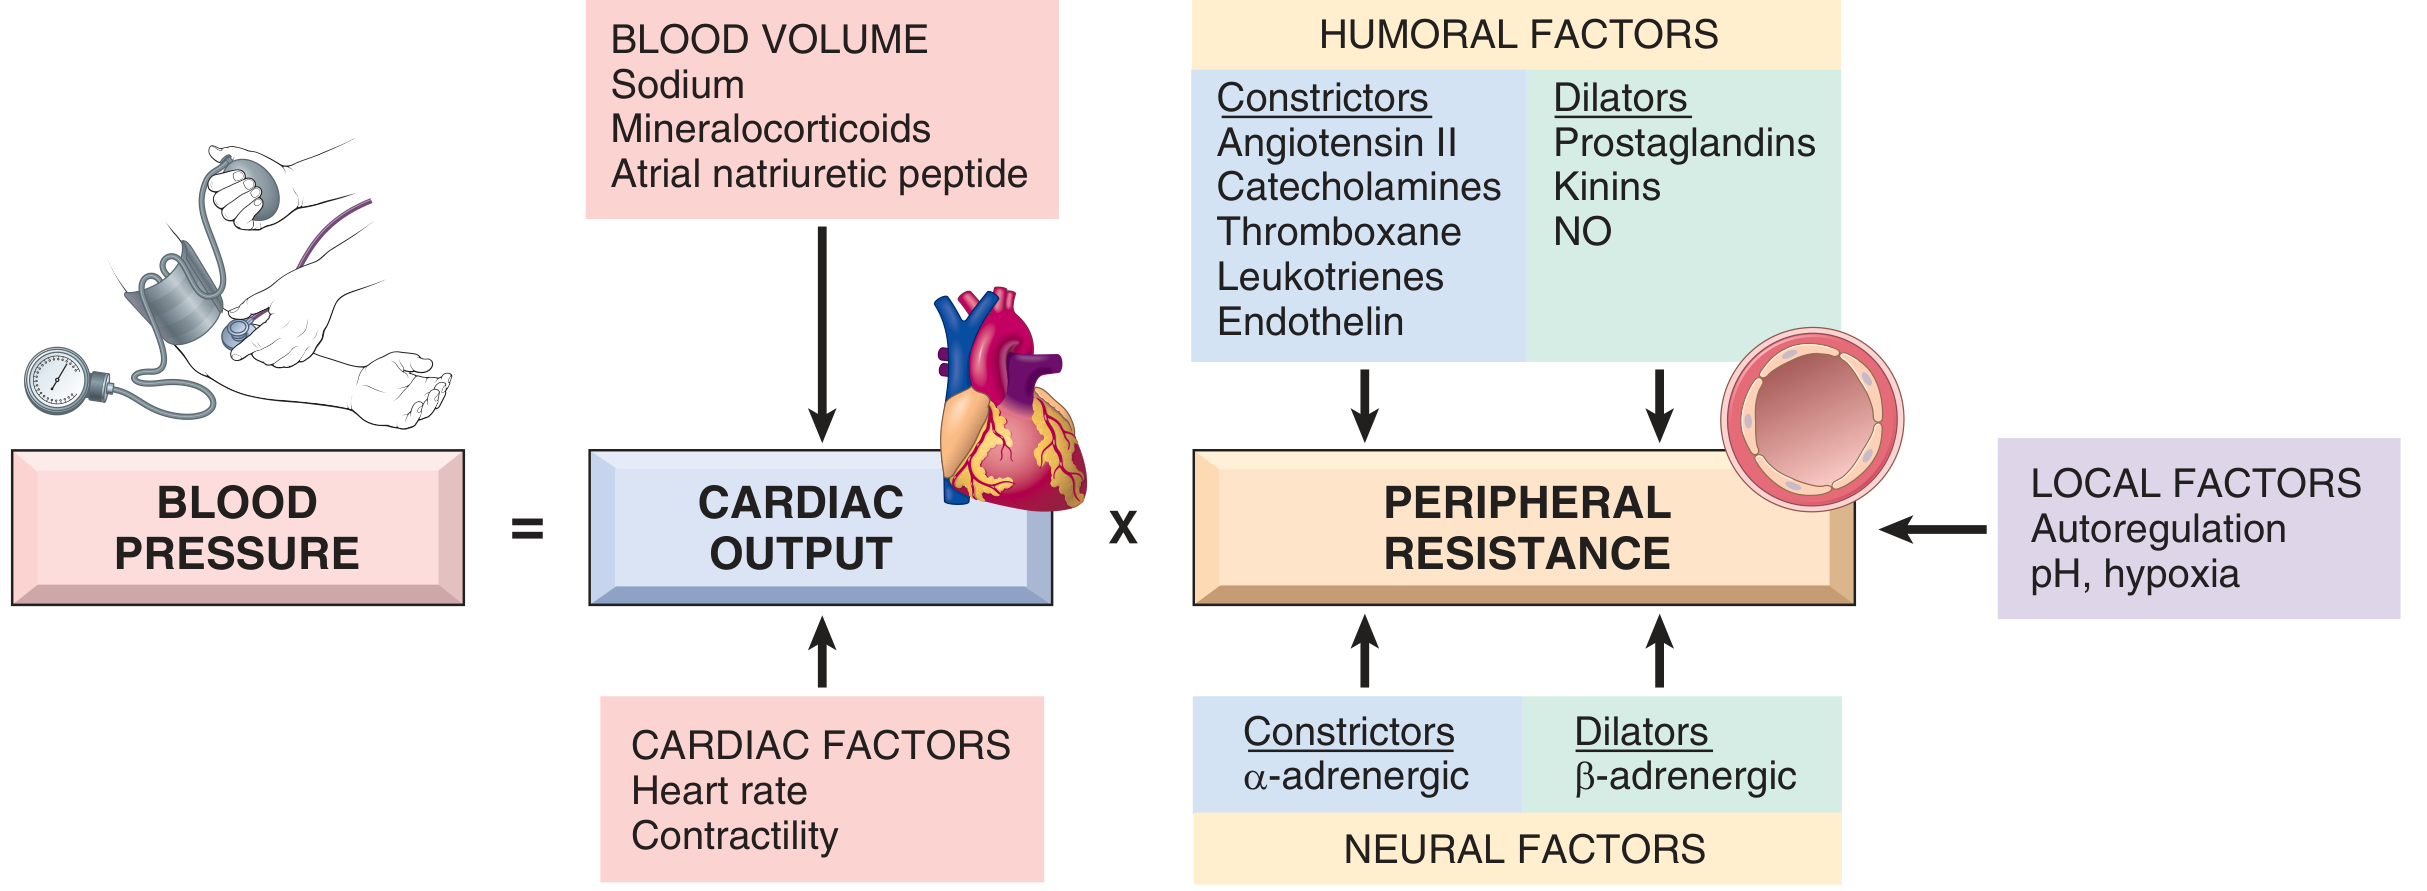
1. Cardiac Output
- Stroke volume is primarily determined by filling pressure (preload), which depends on blood volume and sodium homeostasis.
- Heart rate and myocardial contractility are controlled by the α- and β-adrenergic systems. β1-adrenergic stimulation increases both heart rate and contractility; α1-adrenergic stimulation raises vascular tone.
2. Peripheral (Vascular) Resistance
| Vasoconstrictors | Vasodilators |
|---|---|
| Angiotensin II | Prostaglandins |
| Catecholamines (α-adrenergic) | Kinins (bradykinin) |
| Endothelin | Nitric oxide (NO) |
| Thromboxane | β-adrenergic stimulation |
| Leukotrienes |
3. Sodium Homeostasis and Blood Volume
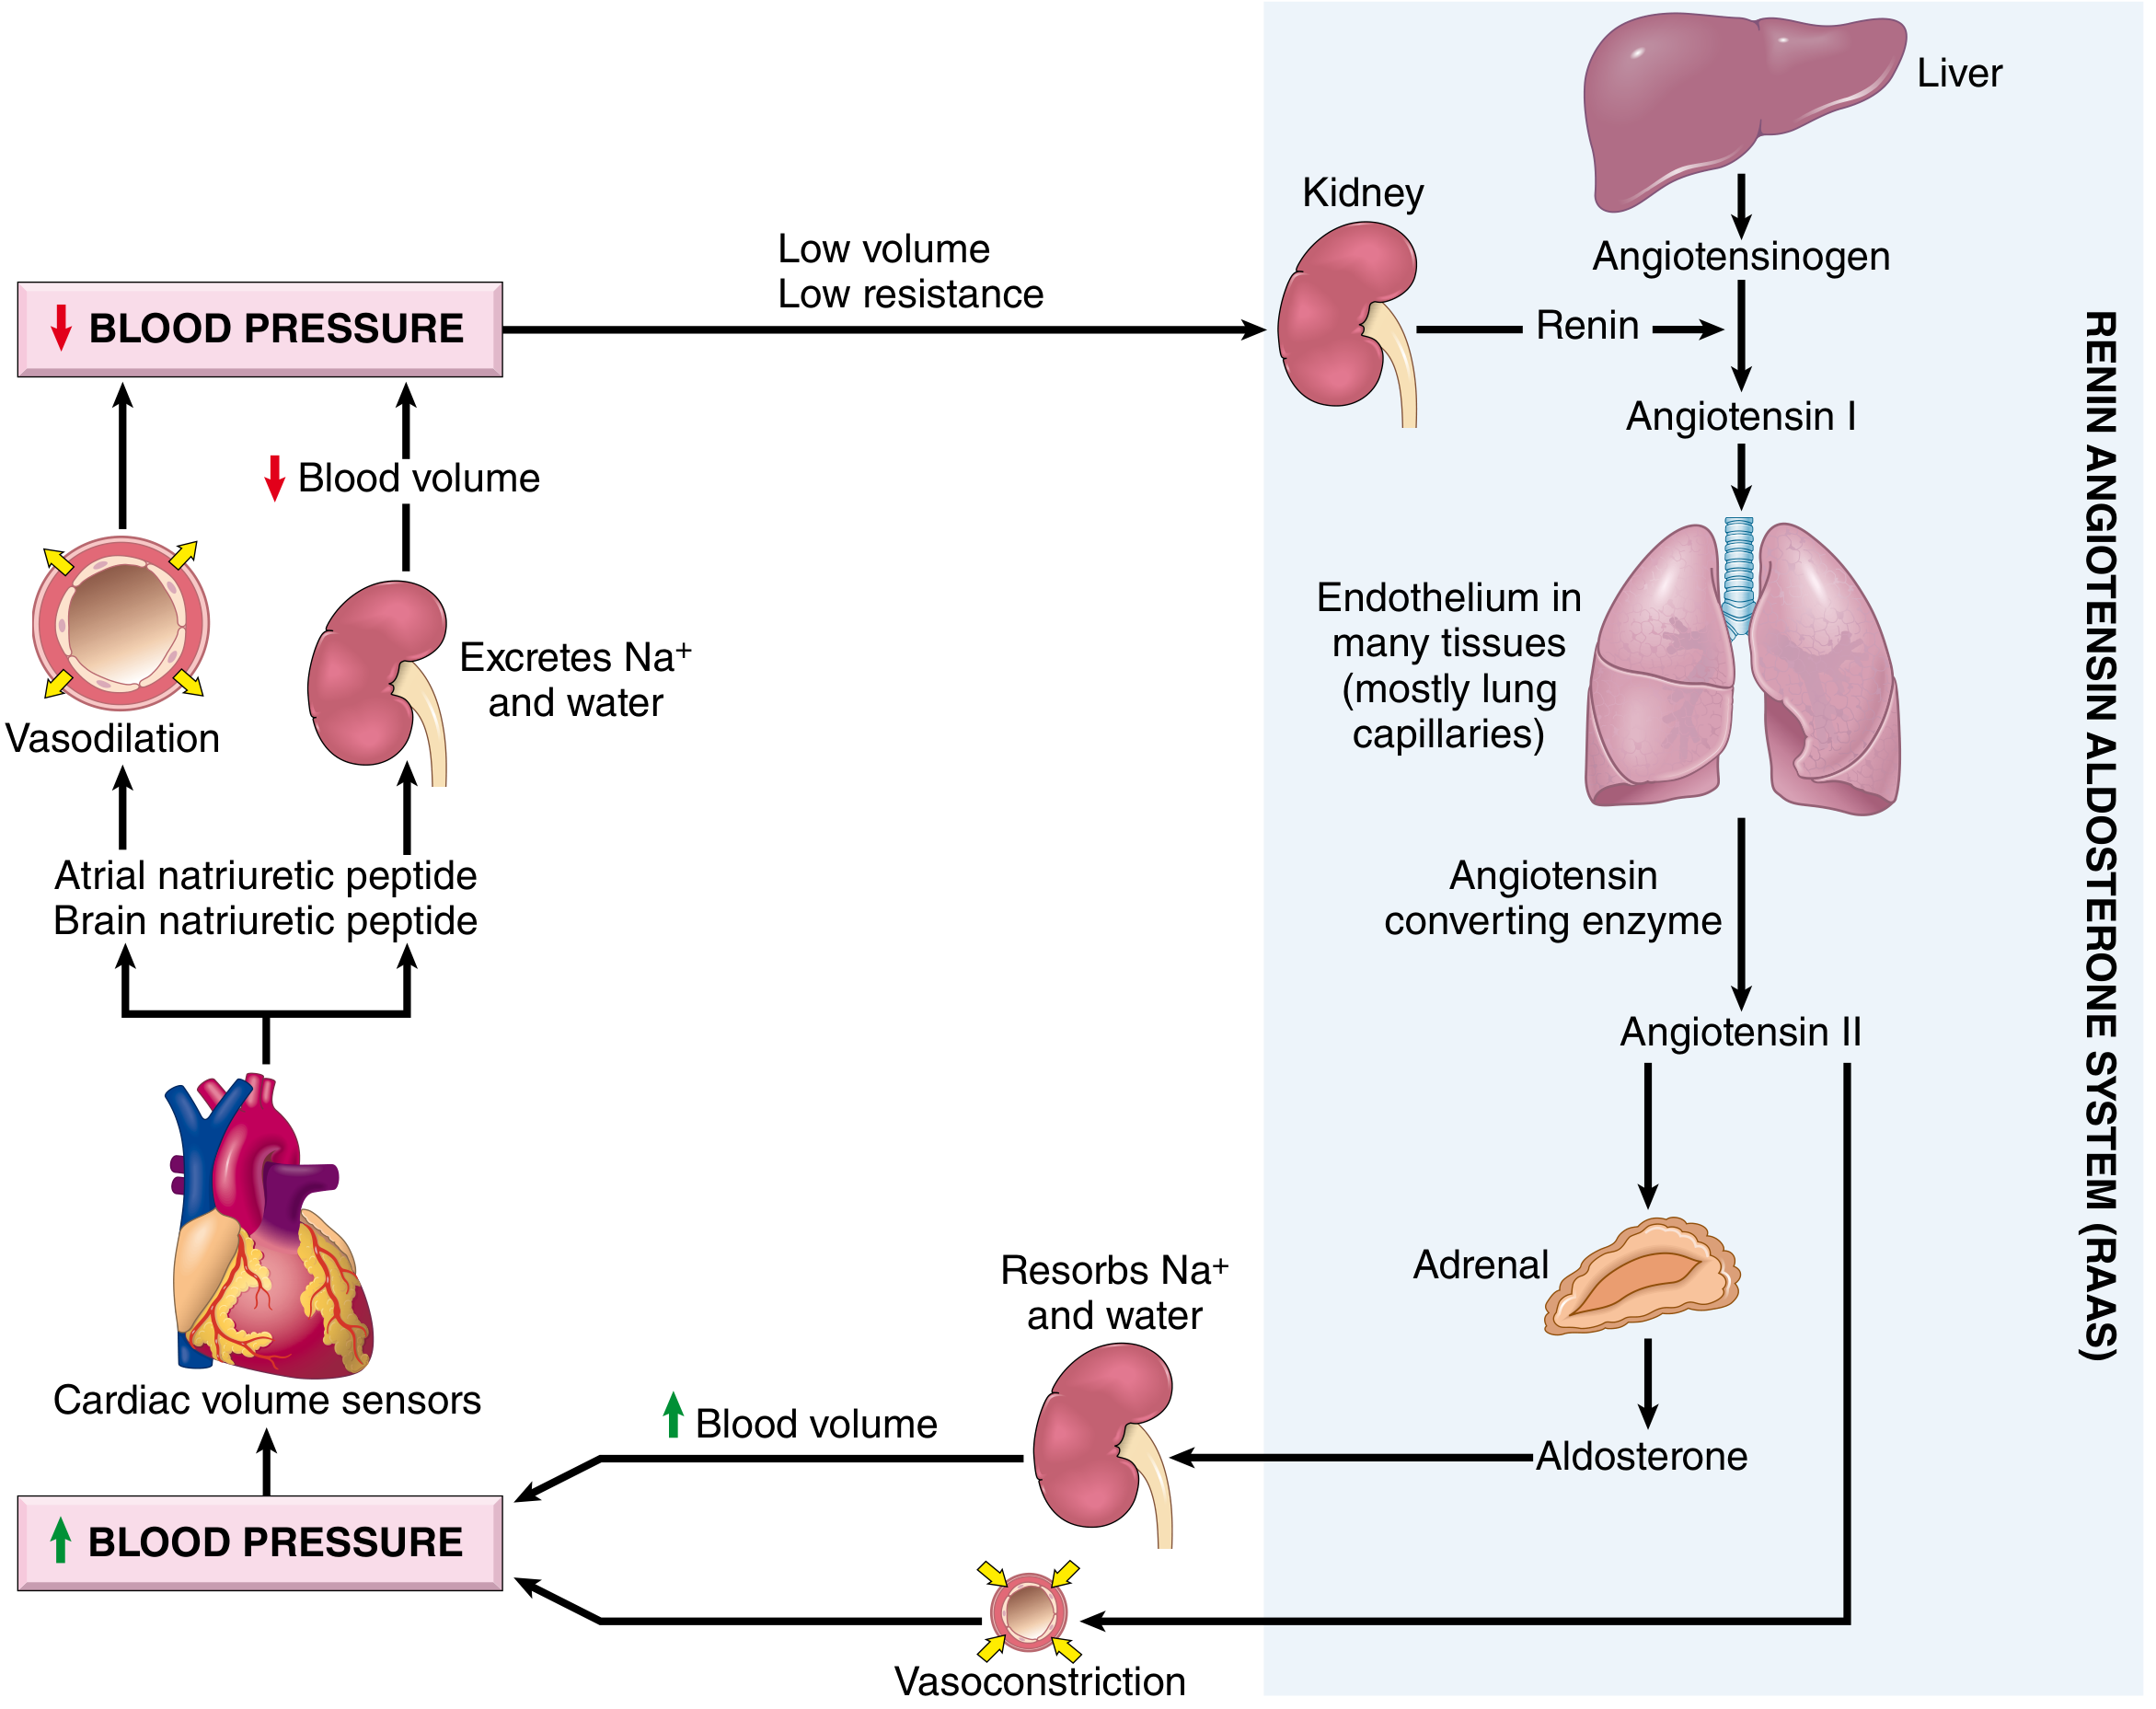
4. The Renin-Angiotensin-Aldosterone System (RAAS)
-
Renin is released from renal juxtaglomerular cells (surrounding the afferent arterioles) in response to:
- Low blood pressure/flow in afferent arterioles
- Elevated circulating catecholamines
- Low sodium in the distal convoluted tubule (e.g., when GFR falls)
-
Renin cleaves angiotensinogen (made by liver) → Angiotensin I
-
ACE (found mainly in pulmonary endothelium) converts Angiotensin I → Angiotensin II
-
Angiotensin II raises BP by three mechanisms:
- Direct vasoconstriction (raises peripheral resistance)
- Stimulates aldosterone secretion from the adrenal cortex
- Directly increases tubular sodium resorption in the kidney
-
Aldosterone acts on the distal tubule ENaC channels → resorbs Na⁺ and water → increases blood volume → raises BP
- Robbins Cotran Pathologic Basis of Disease, p. 462-463
5. Counter-Regulatory: Natriuretic Peptides
- ANP (Atrial Natriuretic Peptide): released constitutively from atrial myocardium
- BNP (B-type Natriuretic Peptide): released from ventricular myocardium in volume overload states
- Causing systemic vasodilation
- Inhibiting sodium resorption in distal renal tubules → natriuresis and diuresis
6. Short-Term Neural Control: The Baroreceptor Reflex
- Baroreceptors in the carotid sinus and aortic arch detect wall stretch (i.e., arterial pressure).
- A rise in BP → increased baroreceptor discharge → inhibits sympathetic outflow and enhances vagal (parasympathetic) tone → heart rate slows, vessels dilate → BP falls.
- A fall in BP → decreased baroreceptor discharge → allows sympathetic vasoconstriction and tachycardia → BP rises.
- Parasympathetic activity mediates rapid baroreceptor responses; sympathetic activity is more important for long-term pressure control.
- The reflex begins to fail when arterial BP falls below ~50 mmHg (e.g., severe shock).
7. Other Local Renal Factors
Summary: Integrated Control
| Mechanism | Timeframe | Primary Effect |
|---|---|---|
| Baroreceptor reflex | Seconds | Heart rate and vascular tone |
| Catecholamines (sympathetic) | Seconds-minutes | HR, contractility, vasoconstriction |
| RAAS (Angiotensin II) | Minutes-hours | Vasoconstriction + aldosterone release |
| Aldosterone (ENaC) | Hours-days | Sodium/water retention, blood volume |
| ANP/BNP | Hours | Natriuresis, vasodilation |
| Renal pressure-natriuresis | Days | Long-term volume set point |
- Robbins & Kumar Basic Pathology, p. 309
- Robbins Cotran Pathologic Basis of Disease, p. 462
- Katzung's Basic and Clinical Pharmacology, 16th Ed., p. 268
Give it in exam writing form with neural short term intermediate and long term regulation
vasomotor centre medulla cardiovascular regulation diagram
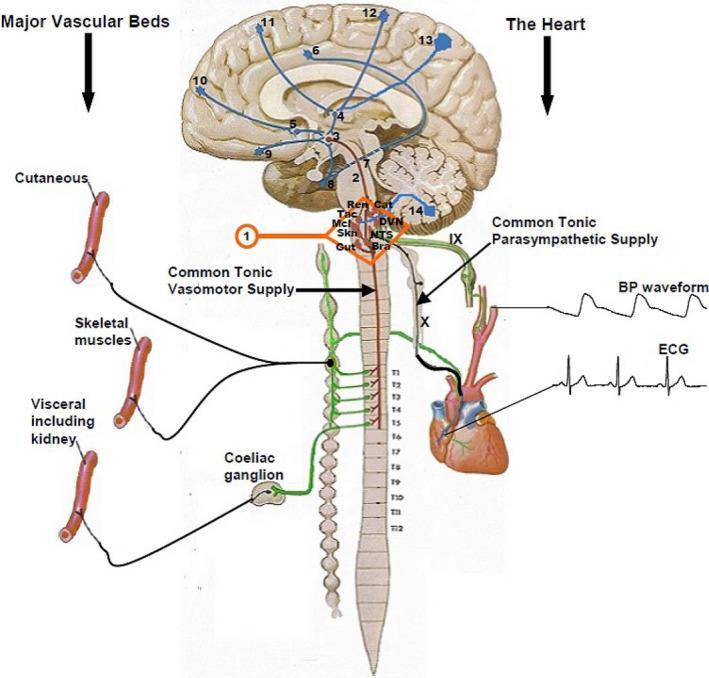
An anatomical and pathophysiology diagram illustrating the central autonomic regulation sites (CARS) within a mid-sagittal section of the human brain and spinal cord. The diagram maps 14 numbered CARS sites involved in cardiovascular control, including the prefrontal cortex, hypothalamus, and brainstem nuclei. In the medulla (CARS site 1), organotopic neurons are identified as regulating specific targets: skin (Skn), skeletal muscle (Mcl), visceral/gut (Gut), catecholamine release (Cat), and renal (Ren) systems. Key physiological pathways shown include the common tonic parasympathetic supply via the vagus nerve (X) and glossopharyngeal nerve (IX) to the heart, and the common tonic vasomotor sympathetic supply descending through the spinal cord (T1–T12). The diagram links these central pathways to major peripheral vascular beds (cutaneous, skeletal muscle, and visceral) and the heart. Educational features include representative ECG and arterial blood pressure (BP) waveforms, alongside anatomical landmarks like the coeliac ganglion, highlighting the integrated neural mechanisms of orthostatic blood pressure defense and cardiac chronotropic/inotropic regulation.
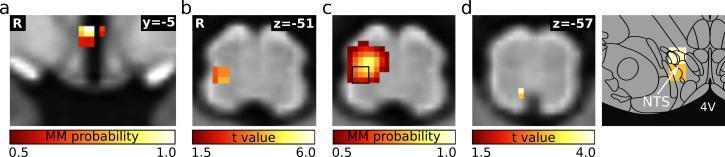
This composite diagnostic image displays functional magnetic resonance imaging (fMRI) data mapping cardiovascular regulatory centers in the human hypothalamus and brainstem. Panel (a) shows a hypothalamic cluster encompassing the paraventricular nucleus (PVN) and posterior hypothalamic area (PH) in a coronal view (y=-5). Panels (b), (c), and (d) utilize axial slices of the medulla oblongata to demonstrate connectivity changes during lower body negative pressure (LBNP). Panel (b) illustrates increased functional connectivity between the hypothalamus and a cluster in the lateral medulla (z=-51), including the rostral ventrolateral medulla (RVLM) and nucleus ambiguus (Amb), represented by t-values. Panel (c) shows a matched independent component (mICA) probability map identifying this functional cluster. Panel (d) reveals increased functional connectivity within the medulla (z=-57), specifically targeting the nucleus of the solitary tract (NTS), as further detailed in the accompanying anatomical diagram. The color scales indicate statistical significance (t-values from 1.5 to 6.0) or mixture model (MM) probability (0.5 to 1.0). This material serves to illustrate central baroreflex pathways and autonomic nervous system regulation.
REGULATION OF BLOOD PRESSURE
A. SHORT-TERM (NEURAL) REGULATION
1. Vasomotor Centre (VMC)
- Located in the reticular formation of the medulla oblongata and lower pons
- Functionally divided into:
- Vasoconstrictor area (C1, rostral VLM): tonically active; sends sympathetic impulses via the spinal cord → releases norepinephrine → acts on α1 receptors of arteriolar smooth muscle → vasoconstriction
- Vasodilator area: inhibits the vasoconstrictor area → net result is vasodilation
- Cardioinhibitory area (dorsal motor nucleus of vagus): sends parasympathetic impulses → decreases heart rate
2. Baroreceptor Reflex (Most important short-term regulator)
- High-pressure mechanoreceptors (stretch receptors) located in the:
- Carotid sinus (CN IX, Hering's nerve)
- Aortic arch (CN X, vagus)
| Event | Response |
|---|---|
| ↑ BP → vessel wall stretches | ↑ baroreceptor firing |
| Afferents → Nucleus Tractus Solitarius (NTS) | NTS activates vasodilator area + cardioinhibitory center |
| ↓ Sympathetic outflow + ↑ Parasympathetic outflow | ↓ HR, ↓ contractility, vasodilation |
| Net result | BP falls back to normal |
- ↓ baroreceptor discharge → VMC vasoconstrictor area disinhibited → sympathetic surge → tachycardia, vasoconstriction, ↑ contractility → BP restored
- Operates as a negative feedback loop
- Resets at a new set-point during sustained hypertension (baroreceptor adaptation)
- Reflex fails when arterial BP < 50 mmHg (e.g., severe hemorrhagic shock)
- Parasympathetic tone mediates the rapid component; sympathetic tone is more important for sustained control
3. Peripheral Chemoreceptor Reflex
- Afferents → medulla → vasoconstriction (positive drive on VMC) + bradycardia (cardioinhibitory center activated)
- Primarily a respiratory reflex, but has significant BP effects, especially during hypoxia/hypotension
- During hemorrhage: BP drop → reduced carotid/aortic body perfusion → local hypoxia → chemoreceptor activation → vasoconstriction (supports BP)
4. CNS Ischemic Response (Cushing Reflex)
- Triggered when cerebral blood flow becomes severely compromised (BP < 60 mmHg or raised ICP)
- Direct CO₂ accumulation in the VMC → massive sympathetic discharge
- Produces extreme vasoconstriction and hypertension
- Acts as an emergency last-resort mechanism ("last ditch" response)
- Accompanied by bradycardia (vagal reflex to the hypertension) → classic Cushing's triad: hypertension + bradycardia + irregular breathing
5. Other Short-Term Reflexes
| Reflex | Trigger | Effect on BP |
|---|---|---|
| Bainbridge reflex | ↑ venous return / atrial stretch | ↑ HR → ↑ BP |
| Bezold-Jarisch reflex | Ventricular C-fiber activation (e.g., ischemia, serotonin) | Bradycardia + vasodilation |
| Axon reflex | Local tissue injury | Local vasodilation |
| Higher cortical influences | Pain, emotion, exercise | ↑ or ↓ BP via hypothalamus → VMC |
B. INTERMEDIATE-TERM REGULATION
1. Renin-Angiotensin-Aldosterone System (RAAS) - Rapid arm
- Trigger: ↓ BP in afferent arterioles, ↑ catecholamines, ↓ NaCl at macula densa
- Renin (juxtaglomerular cells) → cleaves angiotensinogen → Angiotensin I
- ACE (pulmonary endothelium) → Angiotensin II
- Angiotensin II effects (within minutes):
- Direct vasoconstriction → ↑ PVR
- Stimulates aldosterone release (adrenal cortex) → Na⁺/water retention
- Directly increases proximal tubular Na⁺ resorption
- Stimulates ADH (vasopressin) release from posterior pituitary
2. Capillary Fluid Shift Mechanism
- When BP drops, capillary hydrostatic pressure falls
- Oncotic pressure exceeds hydrostatic pressure → net absorption of interstitial fluid into capillaries
- Can shift up to 0.5–1 L of fluid from interstitium into the circulation within 30–60 minutes
- Helps restore blood volume and cardiac output
- Explains the hemodilution seen after acute hemorrhage
3. Stress Relaxation (Reverse Stress Relaxation)
- When blood volume drops, vascular smooth muscle relaxes → vessels accommodate the reduced volume at lower pressure
- When blood volume is restored, stress relaxation reverses → vascular tone returns → supports BP
- Occurs over minutes to hours
4. Adrenal Medullary Response
- Sympathetic activation → adrenal medulla → epinephrine + norepinephrine release into circulation
- Epinephrine: ↑ HR, ↑ contractility (β1), vasodilation in skeletal muscle (β2)
- Norepinephrine: predominantly vasoconstriction (α1)
- Amplifies and sustains the acute neural response
5. Vasopressin (ADH)
- Released from posterior pituitary in response to ↓ BP (via atrial baroreceptors) and ↑ plasma osmolality
- Causes arteriolar vasoconstriction (V1 receptors)
- Causes water retention in collecting ducts (V2 receptors) → ↑ blood volume
- Important during severe hemorrhage
C. LONG-TERM REGULATION
1. Pressure Natriuresis and Pressure Diuresis (The fundamental mechanism)
- Core principle: When arterial BP rises → kidneys excrete more salt and water (natriuresis + diuresis) → ↓ blood volume → ↓ CO → BP falls back to normal
- When BP falls → kidneys retain Na⁺ and water → ↑ blood volume → ↑ CO → BP rises
- At BP 50 mmHg → urine output ≈ zero
- At BP 100 mmHg → urine output is normal
- At BP 200 mmHg → urine output is 4–6× normal
2. Renin-Angiotensin-Aldosterone System (RAAS) - Chronic arm
- Aldosterone acts on ENaC channels in the distal nephron → Na⁺ and water resorption → ↑ blood volume → ↑ BP
- RAAS amplifies the renal pressure-natriuresis curve
- Chronic RAAS suppression (by ACE inhibitors, ARBs) shifts the natriuresis curve, reducing long-term set-point BP
3. Atrial Natriuretic Peptide (ANP) and B-type Natriuretic Peptide (BNP)
- Released by atrial myocardium (ANP) and ventricular myocardium (BNP) in response to volume overload / ↑ atrial stretch
- Counter-regulatory to RAAS:
- Systemic vasodilation (↓ PVR)
- Inhibit ENaC in distal tubules → natriuresis and diuresis → ↓ blood volume → ↓ BP
- Elevated levels signal hypervolemia (e.g., congestive heart failure)
4. Aldosterone Escape and Salt Sensitivity
- Normally, chronic increases in salt intake up to 6× normal cause minimal change in BP because the kidneys upregulate natriuresis efficiently
- In salt-sensitive individuals (impaired nephrons, excess RAAS activity), this buffering is lost → BP rises with salt intake
Summary Table
| Mechanism | Onset | Duration | Effector | Max Strength |
|---|---|---|---|---|
| Baroreceptor reflex | Seconds | Minutes | Heart + vessels | Moderate |
| Chemoreceptor reflex | Seconds | Minutes | Vessels | Moderate |
| CNS ischemic response | Seconds | Minutes | Vessels | Very high |
| Adrenal medulla | Minutes | 30–60 min | Heart + vessels | Moderate |
| Capillary fluid shift | 10–30 min | Hours | Blood volume | Moderate |
| Stress relaxation | 30 min | Hours | Vascular tone | Moderate |
| RAAS (acute) | 15–30 min | Hours | Vessels + kidney | High |
| Vasopressin (ADH) | 15–30 min | Hours | Vessels + kidney | Moderate |
| RAAS + Aldosterone (chronic) | Hours | Days | Kidney (Na⁺ balance) | High |
| Pressure natriuresis | Hours | Indefinite | Kidney (ECF volume) | Infinite |
| ANP/BNP | Hours | Days | Kidney + vessels | Moderate |
Key exam point: The renal-body fluid system is the only mechanism with infinite gain - it never resets or adapts. Long-term BP is therefore ultimately determined by the kidneys. All other mechanisms are temporary buffers.
Give it in exam writing form with neural short term intermediate and long term regulation
REGULATION OF BLOOD PRESSURE
BP = Cardiac Output (CO) × Peripheral Vascular Resistance (PVR) CO = Heart Rate × Stroke Volume
I. NEURAL (SHORT-TERM) REGULATION
A. Vasomotor Centre (VMC)
- Located in the reticular formation of the medulla oblongata and lower pons
- Functionally divided into three areas:
| Area | Location | Function |
|---|---|---|
| Vasoconstrictor area (C1/RVLM) | Rostral VLM | Tonically active; sends sympathetic impulses via spinal cord → NE → α1 receptors → vasoconstriction |
| Vasodilator area | Caudal VLM | Inhibits vasoconstrictor area → net vasodilation |
| Cardioinhibitory area | Dorsal vagal nucleus / NA | Parasympathetic → ↓ HR |
- VMC receives input from all reflexes below and sends integrated efferent output to heart and vessels
B. Baroreceptor Reflex (Most important short-term mechanism)
- Carotid sinus → afferents via CN IX (Hering's nerve)
- Aortic arch → afferents via CN X (vagus)
↑ BP → vessel wall stretch
    → ↑ baroreceptor firing
    → NTS in medulla
    → activates vasodilator area + cardioinhibitory centre
    → ↓ sympathetic outflow + ↑ parasympathetic outflow
    → ↓ HR, ↓ contractility, vasodilation
    → BP returns to normal
↓ BP → ↓ baroreceptor firing
    → vasoconstrictor area disinhibited
    → ↑ sympathetic outflow
    → ↑ HR, ↑ contractility, vasoconstriction
    → BP restored
- Operates as a negative feedback loop
- Parasympathetic tone mediates the rapid component
- Sympathetic tone is more important for sustained pressure support
- Resets at a new set-point in chronic hypertension (baroreceptor adaptation)
- Fails when arterial BP < 50 mmHg (e.g., severe hemorrhagic shock)
C. Peripheral Chemoreceptor Reflex
- Afferents → NTS → medullary VMC
- Vasoconstriction (positive drive on vasoconstrictor area)
- Bradycardia (cardioinhibitory centre activated simultaneously)
- Primarily a respiratory reflex; contributes to BP support during hypoxia and hemorrhage
D. CNS Ischemic Response (Cushing Reflex)
- Triggered when cerebral perfusion fails (BP < 60 mmHg or severely raised ICP)
- CO₂ accumulates directly in the VMC → massive sympathetic discharge
- Produces extreme vasoconstriction → sharp rise in BP
- Accompanied by reflex bradycardia (vagal response to the hypertension)
- Classic triad: Hypertension + Bradycardia + Irregular respiration
- Acts as a last-resort emergency mechanism; has no regulatory role in normal physiology
E. Other Neural Reflexes (Brief)
| Reflex | Trigger | Effect |
|---|---|---|
| Bainbridge reflex | ↑ venous return / atrial stretch | ↑ HR → ↑ CO → ↑ BP |
| Bezold–Jarisch reflex | Ventricular C-fibre activation (ischaemia, toxins) | Bradycardia + vasodilation (↓ BP) |
| Higher centres (hypothalamus, cortex) | Emotion, pain, exercise | ↑ or ↓ BP via VMC |
II. INTERMEDIATE-TERM REGULATION
A. Renin-Angiotensin-Aldosterone System (RAAS) — Acute Arm
Juxtaglomerular cells → Renin release
    → Renin cleaves Angiotensinogen (liver) → Angiotensin I
    → ACE (pulmonary endothelium) → Angiotensin II
- Direct arteriolar vasoconstriction → ↑ PVR → ↑ BP
- Stimulates aldosterone from adrenal cortex → Na⁺/water retention
- Directly ↑ proximal tubular Na⁺ resorption
- Stimulates ADH (vasopressin) release from posterior pituitary
B. Vasopressin (ADH)
- Released from posterior pituitary in response to ↓ BP (low-pressure atrial receptors) and ↑ plasma osmolality
- V1 receptors: arteriolar vasoconstriction → ↑ PVR
- V2 receptors: water reabsorption in collecting ducts → ↑ blood volume
- Especially important in severe haemorrhage
C. Adrenal Medullary Response
- Sustained sympathetic activation → adrenal medulla → epinephrine + norepinephrine into circulation
- Epinephrine: ↑ HR, ↑ contractility (β1); vasodilation in skeletal muscle (β2)
- Norepinephrine: predominant vasoconstriction (α1)
- Amplifies and prolongs the acute neural response over 30–60 minutes
D. Transcapillary (Capillary) Fluid Shift
- When BP drops → capillary hydrostatic pressure falls
- Oncotic pressure now exceeds hydrostatic pressure
- Net absorption of interstitial fluid into capillaries (up to 0.5–1 L in 30–60 min)
- Restores plasma volume and cardiac output
- Explains haemodilution seen after acute haemorrhage
E. Stress Relaxation (Vascular Stress Relaxation)
- When blood volume drops, vascular smooth muscle relaxes → vessels accommodate reduced volume at a lower wall tension → buffers the fall in BP
- When volume is restored, reverse stress relaxation occurs → vascular tone returns gradually
- Operates over minutes to hours; particularly important in veins (capacitance vessels)
III. LONG-TERM REGULATION
A. Pressure Natriuresis and Pressure Diuresis (The fundamental long-term mechanism)
| Arterial Pressure | Urine Output |
|---|---|
| 50 mmHg | ≈ Zero |
| 100 mmHg | Normal |
| 200 mmHg | 4–6× normal |
↑ BP
    → ↑ renal perfusion pressure
    → ↑ Na⁺ and water excretion (natriuresis + diuresis)
    → ↓ ECF and blood volume
    → ↓ venous return → ↓ CO
    → BP returns to normal set-point
↓ BP → ↓ renal output → ↑ blood volume → ↑ CO → BP rises
B. RAAS — Chronic Arm (Aldosterone)
- Aldosterone acts on ENaC channels in the distal nephron
- Increases Na⁺ (and water) resorption → ↑ blood volume → ↑ CO → ↑ BP
- RAAS amplifies the pressure–natriuresis relationship
- Chronic blockade (ACE inhibitors, ARBs, spironolactone) lowers the long-term BP set-point
C. Atrial and B-type Natriuretic Peptides (ANP/BNP) (Counter-regulatory)
- ANP: released constitutively from atrial myocardium
- BNP: released from ventricular myocardium in volume overload states
- Systemic vasodilation (↓ PVR)
- Inhibit ENaC in distal tubules → natriuresis and diuresis → ↓ blood volume → ↓ BP
- Inhibit renin and aldosterone secretion directly
- Elevated ANP/BNP = hypervolaemia (hallmark of congestive heart failure)
D. Salt Sensitivity and Kidney Mass
- In healthy individuals, salt intake varying from 1/6 to 6× normal produces minimal change in BP because pressure natriuresis buffers the load
- Salt-sensitive hypertension occurs when the natriuresis curve is blunted:
- Loss of functional nephrons (diabetes, CKD, ageing)
- Excess RAAS activity (primary aldosteronism)
- Genetic variants in renal sodium transporters
SUMMARY TABLE
| Mechanism | Onset | Duration | Primary Effector | Gain |
|---|---|---|---|---|
| SHORT-TERM | ||||
| Baroreceptor reflex | Seconds | Minutes | Heart + arterioles | Moderate |
| Chemoreceptor reflex | Seconds | Minutes | Arterioles | Moderate |
| CNS ischemic response | Seconds | Minutes | Arterioles | Very high |
| INTERMEDIATE | ||||
| Adrenal medulla (catecholamines) | 20–30 s | 30–60 min | Heart + vessels | Moderate |
| Transcapillary fluid shift | 10–30 min | 1–2 h | Plasma volume | Moderate |
| Stress relaxation | 30 min | Hours | Capacitance vessels | Low |
| RAAS — Ang II (vasoconstriction) | 15–30 min | Hours | Arterioles + kidney | High |
| Vasopressin (ADH) | 15–30 min | Hours | Arterioles + kidney | Moderate |
| LONG-TERM | ||||
| RAAS — Aldosterone (Na⁺ retention) | Hours | Days | Kidney (ENaC) | High |
| Pressure natriuresis/diuresis | Hours | Indefinite | Kidney (ECF vol.) | Infinite |
| ANP/BNP (counter-regulatory) | Hours | Days | Kidney + arterioles | Moderate |
Exam high-yield point: The renal pressure–natriuresis system is the only mechanism with infinite gain and is therefore the ultimate determinant of long-term blood pressure. All short- and intermediate-term mechanisms are buffers that buy time until the renal system reaches equilibrium.