
COPD
COPD emphysema chest X-ray hyperinflation barrel chest
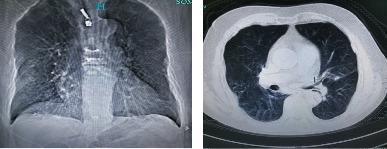
This diagnostic image pair displays thoracic radiology findings in an 80-year-old male with Chronic Obstructive Pulmonary Disease (COPD). The left panel shows a frontal chest radiograph (X-ray) exhibiting hallmark signs of hyperinflation, including a widened anteroposterior diameter and flattened diaphragmatic domes. Both lung fields demonstrate sparse bronchovascular markings and increased lucency, indicative of diffuse emphysema. The right panel shows an axial CT scan of the thorax, further characterizing the pulmonary pathology. It reveals significant emphysematous destruction of the lung parenchyma with the presence of multiple bullae and areas of decreased attenuation. Additionally, subtle interstitial lesions are visible. The imaging illustrates the classic presentation of severe COPD, characterized by permanent enlargement of airspaces distal to the terminal bronchioles and associated structural changes to the chest wall often described as a barrel chest.
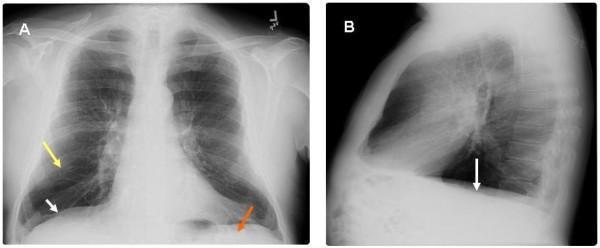
This diagnostic image displays a two-panel chest roentgenogram (X-ray) from a 65-year-old male, highlighting radiographic features of severe pulmonary emphysema and chronic obstructive pulmonary disease (COPD). Panel A presents a postero-anterior (PA) view, while Panel B provides a lateral view. Key findings include significant hyperinflation of the lung fields with marked flattening of the hemidiaphragms (indicated by white arrows), which loss their normal convex shape. In Panel A, a yellow arrow identifies areas of increased translucency and attenuation of vascular markings consistent with emphysematous parenchymal changes. A red arrow highlights the decreased zone of apposition, representing the diminished area where the diaphragm sits parallel to the inner rib cage. Panel B further illustrates the flattened diaphragmatic contour and an increased retrosternal clear space, reflecting an increased anterior-posterior thoracic diameter (barrel chest). These visual markers are clinically significant as they correlate with the mechanical basis of Hoover's sign, where the horizontal orientation of the diaphragm causes inward rib cage retraction during inspiration.
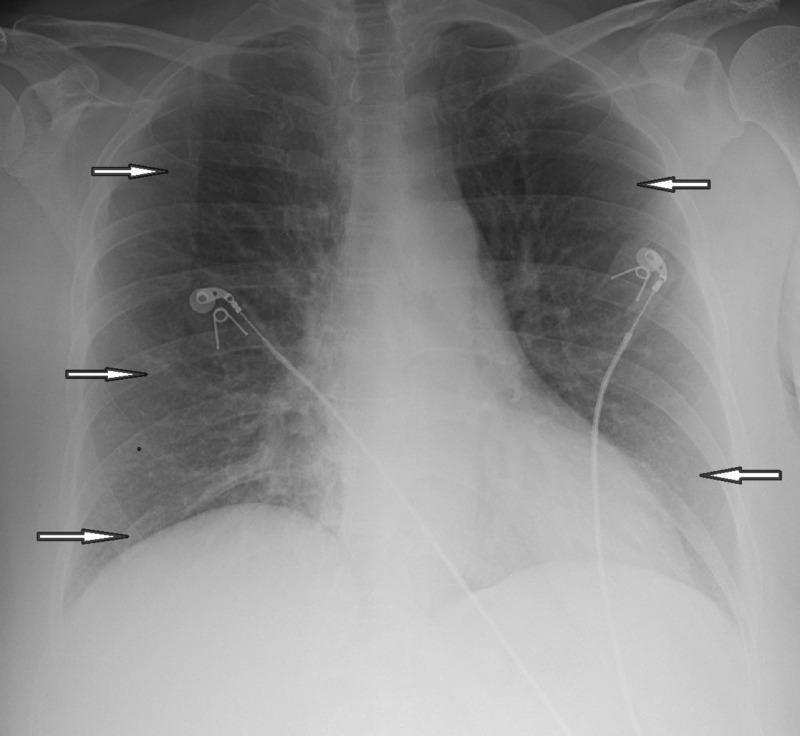
This diagnostic image is a posterior-anterior (PA) view chest X-ray illustrating radiological signs of chronic obstructive pulmonary disease (COPD), specifically emphysema. The lung fields exhibit diffuse hyperlucency and signs of hyperinflation, characterized by the flattening of the diaphragmatic domes bilaterally. Multiple white arrows point to areas of increased pulmonary lucency with a relative paucity of vascular markings, consistent with emphysematous parenchyma. There is no evidence of focal consolidation, pleural effusion, or pneumothorax. The cardiomediastinal silhouette and hilar contours appear within normal limits for this view. External medical devices are present, including cardiac monitoring leads and electrodes overlying the mid-thoracic region. The skeletal structures, including the ribs and clavicles, are intact. This image serves as a clinical example for medical students to recognize signs of obstructive lung disease and the visual presentation of pulmonary air-trapping on conventional radiography.
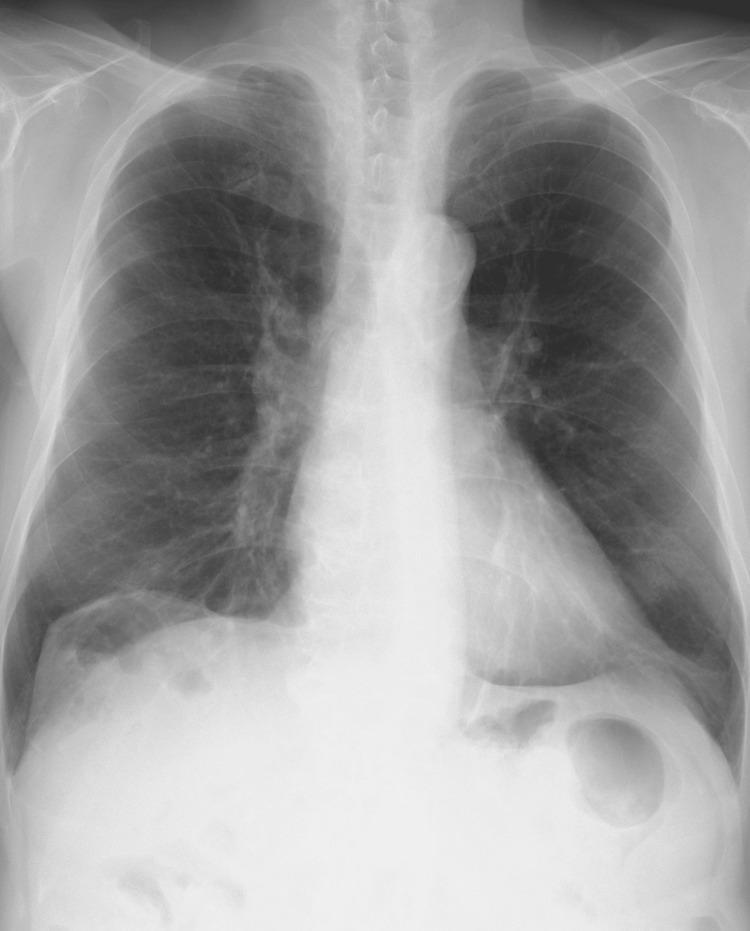
This diagnostic image is a posteroanterior (PA) chest X-ray demonstrating classic radiographic features of Chronic Obstructive Pulmonary Disease (COPD) and pulmonary emphysema. The lungs exhibit marked hyperinflation, characterized by an increased lung volume and a vertical orientation of the heart (narrowed cardiac silhouette). Key anatomical findings include significant bilateral flattening of the diaphragmatic domes and an increased number of visible anterior ribs (greater than seven), indicating air trapping. There is a notable pruning of the peripheral pulmonary vascular markings, with increased lucency in the lung fields suggestive of parenchymal destruction. The mediastinum appears relatively narrow, and the hilar structures are prominent. These findings are clinically significant as they illustrate the mechanical disadvantages placed on respiratory muscles due to chronic hyperinflation and decreased elastic recoil. The image serves as a textbook example for medical students and clinicians to identify obstructive lung disease manifestations on plain film radiography.
"COPD" AND "management guidelines"
COPD pathology emphysema centriacinar panacinar histology

This diagnostic image consists of four high-resolution computed tomography (HRCT) axial sections of the lung parenchyma, illustrating the primary radiological patterns of emphysema in Chronic Obstructive Pulmonary Disease (COPD). Images A and B demonstrate centriacinar emphysema, characterized by small, focal areas of low attenuation (lucent airspaces) located in the center of the secondary pulmonary lobules, typically surrounding the central bronchovascular bundle. Image C displays panacinar emphysema, showing a more uniform and diffuse destruction of the entire acinus, resulting in generalized lung hyperlucency and attenuation of the pulmonary vasculature. Image D illustrates paraseptal emphysema (distal acinar emphysema), where focal lucent airspaces are distributed preferentially along the subpleural surfaces and interlobular septa, often demarcated by thin walls. Key educational concepts include the distinction between lobular distributions and the resulting architectural distortion and vascular attenuation associated with progressive alveolar wall destruction.
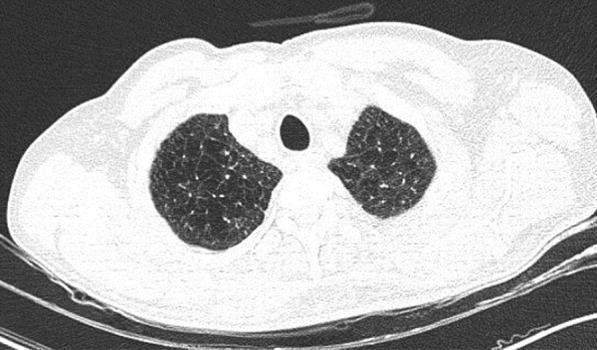
This diagnostic image is an axial non-contrast high-resolution computed tomography (HRCT) scan of the thorax at the level of the upper lobes. The image demonstrates bilateral, diffuse, and homogeneous areas of abnormally decreased lung attenuation (hyperlucency). These findings are characteristic of panacinar (panlobular) emphysema, where there is a uniform destruction of the pulmonary acinus. Key features include a simplified lung architecture with a notable paucity of pulmonary vascular markings throughout the affected parenchyma. Unlike centriacinar emphysema, which often shows focal areas of low attenuation, this presentation shows a generalized darkening of the lung fields without well-defined walls or cystic structures. No acute infiltrates, ground-glass opacities, or consolidations are present, which in a clinical context (such as COVID-19 screening) helps differentiate chronic obstructive pulmonary disease (COPD) from acute infectious processes. The image serves as a classic educational example of end-stage alveolar destruction and hyperinflation seen in severe emphysema.
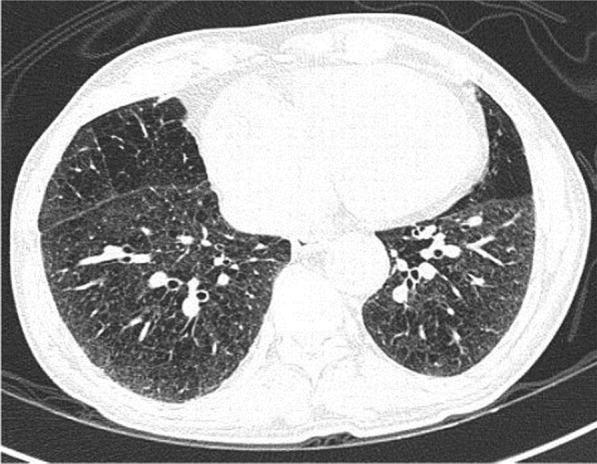
This diagnostic image is an axial non-contrast chest CT scan at the level of the lower lobes, demonstrating characteristic features of panacinar emphysema. The lung parenchyma exhibits a diffuse, generalized decrease in attenuation (hypodensity) bilaterally, resulting in a significantly darker appearance than normal lung tissue. Structurally, there is extensive destruction of the alveolar walls, leading to the formation of numerous small, round, and irregularly shaped airspaces that give the parenchyma a coarse, 'swiss cheese' or porous texture. Unlike centriacinar emphysema which typically affects the upper lobes, these changes are distributed uniformly across the visible lung segments without regional predilection. Key landmarks include the central mediastinum with a visible heart and descending aorta, and the bilateral major fissures. There is a notable absence of peripheral ground-glass opacities or consolidations, distinguishing this chronic obstructive pulmonary disease (COPD) manifestation from acute infectious processes like COVID-19 bronchopneumonia.
Chronic Obstructive Pulmonary Disease (COPD)
Definition
- Robbins & Kumar Basic Pathology, p. 447
- Goldman-Cecil Medicine, p. 890
Epidemiology
- Affects >10% of U.S. adults over age 40; estimated global prevalence of 175 million
- Third leading cause of death worldwide (~3.2 million deaths/year)
- ~80% of COPD is attributable to cigarette smoking; 35-50% of heavy smokers develop COPD
- Women appear more susceptible than men
- Other risk factors: biomass fuel combustion, occupational dust (mines, grain, cotton), poor lung development in childhood, airway hyperresponsiveness, and alpha-1-antitrypsin (AAT) deficiency (genetic)
Pathology: Two Main Patterns
1. Emphysema
| Type | Distribution | Key Association |
|---|---|---|
| Centriacinar (centrilobular) | Central/proximal acinus; upper lobes; spares distal alveoli | Cigarette smoking (20x more common than panacinar) |
| Panacinar (panlobular) | Entire acinus uniformly; lower lobes | AAT deficiency |
| Distal acinar (paraseptal) | Near pleura and lobular septa; upper zones | Young adults with spontaneous pneumothorax |
| Irregular | Acinus irregularly involved | Scarring; usually clinically insignificant |
2. Chronic Bronchitis
Pathogenesis
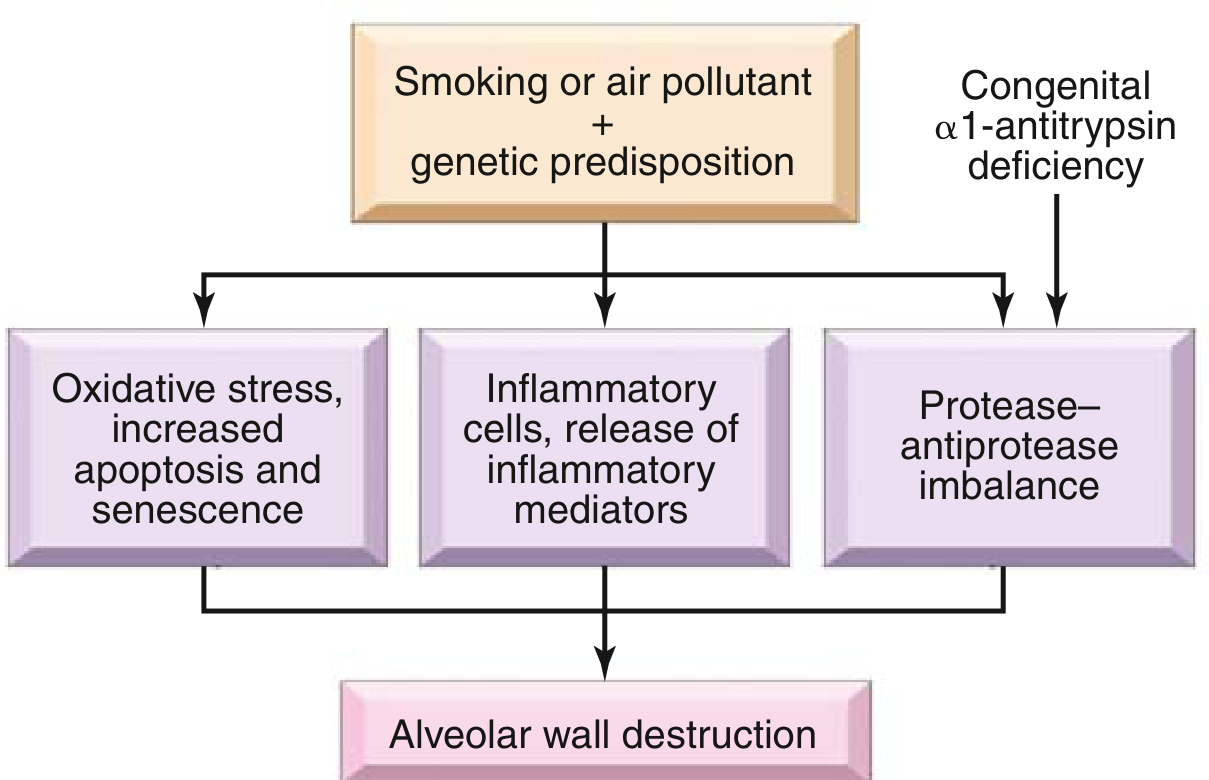
- Protease-antiprotease imbalance - neutrophil elastase, matrix metalloproteinases (MMPs), and macrophage proteases degrade connective tissue. Patients with AAT deficiency lack the key antiprotease buffer.
- Oxidative stress - reactive oxygen species from cigarette smoke and inflammatory cells cause direct tissue damage and amplify inflammation.
- Inflammatory cell recruitment - LTB4, IL-8, TNF-alpha recruit neutrophils, macrophages, and CD4+/CD8+ T cells; bacterial/viral infections trigger acute exacerbations.
COPD Phenotypes: "Pink Puffer" vs. "Blue Bloater"
| Feature | Pink Puffer (emphysema-predominant) | Blue Bloater (bronchitis-predominant) |
|---|---|---|
| Build | Thin, cachectic | Obese/overweight |
| Cyanosis | Absent (maintains O2 by hyperventilating) | Present |
| Sputum | Minimal | Copious, purulent |
| Hypercapnia | Late | Early |
| Cor pulmonale | Late | Earlier |
| OSA risk | Lower (hyperinflation protects upper airway) | Higher (obesity + lower respiratory drive) |
Clinical Features
- Progressive exertional dyspnea (cardinal symptom)
- Chronic productive cough
- Wheezing; chest tightness
- Early disease: normal exam
- Moderate-severe disease: prolonged expiratory phase, expiratory wheezing
- Hyperinflation signs: barrel chest, enlarged lung volumes, poor diaphragmatic excursion on percussion
- Accessory muscle use (sternocleidomastoid, scalenes, intercostals); tripod positioning
- Cyanosis (lips, nail beds)
- Advanced: cachexia, weight loss, signs of cor pulmonale (right heart failure)
- Clubbing is NOT a sign of COPD - its presence should prompt evaluation for lung cancer or other causes
Radiology
Chest X-ray Findings (Classic COPD/Emphysema):
- Bilateral lung hyperinflation with flattened hemidiaphragms
- Increased AP diameter (barrel chest on lateral view)
- Increased retrosternal clear space
- Pruning of peripheral vascular markings
-
7 anterior ribs visible (air trapping)
CT Patterns of Emphysema:
- Centriacinar: focal low-attenuation areas around central bronchovascular bundles; upper lobe predominant
- Panacinar: diffuse uniform hyperlucency, paucity of vascular markings
- Paraseptal: subpleural/septal-based lucencies, may form bullae
Pulmonary Function Tests (PFT)
| Parameter | Finding in COPD |
|---|---|
| FEV1/FVC (post-bronchodilator) | < 0.7 (diagnostic) |
| FEV1 | Reduced (graded by GOLD) |
| TLC, FRC, RV | Increased (hyperinflation, air trapping) |
| DLCO | Reduced in emphysema (parenchymal destruction) |
GOLD Classification & ABE Assessment Tool
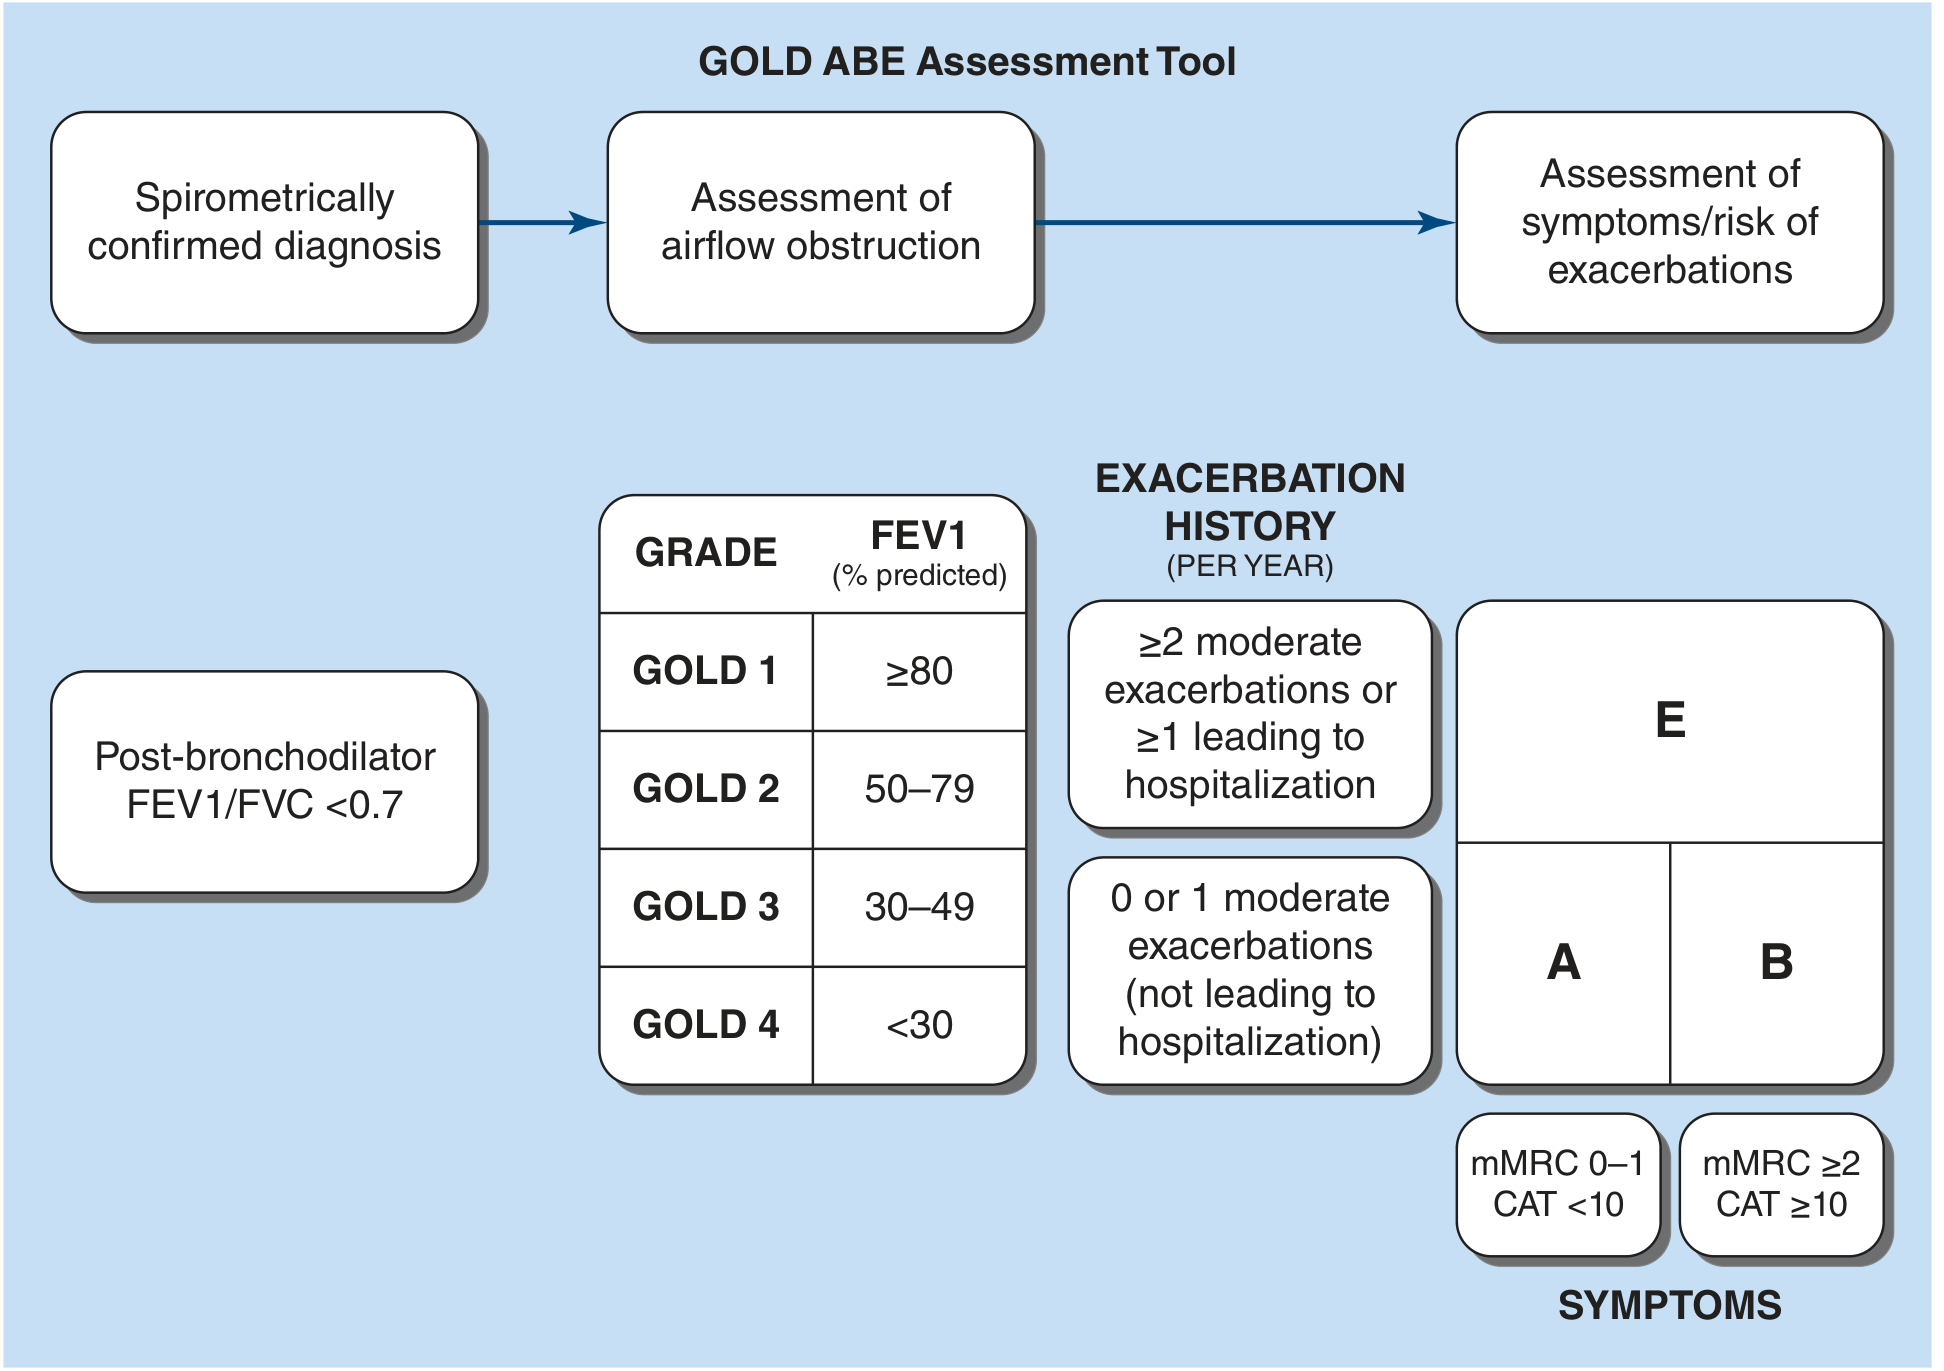
| Grade | FEV1 |
|---|---|
| GOLD 1 (Mild) | ≥80% |
| GOLD 2 (Moderate) | 50-79% |
| GOLD 3 (Severe) | 30-49% |
| GOLD 4 (Very Severe) | <30% |
- Group A: Low symptoms (mMRC 0-1, CAT <10) + 0-1 moderate exacerbations, no hospitalization
- Group B: High symptoms (mMRC ≥2, CAT ≥10) + 0-1 moderate exacerbations, no hospitalization
- Group E: ≥2 moderate exacerbations OR ≥1 leading to hospitalization (regardless of symptom burden)
Management
Interventions That Improve Survival
- Smoking cessation - slows FEV1 decline; the single most effective intervention
- Long-term oxygen therapy (LTOT) - in chronically hypoxemic patients (PaO2 ≤55 mmHg or SpO2 ≤88%)
- Lung volume reduction surgery (LVRS) - in selected emphysema patients (upper-lobe predominant, low post-rehabilitation exercise capacity)
- Triple inhaled therapy (LABA + LAMA + ICS) - reduces mortality in selected patients
- Pulmonary rehabilitation after hospitalization, NIV in severe hypercapnia, lung transplantation
Pharmacotherapy
Bronchodilators (primary treatment for almost all patients)
| Class | Agents | Key Points |
|---|---|---|
| Short-acting muscarinic antagonist (SAMA) | Ipratropium | Acute symptom relief; improves FEV1 |
| Long-acting muscarinic antagonist (LAMA) | Tiotropium, umeclidinium, glycopyrronium, aclidinium, glycopyrrolate, revefenacin | Reduces symptoms + exacerbations; side effect: dry mouth |
| Short-acting beta-2 agonist (SABA) | Salbutamol, albuterol | Rapid symptom relief |
| Long-acting beta-2 agonist (LABA) | Salmeterol, formoterol, indacaterol, olodaterol, arformoterol, vilanterol | Symptom benefit + exacerbation reduction; side effects: tremor, tachycardia |
| LABA + LAMA combination | Multiple fixed-dose combinations | Superior to monotherapy for symptoms and exacerbations |
Inhaled Corticosteroids (ICS)
- Added in Group E patients (frequent exacerbators) or those with elevated blood eosinophils
- Triple therapy (LABA + LAMA + ICS) reduces exacerbations, hospitalizations, and mortality
- Caution: increased pneumonia risk; blood eosinophil count guides who benefits most
Other Agents
- Roflumilast (PDE4 inhibitor) - for frequent exacerbators with chronic bronchitis phenotype
- Azithromycin (prophylactic) - reduces exacerbation frequency in selected patients
- Theophylline - modest bronchodilation; narrow therapeutic window; less commonly used
- AAT augmentation therapy - for patients with documented AAT deficiency
Smoking Cessation Pharmacotherapy
- Nicotine replacement therapy (patch, gum, lozenge, inhaler, nasal spray)
- Varenicline (most effective) - nicotinic acetylcholine receptor partial agonist
- Bupropion - second-line option
Non-Pharmacologic Management
| Intervention | Indication |
|---|---|
| Pulmonary rehabilitation | All symptomatic patients (especially after exacerbation) |
| Long-term oxygen (LTOT) | PaO2 ≤55 mmHg; SpO2 ≤88%; or ≥88% with cor pulmonale/polycythemia |
| Non-invasive ventilation (NIV/BiPAP) | Severe hypercapnia (PaCO2 >55 mmHg); acute exacerbations with hypercapnic failure |
| LVRS | Upper-lobe emphysema + low post-rehab exercise capacity |
| Lung transplantation | End-stage COPD, selected candidates |
| Vaccination | Influenza annually; pneumococcal; COVID-19; RSV (in older adults) |
Comorbidities
- Cardiovascular disease (most common cause of death in milder COPD)
- Lung cancer (shared risk factor: smoking; new clubbing = investigate)
- Pulmonary hypertension - mild PH is common in stable COPD (mPAP >25 mmHg in ~35% with severe disease); severe PH (mPAP ≥40 mmHg) is uncommon (~2.7%) and often has another contributing cause
- OSA-COPD overlap syndrome - at least 1% of the general population; high risk for hypercapnia, hypoxemia, and PH
- Osteoporosis, depression/anxiety, cachexia, GERD, frailty
Acute Exacerbations of COPD (AECOPD)
- Short-acting bronchodilators (SABA + SAMA) - cornerstone
- Systemic corticosteroids (prednisolone 40 mg for 5 days) - reduces recovery time and treatment failure
- Antibiotics - when purulent sputum, increased dyspnea, or increased sputum volume (Anthonisen criteria)
- Controlled oxygen - target SpO2 88-92% (avoid hyperoxygenation and risk of hypercapnia)
- NIV (BiPAP) - strong recommendation for hypercapnic exacerbations (pH < 7.35, PaCO2 > 45 mmHg); reduces need for intubation and mortality
- Invasive mechanical ventilation - when NIV fails or is contraindicated (hemodynamic instability, loss of consciousness, uncontrolled secretions)
Prognostic Indices
| Index | Components |
|---|---|
| BODE Index | BMI, Obstruction (FEV1%), Dyspnea (mMRC), Exercise (6MWT) |
| GOLD Grade | FEV1 % predicted |
| GOLD Group (ABE) | Symptoms + exacerbation history |
Give history of a COPD patient
What is this history for? · Which severity/stage of COPD?
Medical Case Presentation: COPD (GOLD Grade 3 - Severe)
PATIENT DETAILS
- Name: Mr. Ramesh Kumar (fictional)
- Age: 62 years
- Sex: Male
- Occupation: Retired textile mill worker
- Residence: Urban
- Informant: Patient himself (reliable historian)
- Date of admission: July 25, 2026
CHIEF COMPLAINTS
- Worsening breathlessness for 15 years, acutely worse over 5 days
- Chronic productive cough for 12 years
- Increased sputum production and change in sputum color for 5 days
- Bilateral ankle swelling for 3 months
HISTORY OF PRESENTING ILLNESS
PAST MEDICAL HISTORY
| Condition | Duration / Details |
|---|---|
| COPD | Diagnosed 8 years ago; GOLD Grade 3, Group B |
| Hypertension | 10 years; on amlodipine 5 mg OD |
| Type 2 Diabetes Mellitus | 6 years; on metformin 500 mg BD |
| Previous AECOPD hospitalizations | 2 admissions in the last 12 months (one requiring NIV) |
| No history of asthma, TB, or bronchiectasis | - |
| No prior surgery | - |
DRUG HISTORY
| Drug | Dose | Route | Duration |
|---|---|---|---|
| Tiotropium (LAMA) | 18 mcg | Inhaled OD | 4 years |
| Salmeterol/Fluticasone (LABA/ICS) | 50/500 mcg | Inhaled BD | 3 years |
| Salbutamol (SABA - rescue) | 100 mcg | Inhaled PRN | 5 years |
| Amlodipine | 5 mg | Oral OD | 10 years |
| Metformin | 500 mg | Oral BD | 6 years |
SMOKING HISTORY
- Current smoker (never fully quit)
- Began smoking at age 18; smoked 20 cigarettes/day for 30 years, then reduced to 10/day over the last 14 years
- Pack-year history: approximately 40 pack-years (20 cig/day × 20 years + 10 cig/day × 14 years = ~27 pack-years: approximately 35-40 pack-years)
- Brief quit attempt 4 years ago (lasted 3 months); offered varenicline at that time
- Still smokes 8-10 cigarettes per day currently
OCCUPATIONAL & ENVIRONMENTAL HISTORY
- Worked in a textile mill for 25 years (1984-2009) with regular exposure to cotton dust and chemical fumes without adequate respiratory protection
- Biomass fuel: used wood-burning stove for cooking in early life (first 20 years)
- Now lives in an urban apartment with gas cooking; moderate ambient air pollution in his residential area
FAMILY HISTORY
- Father: died of "lung disease" (possibly emphysema, unconfirmed)
- Mother: hypertension
- No family history of asthma or early-onset emphysema (alpha-1-antitrypsin deficiency not formally tested)
SOCIAL HISTORY
- Alcohol: Occasional (social; 1-2 units/week)
- Marital status: Married; wife is his primary carer
- Living conditions: Ground floor flat (climbs no stairs, has modified home environment due to breathlessness)
- Activities: Previously enjoyed gardening; now largely housebound
- Financial: Retired with pension; has health insurance coverage
- Depression/Anxiety: Reports feeling "low" and frustrated with his limitations; scores 22 on CAT (COPD Assessment Test), indicating high symptom burden. Has been offered but not commenced antidepressant therapy.
SYSTEMS REVIEW
| System | Findings |
|---|---|
| Respiratory | As above |
| CVS | Bilateral ankle swelling for 3 months (? cor pulmonale); no chest pain, no palpitations |
| GI | Reduced appetite; mild weight loss (~3 kg over 6 months) |
| Neurological | No headaches, no drowsiness (would suggest hypercapnic encephalopathy if present) |
| Sleep | Poor sleep quality; wife reports loud snoring (? OSA-COPD overlap); reports waking with headaches (? nocturnal hypercapnia) |
| MSK | Generalised weakness; reduced exercise tolerance |
| Urological | Nocturia x2 (may be related to cor pulmonale fluid redistribution) |
| ENT | No nasal polyps; no sinusitis |
IMMUNIZATION HISTORY
- Influenza vaccine: received annually for last 3 years
- Pneumococcal vaccine: received 2 years ago
- COVID-19: up to date
REVIEW OF FUNCTIONAL STATUS
- mMRC Dyspnea Scale: Grade 3 (stops for breath after walking ~100 meters or after a few minutes on level ground)
- CAT Score: 22/40 (high symptom burden)
- 6-Minute Walk Test (last performed 6 months ago): 210 meters (significantly reduced; normal >400 m)
- ADLs: Partially dependent - requires assistance with dressing and bathing during exacerbations
SUMMARY STATEMENT
Examine the physical findings and investigations for this COPD case
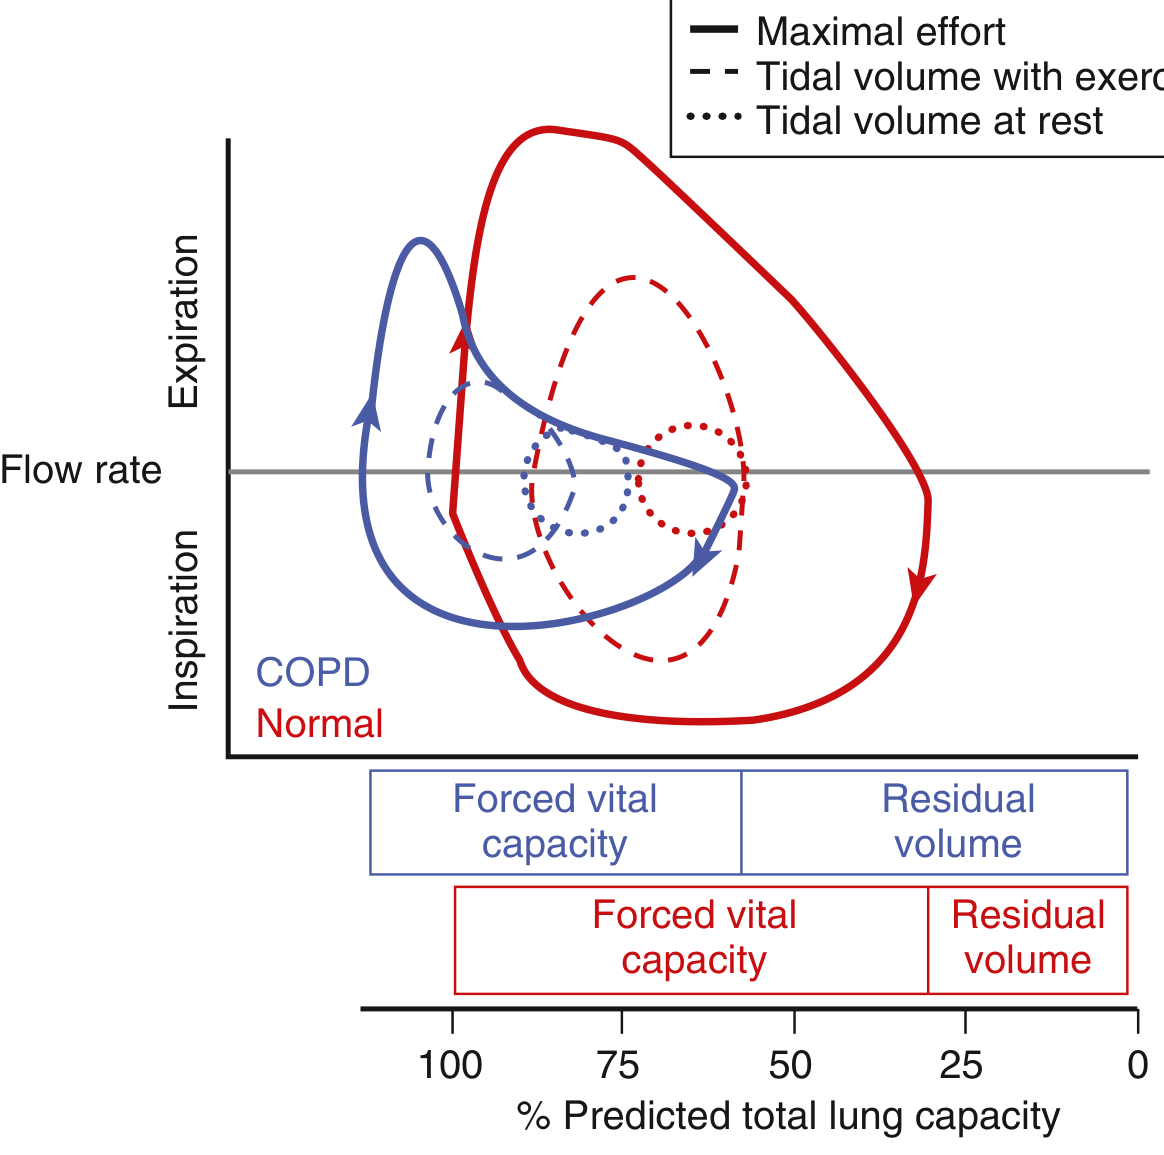
COPD spirometry obstructive pattern FEV1 FVC flow volume loop
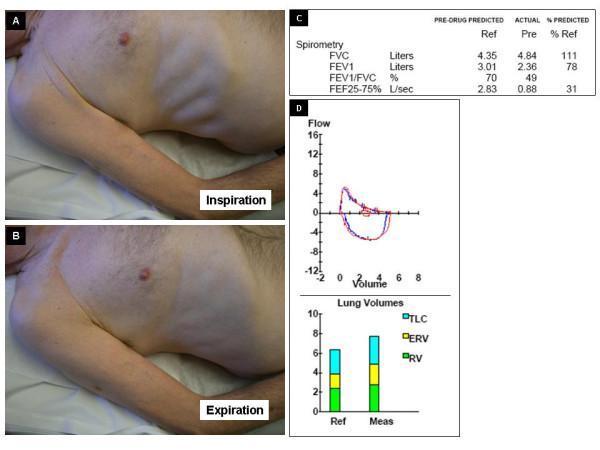
A multi-panel clinical graphic illustrating the physical and diagnostic findings of Hoover's sign in a patient with airway obstruction. Panels A and B contain clinical photographs of a male patient's torso in a lateral recumbent position. Panel A (Inspiration) demonstrates a paradoxical inward retraction of the lower rib cage and intercostal spaces, a classic physical sign of diaphragmatic flattening often seen in severe COPD or emphysema. Panel B (Expiration) shows the relative expansion or outward movement of the same region. Panel C provides a spirometry data table showing an obstructive pattern: a reduced FEV1/FVC ratio (49%) and low FEF25-75% (31% of predicted). Panel D includes a flow-volume loop demonstrating characteristic expiratory flow limitation and a bar chart of lung volumes. The lung volume chart highlights significant hyperinflation and gas trapping, characterized by an elevated Residual Volume (RV) and Total Lung Capacity (TLC) compared to reference values. This composite image serves to correlate physical examination findings of abnormal chest wall dynamics with quantitative pulmonary function testing in obstructive lung disease.
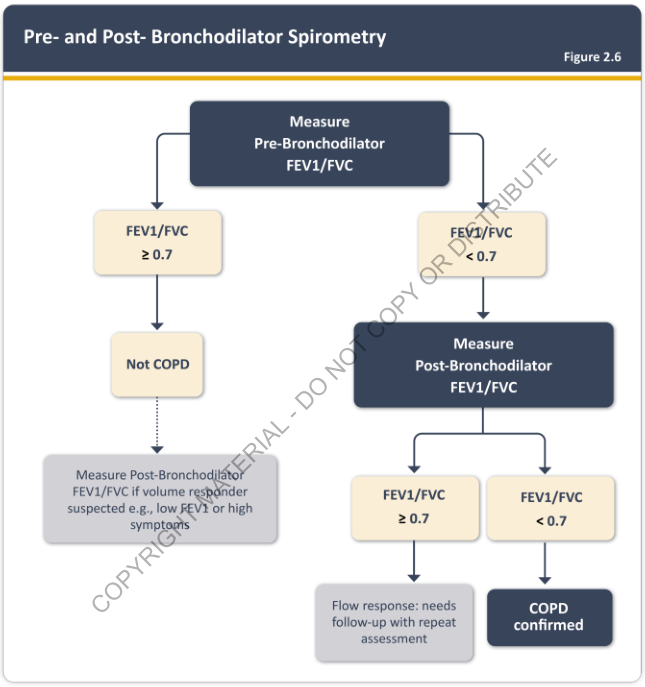
Summary : This flowchart outlines the diagnostic process for COPD using pre- and post-bronchodilator spirometry, based on FEV1/FVC ratio thresholds. flowchart: # Nodes : • Start: "Measure Pre-Bronchodilator FEV1/FVC" (rectangle) • Decision: "FEV1/FVC ≥ 0.7" (rounded rectangle) • Outcome: "Not COPD" (rounded rectangle) • Note: "Measure Post-Bronchodilator FEV1/FVC if volume responder suspected e.g., low FEV1 or high symptoms" (rectangle) • Decision: "FEV1/FVC < 0.7" (rounded rectangle) • Next Step: "Measure Post-Bronchodilator FEV1/FVC" (rectangle) • Decision: "FEV1/FVC ≥ 0.7" (rounded rectangle) • Outcome: "Flow response: needs follow-up with repeat assessment" (rectangle) • Decision: "FEV1/FVC < 0.7" (rounded rectangle) • Outcome: "COPD confirmed" (rectangle) # Connectors : • From "Measure Pre-Bronchodilator FEV1/FVC" splits into two branches: – If "FEV1/FVC ≥ 0.7" → "Not COPD" → optional note about post-bronchodilator measurement if volume responder suspected. – If "FEV1/FVC < 0.7" → "Measure Post-Bronchodilator FEV1/FVC". • From "Measure Post-Bronchodilator FEV1/FVC" splits into: – If "FEV1/FVC ≥ 0.7" → "Flow response: needs follow-up with repeat assessment". – If "FEV1/FVC < 0.7" → "COPD confirmed". # Layout : • Top-down flow, starting with pre-bronchodilator measurement. • Two main branches based on initial FEV1/FVC ratio. • Right branch includes a second measurement and further decision nodes. • Left branch includes a conditional note for further testing if indicated. # Analysis : • The flowchart provides a clear, stepwise approach for diagnosing COPD using spirometry. • The key threshold for FEV1/FVC is 0.7, used both pre- and post-bronchodilator. • COPD is confirmed only if post-bronchodilator FEV1/FVC remains below 0.7. • If FEV1/FVC normalises after bronchodilator, further follow-up is recommended. • The chart allows for additional testing in cases where volume response is suspected, even if initial results are not diagnostic.
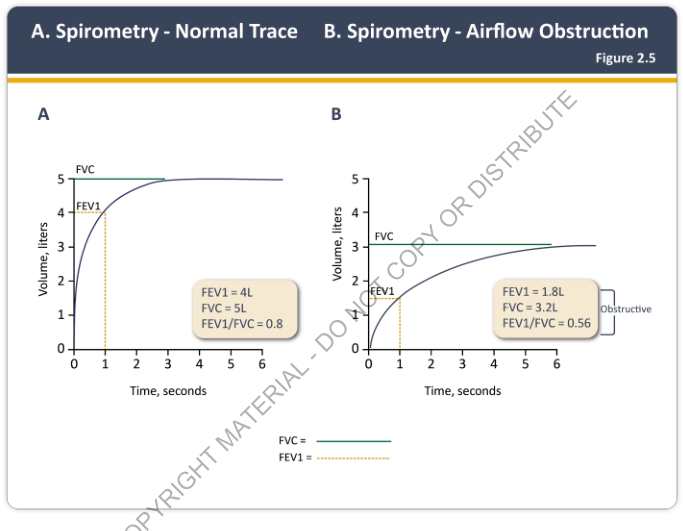
Summary : This figure compares spirometry traces between a normal individual and one with airflow obstruction, illustrating differences in forced expiratory volume in 1 second (FEV1), forced vital capacity (FVC), and the FEV1/FVC ratio. line plot: # Title & Axes : • Title: "A. Spirometry - Normal Trace" and "B. Spirometry - Airflow Obstruction" (Figure 2.5). • X-axis: "Time, seconds" (range: 0 to 6). • Y-axis: "Volume, liters" (range: 0 to 5). • Two panels: A (Normal Trace) and B (Airflow Obstruction). # Data Points : ## Panel A (Normal Trace) : • FEV1 = 4L (volume exhaled in first second). • FVC = 5L (total forced vital capacity). • FEV1/FVC = 0.8. • Curve rises steeply in first second, then plateaus near 5L. • FEV1 marked with a vertical dashed line at 1 second, horizontal at 4L. • FVC marked with a horizontal line at 5L. ## Panel B (Airflow Obstruction) : • FEV1 = 1.8L. • FVC = 3.2L. • FEV1/FVC = 0.56. • Curve rises slowly, plateaus near 3.2L. • FEV1 marked with a vertical dashed line at 1 second, horizontal at 1.8L. • FVC marked with a horizontal line at 3.2L. • "Obstructive" label at plateau. # Design Encodings : • FVC shown as a solid green horizontal line. • FEV1 shown as a dashed orange vertical and horizontal line at 1 second. • Volume-time curves: solid blue lines. • Beige annotation boxes with FEV1, FVC, and FEV1/FVC values. • Panel labels: "A" (left), "B" (right). # Distribution & Trends : • Panel A: Rapid rise in volume, high FEV1 and FVC, FEV1/FVC ratio within normal range. • Panel B: Slower rise, lower FEV1 and FVC, reduced FEV1/FVC ratio indicating obstruction. # Analysis : • The normal trace (Panel A) shows efficient, rapid exhalation with a high FEV1/FVC ratio (0.8). • The obstructive trace (Panel B) demonstrates impaired airflow, with a much lower FEV1 (1.8L) and FEV1/FVC ratio (0.56), consistent with obstructive lung disease. • The difference in curve shapes and ratios visually highlights the diagnostic utility of spirometry in distinguishing normal from obstructive patterns.
COPD ABG arterial blood gas results exacerbation hypercapnia
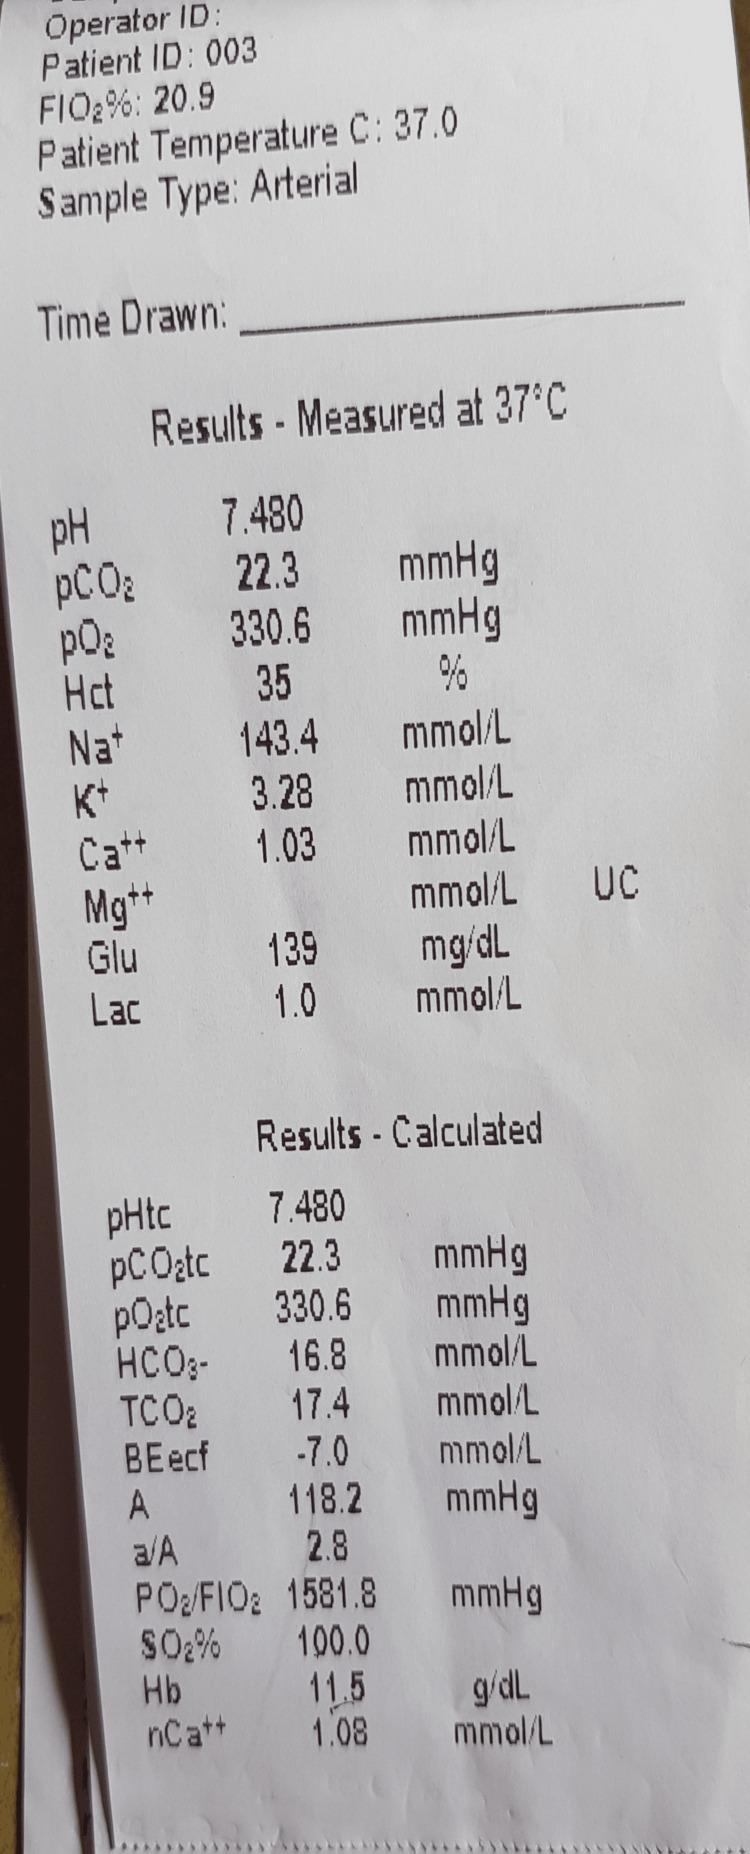
A clinical photograph of a printed arterial blood gas (ABG) analysis report. The document displays measured and calculated physiological values at a patient temperature of 37.0°C. Key measured values include a pH of 7.480, pCO2 of 22.3 mmHg, pO2 of 330.6 mmHg, and electrolyte levels (Na+ 143.4 mmol/L, K+ 3.28 mmol/L, Ca++ 1.03 mmol/L). Calculated values show a bicarbonate (HCO3-) level of 16.8 mmol/L and an oxygen saturation (SO2%) of 100.0%. This visual demonstrates a 'saturation gap' characteristic of certain toxicological conditions, such as methemoglobinemia, where the calculated oxygen saturation from the ABG appears normal (100%) despite the patient potentially experiencing clinical cyanosis and low peripheral pulse oximetry readings. The image is an educational tool for critical care, emergency medicine, and clinical toxicology, illustrating the interpretation of acid-base balance and oxygenation status.
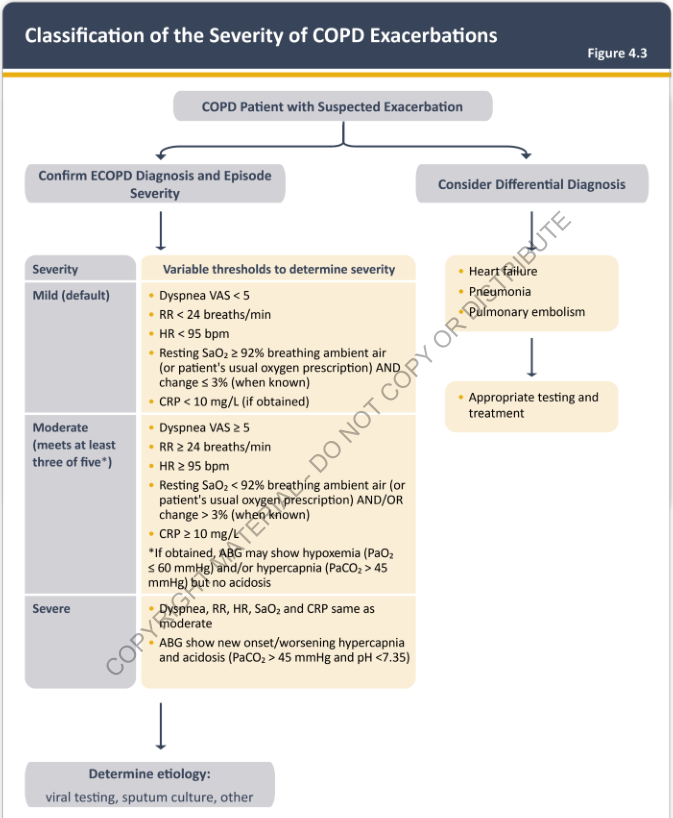
Summary : This flowchart provides a structured approach for classifying the severity of COPD exacerbations, guiding clinicians through diagnosis, severity assessment, differential diagnosis, and etiology determination using specific clinical thresholds. flowchart: # Nodes : • Start (rectangle): "COPD Patient with Suspected Exacerbation" • Decision (split): "Confirm ECOPD Diagnosis and Episode Severity" (left branch) / "Consider Differential Diagnosis" (right branch) • Severity classification (rectangle, left branch): "Severity" with three sub-nodes: – Mild (default) – Moderate (meets at least three of five*) – Severe • Variable thresholds (rectangle, left branch): For each severity level, lists criteria: – Mild: Dyspnea VAS < 5, RR < 24 breaths/min, HR < 95 bpm, Resting SaO₂ ≥ 92%, CRP < 10 mg/L – Moderate: Dyspnea VAS ≥ 5, RR ≥ 24 breaths/min, HR ≥ 95 bpm, Resting SaO₂ < 92%, CRP ≥ 10 mg/L, ABG may show hypoxemia/hypercapnia but no acidosis – Severe: Same as moderate, plus ABG shows new onset/worsening hypercapnia and acidosis (PaCO₂ > 45 mmHg and pH < 7.35) • Etiology determination (rectangle, left branch): "Determine etiology: viral testing, sputum culture, other" • Differential diagnosis (rectangle, right branch): "Heart failure", "Pneumonia", "Pulmonary embolism" • Testing/treatment (rectangle, right branch): "Appropriate testing and treatment" # Connectors : • Main flow starts at "COPD Patient with Suspected Exacerbation" and splits into two branches. • Left branch flows downward through severity classification, variable thresholds, and etiology determination. • Right branch flows downward through differential diagnosis and appropriate testing/treatment. • Severity classification is hierarchical: mild, moderate, severe, each with its own criteria. • Moderate severity requires meeting at least three of five listed criteria. • Severe is defined by ABG findings in addition to moderate criteria. # Layout : • Horizontal split after initial node: left for ECOPD diagnosis/severity, right for differential diagnosis. • Left branch is vertically organized: severity → thresholds → etiology. • Right branch is vertically organized: differential diagnosis → testing/treatment. • Colour coding: yellow boxes for variable thresholds and differential diagnosis. # Analysis : • The flowchart provides a clear, stepwise method for classifying COPD exacerbation severity using objective clinical criteria (dyspnea VAS, RR, HR, SaO₂, CRP, ABG). • Moderate severity is defined by a combination of symptoms and lab findings, requiring at least three criteria. • Severe exacerbation is distinguished by the presence of acidosis on ABG. • The chart emphasizes the importance of considering alternative diagnoses (heart failure, pneumonia, pulmonary embolism) and appropriate testing. • The final step is to determine the etiology of the exacerbation using laboratory tests.
Physical Examination & Investigations
Mr. Ramesh Kumar | 62M | COPD GOLD Grade 3 | Acute Exacerbation
PART A: PHYSICAL EXAMINATION
General Appearance
- Conscious and oriented (alert, not confused - important; confusion would suggest hypercapnic encephalopathy)
- Cachectic: visible loss of subcutaneous fat and muscle wasting
- Not in shock; no fever at presentation (was febrile 38.1°C 3 days ago)
Vital Signs
| Parameter | Value | Interpretation |
|---|---|---|
| Temperature | 37.4°C | Low-grade; infective trigger resolving |
| Pulse rate | 102 bpm, regular | Tachycardia - due to hypoxemia, sympathetic activation, salbutamol use |
| Blood pressure | 138/86 mmHg | Mildly elevated (known hypertensive) |
| Respiratory rate | 26 breaths/min | Tachypnea - marker of severity |
| SpO2 on room air | 84% | Significant hypoxemia |
| SpO2 on 2L nasal cannula O2 | 90% | Target 88-92% (controlled O2) |
| Weight | 52 kg | Low; BMI ~18 (cachectic) |
Systematic Examination
1. Hands
- No clubbing (absence is consistent with COPD; clubbing would prompt lung cancer workup)
- Peripheral cyanosis - bluish discoloration of nail beds
- Fine tremor - from salbutamol (beta-agonist) use
- Warm peripheries (no signs of low cardiac output)
- Peripheral pulses present bilaterally
2. Face / Head
- Central cyanosis - bluish discoloration of lips and tongue (significant hypoxemia)
- Pursed-lip breathing (to prolong expiratory phase and maintain positive airway pressure)
- Plethoric facies (? secondary polycythemia from chronic hypoxemia)
- No signs of CO2 retention flap (asterixis) at this stage - if present, would indicate impending hypercapnic encephalopathy
3. Neck
- Elevated jugular venous pressure (JVP) - raised ~4 cm above sternal angle, suggesting right heart failure (cor pulmonale)
- Use of sternocleidomastoid and scalene muscles (accessory muscle recruitment)
- Trachea: midline (deviation would suggest pneumothorax or large effusion)
- No cervical lymphadenopathy
4. Chest - Inspection
- Barrel chest: increased anteroposterior (AP) diameter approaching lateral diameter; AP:lateral ratio approaching 1:1 (normal ~0.7:1)
- Intercostal recession (during inspiration)
- Hoover sign: paradoxical inward retraction of the lower rib cage during inspiration - due to flattened diaphragm pulling lower ribs inward instead of outward (indicates severe hyperinflation)
- Tachypnea (RR 26/min); accessory muscle use
- Reduced chest expansion bilaterally
5. Chest - Palpation
- Reduced chest expansion bilaterally (secondary to hyperinflation)
- Trachea central (shift suggests pneumothorax - excluded here)
- Tactile vocal fremitus: reduced (hyperinflated lungs transmit vibrations poorly)
- No crepitus or tenderness
6. Chest - Percussion
- Hyperresonance bilaterally (air trapping, hyperinflated lungs)
- Loss of cardiac dullness (hyperinflated lungs overlay heart)
- Flattened diaphragm: reduced diaphragmatic excursion on percussion (normally 4-6 cm; reduced in COPD)
- No stony dullness (excludes pleural effusion)
7. Chest - Auscultation
- Breath sounds: globally reduced bilaterally (particularly in emphysema - destruction reduces sound transmission)
- Prolonged expiratory phase (>1:3 I:E ratio; normally 1:2)
- Expiratory wheeze (diffuse, bilateral - air flowing through narrowed airways)
- Rhonchi (coarse crackles/ronchi) on inspiration - from secretions in large airways; clears partially with cough
- Forced expiratory time >6 seconds (hallmark of obstruction; normal <4 sec)
- Heart sounds: muffled (interposed hyperinflated lungs)
- Loud P2 (pulmonic component of S2) - suggests pulmonary hypertension
8. Cardiovascular
- JVP elevated (as noted above)
- Right ventricular heave (parasternal heave) - palpable, indicating right ventricular hypertrophy/cor pulmonale
- Loud P2 on auscultation
- Possible tricuspid regurgitation murmur (pansystolic at LLSB, louder on inspiration) - from RV dilatation
- Heart sounds soft/muffled (barrel chest reduces transmission)
9. Abdomen
- Hepatomegaly - 2 cm below right costal margin, tender (hepatic congestion from right heart failure)
- Pulsatile liver (tricuspid regurgitation)
- No splenomegaly; no ascites (advanced cor pulmonale could cause ascites)
10. Lower Limbs
- Bilateral pitting edema to mid-shin - consistent with cor pulmonale (right heart failure)
- No calf tenderness (DVT must be excluded - PE can precipitate exacerbations)
- Peripheral cyanosis
Summary of Key Physical Signs
| Sign | Mechanism |
|---|---|
| Barrel chest | Chronic air trapping and hyperinflation |
| Hyperresonance | Air-filled hyperinflated lungs |
| Reduced breath sounds | Emphysematous destruction reduces sound conduction |
| Prolonged expiration + wheeze | Airflow limitation through narrowed airways |
| Hoover sign | Flattened diaphragm pulls ribs inward on inspiration |
| Pursed-lip breathing | Maintains positive end-expiratory pressure; slows collapse |
| Tripod position | Fixes shoulder girdle; allows accessory muscle use |
| Elevated JVP + ankle oedema | Cor pulmonale (RV failure from pulmonary hypertension) |
| Loud P2 | Pulmonary hypertension |
| Central + peripheral cyanosis | Hypoxemia (SpO2 84% on air) |
| Accessory muscle use | Increased work of breathing |
| No clubbing | Confirms COPD (clubbing ≠ COPD) |
PART B: INVESTIGATIONS
1. Spirometry / Pulmonary Function Tests (Definitive Diagnosis)
| Parameter | Patient (Mr. Ramesh Kumar) | Interpretation |
|---|---|---|
| FEV1/FVC (post-BD) | 0.49 (49%) | < 0.7 - confirms obstruction |
| FEV1 % predicted | 38% | GOLD Grade 3 (Severe: 30-49%) |
| FVC | 2.8 L (62% predicted) | Reduced |
| TLC | Increased (>120% predicted) | Hyperinflation |
| RV | Increased | Air trapping |
| FRC | Increased | Hyperinflation |
| DLCO | Reduced (40% predicted) | Parenchymal destruction (emphysema) |
2. Arterial Blood Gas (ABG) - Urgent
| Parameter | Value | Normal | Interpretation |
|---|---|---|---|
| pH | 7.31 | 7.35-7.45 | Acidaemia |
| PaO2 | 56 mmHg | 80-100 | Hypoxemia (improved from room air) |
| PaCO2 | 62 mmHg | 35-45 | Hypercapnia (CO2 retention) |
| HCO3- | 32 mEq/L | 22-26 | Elevated - compensatory metabolic alkalosis (chronic adaptation) |
| BE | +6 | -2 to +2 | Consistent with chronic compensation |
| SaO2 | 90% | >95% | Acceptable on controlled O2 |
3. Chest X-Ray (CXR) - PA View
| Finding | Significance |
|---|---|
| Bilateral hyperinflation | Air trapping, emphysema |
| Flattened hemidiaphragms | Hallmark of chronic hyperinflation |
| Increased retrosternal airspace (on lateral) | AP diameter increased (barrel chest) |
| Pruning of peripheral vascular markings | Emphysematous destruction of alveolar capillaries |
| >7 anterior ribs visible | Air trapping |
| Narrow, vertical cardiac silhouette | Mediastinum compressed by hyperinflated lungs |
| Prominent hila | Pulmonary artery enlargement from pulmonary hypertension |
| No focal consolidation | No pneumonia this admission (if present, would confirm bacterial trigger) |
| No pleural effusion | Excludes heart failure as primary cause |
| No pneumothorax | Important differential excluded |
4. Full Blood Count (FBC/CBC)
| Parameter | Value | Interpretation |
|---|---|---|
| Haemoglobin | 18.2 g/dL | Polycythaemia - secondary to chronic hypoxemia (compensatory erythropoiesis) |
| Haematocrit | 54% | Elevated |
| WBC | 14.2 × 10⁹/L | Leukocytosis - infective exacerbation |
| Neutrophils | 10.8 × 10⁹/L | Neutrophilia - bacterial infection |
| Eosinophils | 350 cells/μL | Elevated (>300) - guides ICS use; suggests eosinophilic phenotype |
| Platelets | 320 × 10⁹/L | Normal |
5. Blood Chemistry
| Test | Value | Interpretation |
|---|---|---|
| Serum bicarbonate (venous) | 34 mEq/L | Elevated - marker of chronic hypercapnia |
| Urea / Creatinine | 7.2 / 102 μmol/L | Mild renal impairment (? cardiorenal) |
| Electrolytes (Na+, K+) | Na 138, K 3.4 mEq/L | Mild hypokalaemia (salbutamol-induced) |
| CRP | 68 mg/L | Elevated - active infection/inflammation |
| Procalcitonin | 1.2 ng/mL | Elevated - favours bacterial trigger; antibiotic use justified |
| Blood glucose | 9.8 mmol/L | Elevated (diabetic, may worsen with steroids) |
| Albumin | 32 g/L | Low-normal (chronic disease, poor nutrition) |
| Haemoglobin A1c | 7.9% | Suboptimal diabetes control |
6. Sputum Examination
| Test | Result |
|---|---|
| Macroscopic | Purulent - yellow-green, thick |
| Gram stain | Gram-negative rods (? Haemophilus influenzae) |
| Culture & sensitivity | Pending (48-72 hours) |
| AFB smear | Negative × 2 (TB excluded, important in this demographic) |
7. ECG
| Finding | Significance |
|---|---|
| Sinus tachycardia (102 bpm) | Hypoxemia, sympathetic activation |
| P pulmonale - peaked P waves >2.5 mm in lead II | Right atrial enlargement (chronic cor pulmonale) |
| Right axis deviation | Right ventricular hypertrophy |
| Right ventricular hypertrophy - dominant R in V1, deep S in V5-V6 | Pulmonary hypertension |
| Low voltage QRS | Hyperinflated lungs attenuate cardiac electrical signals |
| Clockwise rotation (S waves V1-V6 "S1S2S3" pattern) | Characteristic of emphysema |
| No ischaemic changes | Excludes ACS as precipitant |
| No AF | Important; COPD increases AF risk |
8. Echocardiogram (Transthoracic, TTE)
| Finding | Value / Significance |
|---|---|
| Left ventricular function | Preserved EF ~58% (excludes LV failure as cause of oedema) |
| Right ventricular dilatation | Present - cor pulmonale |
| RV systolic dysfunction | Mildly impaired (TAPSE 16 mm; normal >17) |
| Estimated RVSP | 52 mmHg (via TR jet) - pulmonary hypertension |
| Interventricular septal flattening ("D-sign") | RV pressure overload |
| Tricuspid regurgitation | Mild-moderate |
| No pericardial effusion | Excluded |
9. CT Chest (High-Resolution, HRCT)
| Finding | Significance |
|---|---|
| Upper-lobe predominant centriacinar emphysema | Consistent with smoking-related COPD |
| Bullae present bilaterally | Air trapping; risk of pneumothorax |
| Airway wall thickening (large airways) | Chronic bronchitis component |
| Air trapping on expiratory views | Confirms small airway disease |
| No lung mass | Lung cancer excluded (important: 2x risk in COPD smokers) |
| Cardiomegaly - RV enlargement | Cor pulmonale confirmed |
| Pulmonary artery diameter >29 mm | Supports pulmonary hypertension |
10. Additional Investigations
| Investigation | Result / Indication |
|---|---|
| Alpha-1-antitrypsin (AAT) level | Normal (phenotype MM) - genetic form excluded |
| 6-Minute Walk Test (6MWT) | 210 m (done pre-admission; normal >450 m) - BODE index calculation |
| CAT Score | 22/40 (high symptom burden) |
| mMRC Dyspnea Scale | Grade 3 |
| D-dimer | 0.8 μg/mL (mildly elevated) - PE considered; CT-PA deferred as CXR explains hypoxemia and clinical probability low |
| BNP/NT-proBNP | Elevated 680 pg/mL - right heart strain (cor pulmonale); not LV failure (EF preserved) |
| Urine output | Reduced (monitoring for cardiorenal syndrome) |
Investigation Summary Snapshot
GOLD Grade 3 COPD (Severe) - Acute Type 2 Respiratory Failure
─────────────────────────────────────────────────────────────
ABG:    pH 7.31  |  PaO2 56  |  PaCO2 62  |  HCO3 32
FEV1:   38% predicted  |  FEV1/FVC: 0.49
SpO2:   84% RA → 90% on 2L O2
CXR:    Hyperinflation, flat diaphragms, no consolidation/PTX
Echo:   RVSP 52 mmHg, RV dilatation (cor pulmonale)
Bloods: Leukocytosis, polycythaemia, elevated CRP/PCT
─────────────────────────────────────────────────────────────
DIAGNOSIS: AECOPD (Anthonisen Type 1) + Acute-on-Chronic
           Type 2 Respiratory Failure + Cor Pulmonale
ACTION:   NIV (BiPAP), controlled O2, nebulized BD,
           systemic steroids, antibiotics