
Adenoid hypertrophy grading
adenoid hypertrophy grading nasopharynx endoscopy
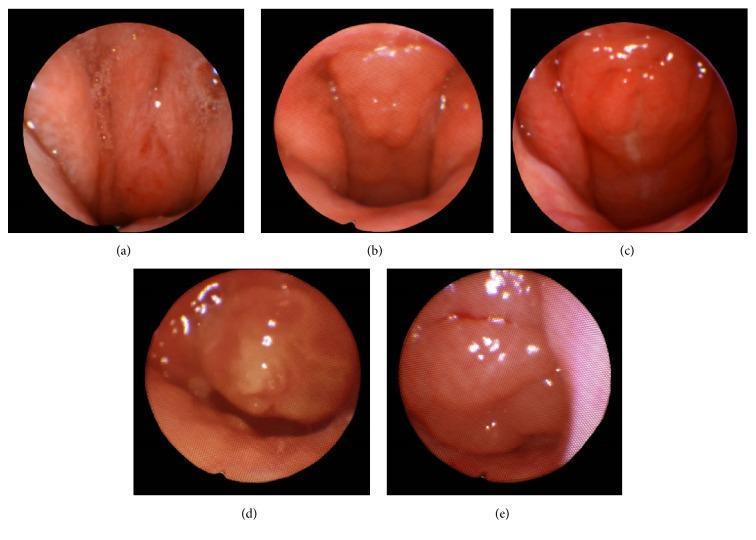
This clinical image series consists of five endoscopic frames (a through e) illustrating a grading system for adenoid hypertrophy within the nasopharynx during Drug-Induced Sleep Endoscopy (DISE). The series demonstrates the progressive narrowing of the choanae as adenoid tissue volume increases. Frame (a) shows Grade 0 (0% obstruction), characterized by a patent airway with visible scarring and no obstructive lymphoid tissue. Frame (b) depicts Grade 1 (<40% obstruction) with a small, relatively smooth tissue mass. Frame (c) shows Grade 2 (41%–70% obstruction), featuring an enlarging, more prominent adenoid mass. Frame (d) illustrates Grade 3 (71%–90% obstruction), where the nodular tissue significantly fills the airway space. Frame (e) represents Grade 4 (91%–100% obstruction), showing severe hypertrophy where the adenoid tissue nearly or completely occludes the airway, contacting the soft palate. This sequence is used in otolaryngology for assessing the severity of obstructive sleep apnea (OSA) and planning pediatric airway interventions.
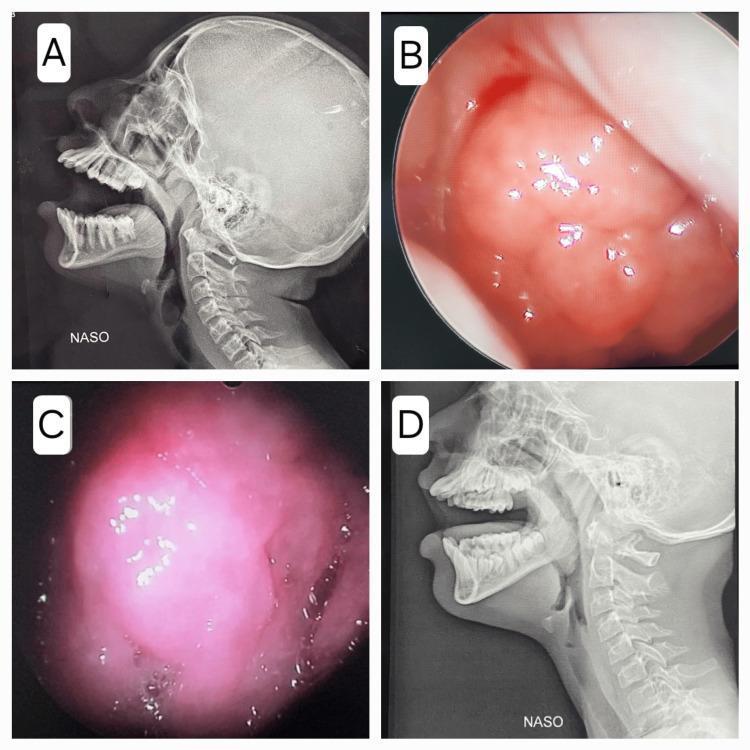
This composite clinical image illustrates the evaluation of adenoid hypertrophy using two different modalities: lateral cephalometric radiography and nasal endoscopy. Panels A and D are lateral X-rays of the skull and cervical spine, specifically labeled 'NASO' to indicate a focus on the nasopharynx. These radiographs demonstrate a soft tissue mass (adenoid) projecting from the posterior nasopharyngeal wall, which narrows the visible air column between the adenoid tissue and the soft palate. Panels B and C are corresponding endoscopic views of the nasopharynx, showing the adenoid tissue as a hyperemic, pinkish-red lobulated mass with a granular, irregular surface. Small white reflective spots across the tissue surface suggest the presence of mucous secretions. This comparison highlights how radiological grading of airway obstruction correlates with direct endoscopic visualization of the lymphoid tissue. These findings are clinically significant in the diagnosis of pediatric obstructive sleep apnea and its associated effects on middle ear pressure and otitis media with effusion.
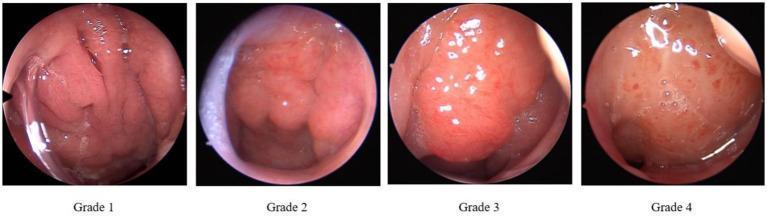
This clinical comparison chart presents four nasoendoscopic images illustrating the grading of adenoid hypertrophy according to the Parikh grading standard. The images provide a sequential view of the nasopharynx, focusing on the relationship between adenoid tissue and adjacent anatomical landmarks. Grade 1 shows a small adenoid mass with a clearly patent airway and visible surface folds. Grade 2 demonstrates moderate enlargement, reducing the airway space while maintaining visible landmarks such as the vomer bone. Grade 3 exhibits significant hypertrophy where the adenoid tissue occupies more than two-thirds of the choanal space, partially obscuring the Eustachian tube pillow. Grade 4 represents severe obstruction, with the adenoid tissue making contact with the soft palate and completely or near-completely obstructing the posterior nasal choana. Visually, the progression shows the tissue shifting from a small, pink, textured mass to a large, bulbous, and sometimes erythematous structure with prominent vascularity. This diagnostic series is essential for Otolaryngology (ENT) students to understand the endoscopic evaluation of pediatric airway obstruction and sleep-disordered breathing.
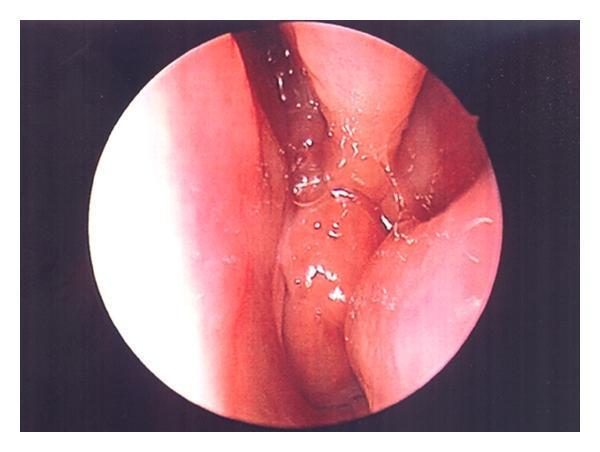
This diagnostic image is a clinical photograph captured via nasal endoscopy using a 2.7 mm zero-degree rigid scope. The view shows the nasopharynx where there is significant adenoid hypertrophy. The adenoid tissue appears as an enlarged, fleshy, pinkish-red mass with a lobular and irregular surface texture. The hypertrophied tissue occupies a substantial portion of the nasal airway, demonstrating clinical signs of obstruction. Notable surface features include scattered clear fluid droplets (likely seromucous secretions) and small streaks of vascular congestion or blood. The primary educational focus is to illustrate the endoscopic presentation of enlarged adenoids (adenoid vegetation) in the posterior nasal cavity, a common finding in pediatric patients with obstructive sleep apnea or chronic rhinosinusitis. Key landmarks include the surrounding nasal mucosa and the encroaching lymphoid tissue near the choana.
adenoid hypertrophy grading classification
Adenoid Hypertrophy - Grading
1. Endoscopic Grading - Parikh Grading System (Most Common)
| Grade | Endoscopic Finding | Choanal Obstruction |
|---|---|---|
| Grade 1 | Small adenoid mass; patent airway; surface folds visible; vomer and Eustachian tube orifices clearly seen | < 25% |
| Grade 2 | Moderate enlargement; reduced airway space; anatomical landmarks (vomer, Eustachian tube pillow) still visible | 25 - 50% |
| Grade 3 | Significant hypertrophy; adenoid occupies >2/3 of choanal space; Eustachian tube orifice partially obscured | 50 - 75% |
| Grade 4 | Severe hypertrophy; adenoid contacts the soft palate; near-complete or complete choanal obstruction | > 75% |
2. DISE-Based 5-Point Grading Scale (Grades 0-4)
| Grade | Obstruction | Finding |
|---|---|---|
| Grade 0 | 0% | Patent airway; no obstructive lymphoid tissue |
| Grade 1 | < 40% | Small, relatively smooth tissue mass |
| Grade 2 | 41 - 70% | Enlarging, more prominent adenoid mass |
| Grade 3 | 71 - 90% | Nodular tissue significantly fills airway |
| Grade 4 | 91 - 100% | Adenoid nearly or completely occludes airway; contacts soft palate |
3. Radiological Grading (Lateral Neck X-ray - Adenoid-Nasopharynx Ratio)
| A/N Ratio | Interpretation |
|---|---|
| < 0.60 | Normal |
| 0.60 - 0.70 | Borderline hypertrophy |
| > 0.70 | Significant hypertrophy (surgical consideration) |
| > 0.80 | Severe obstruction |
- Grade 1: Adenoid occupies < 1/3 of nasopharyngeal airway
- Grade 2: Occupies 1/3 to 2/3
- Grade 3: Occupies > 2/3
Clinical Correlation
- Grades 1-2: Observation; medical management (nasal steroids, montelukast)
- Grades 3-4: Usually indicate adenoidectomy, especially with symptoms of nasal obstruction, recurrent otitis media, sleep-disordered breathing, or OSA
- The size alone is not an indication for surgery; it is the consequence of hypertrophy (obstruction, OSA, Eustachian tube dysfunction) that guides management - Bailey and Love's Short Practice of Surgery, 28th Ed.
- In adults, adenoid hypertrophy should raise suspicion for lymphoproliferative disorder or HIV - Textbook of Family Medicine, 9th Ed.
Key Points for Exams
- There is only one nasopharyngeal adenoid (not "adenoids"), despite common parlance
- Adenoid hypertrophy is associated with hypertrophy of other Waldeyer's ring tissues (palatine tonsils, lingual tonsil)
- Lateral neck X-ray or nasal endoscopy is used for confirmation; CT is reserved for complex cases
- The Parikh 4-grade endoscopic scale is the most cited in ENT board examinations