
Describe etipatjogenesis of lobar pneumonia morphology and gross and complications in a table
lobar pneumonia gross morphology stages red grey hepatization
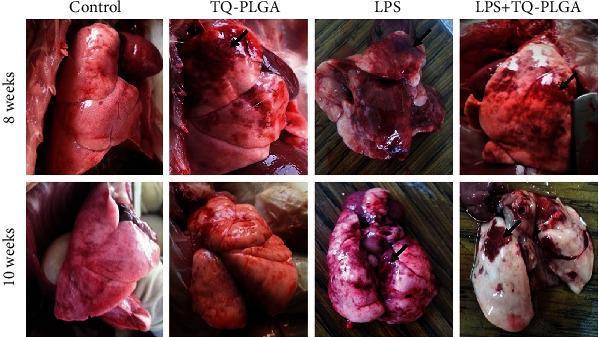
This composite of clinical photographs displays gross anatomical specimens of rat lungs across four experimental groups at 8-week and 10-week intervals. The images illustrate a comparative study on Lipopolysaccharide (LPS)-induced pulmonary injury and the therapeutic effects of Thymoquinone-loaded PLGA nanoparticles (TQ-PLGA NPs). The 'Control' group shows normal pink, spongy pulmonary morphology. The 'TQ-PLGA' group exhibits mild apical hepatization (indicated by arrows). The 'LPS' group demonstrates significant pathology, including dark red consolidations, depressed areas, and contracted, small-sized lobules indicative of chronic pneumonia and tissue damage. In contrast, the 'LPS + TQ-PLGA' group shows visual evidence of restoration, characterized by a return to more normal lobule size and a mixed whitish-red color, though persistent small red foci (arrows) remain visible. These specimens highlight the progression of inflammatory lung disease and the macroscopic indicators of pharmacological intervention and tissue recovery in an animal model of chronic active pneumonia.
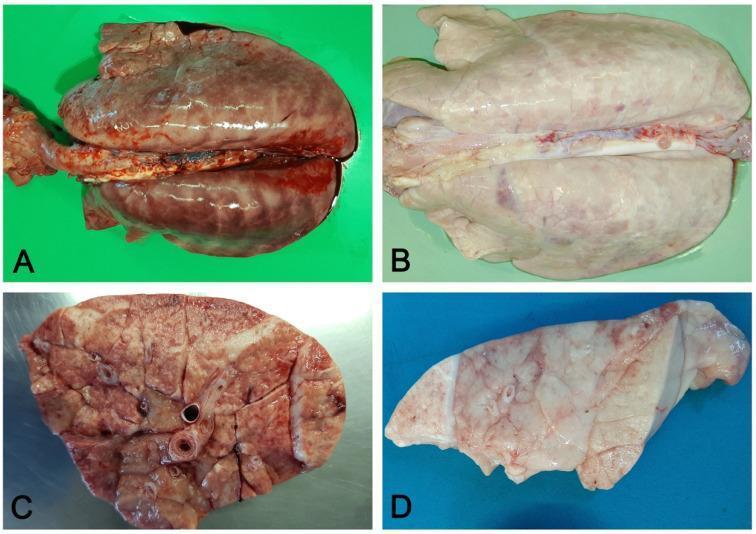
This composite of clinical photographs illustrates the macroscopic pathology of interstitial pneumonia, contrasting acute and chronic stages through gross specimens. Panels A and C represent the acute phase, showing lungs that fail to collapse and exhibit prominent rib impressions on the pleural surface. The parenchyma is characterized by diffuse hyperemia, giving it a dark red, mottled appearance, and interstitial edema within the perilobular connective tissue, which increases the overall firmness and weight of the organ. Panels B and D demonstrate the chronic stage of the disease. In this phase, the lungs remain non-collapsed with persisting rib impressions, but the color shifts to a pale, whitish-grey hue. This chromatic change reflects the progression to interstitial fibrosis and a further increase in tissue consistency. The specimens lack significant airway exudate, a hallmark distinguishing interstitial pneumonia from bronchopneumonia. This visual resource is intended for medical education in pathology and pulmonology to aid in identifying the gross morphological markers of lung injury progression from acute inflammation to chronic fibrotic remodeling.
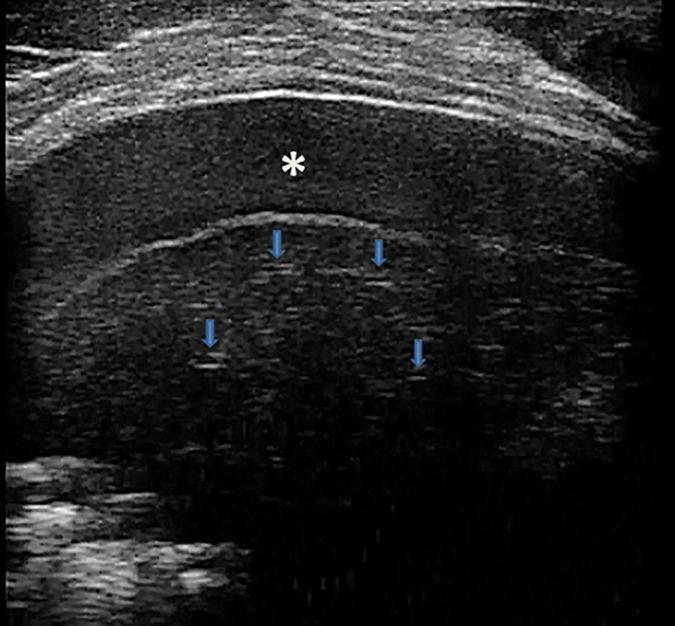
This grayscale lung ultrasound image (transverse intercostal scan) illustrates key diagnostic features of bacterial lobar pneumonia. A significant area of subpleural consolidation is visible, demonstrating 'hepatization' where the lung tissue exhibits a tissue-like, hypoechoic echogenicity similar to liver parenchyma. Within this consolidated region, several small, hypoechoic tubular structures are identified by blue arrows, representing fluid bronchograms (fluid-filled bronchi). Superior to the consolidated lung, a hypoechoic to anechoic space marked by an asterisk (*) indicates a fibrinous inflammatory reactive pleural effusion. The visceral and parietal pleurae are separated by this fluid collection, which contains fine internal echoes suggestive of fibrin or debris. This image is an educational example of point-of-care ultrasound (POCUS) findings in pediatric pulmonary infection, highlighting the loss of normal lung aeration and the development of secondary pleural complications.
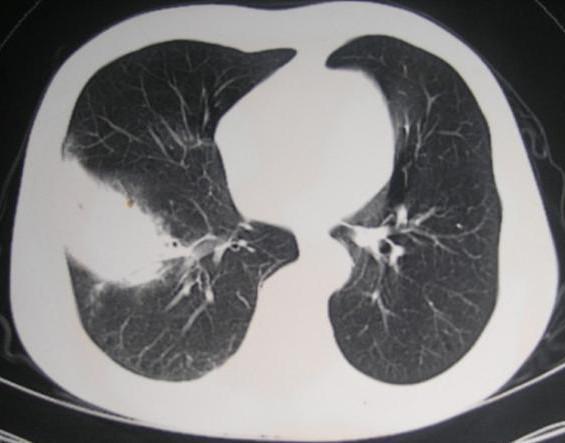
This diagnostic axial CT scan of the thorax, using a lung window, demonstrates classic features of lobar pneumonia. The primary finding is a large, dense area of consolidation localized to the lower lobe of the right lung. This consolidated region presents as a homogenous soft-tissue density that obscures the normal lung parenchyma and vascular markings, characteristic of alveolar fluid or exudate accumulation (pathologically corresponding to the stage of gray hepatization). In contrast, the left lung appears normal, displaying clear aeration with well-defined branching vascular and bronchial structures. The mediastinal structures are centered, and no pleural effusions are immediately visible in this section. This image serves as a clinical example of pulmonary consolidation, highlighting the visual distinction between healthy air-filled lung tissue and pathological density caused by an infectious process like lobar pneumonia.
Lobar Pneumonia: Etiopathogenesis, Morphology, Gross Features & Complications
Etiopathogenesis
| Aspect | Details |
|---|---|
| Definition | Consolidation of a large portion of a lobe or an entire lobe by inflammatory exudate; alveolar filling is the hallmark |
| Primary organism | Streptococcus pneumoniae (pneumococcus) - most common cause of community-acquired lobar pneumonia; gram-positive, lancet-shaped diplococci |
| Other organisms | Klebsiella pneumoniae (right upper lobe predilection, bulging fissure sign, gelatinous sputum); Legionella pneumophila; Staphylococcus aureus; H. influenzae |
| Route of infection | Inhalation of aerosolized droplets OR aspiration of oropharyngeal secretions; organism colonizes alveoli and triggers inflammatory cascade |
| Predisposing factors | Extremes of age, COPD, congestive heart failure, diabetes mellitus, alcoholism, congenital/acquired immunodeficiency, asplenia (particularly increases risk for encapsulated organisms like pneumococcus) |
| Pathogenetic sequence | Organisms evade mucociliary clearance → reach alveoli → activate complement (alternative pathway, C3b opsonization) → neutrophil recruitment → fibrinopurulent exudate fills alveolar spaces → consolidation spreads via pores of Kohn across the lobe |
| Virulence factors (pneumococcus) | Polysaccharide capsule (antiphagocytic), pneumolysin (cytotoxin), surface adhesins (binds epithelium), IgA protease |
| Prior viral infection | Viral upper respiratory tract infection impairs mucociliary clearance and local defenses, often precedes bacterial invasion |
Morphology - The Four Classic Stages
| Stage | Timing | Gross Appearance | Microscopic Features |
|---|---|---|---|
| 1. Congestion | Day 1-2 | Lung is heavy, boggy, and red | Vascular engorgement; intraalveolar edema fluid; few neutrophils; abundant bacteria |
| 2. Red Hepatization | Day 2-4 | Lobe is red, firm, airless, liver-like consistency ("hepatization") | Massive confluent exudation: neutrophils + red blood cells + fibrin fill alveolar spaces; air is completely expelled |
| 3. Gray Hepatization | Day 4-8 | Lobe becomes grayish-brown in color, still firm | Progressive disintegration of red cells; fibrinopurulent exudate persists; RBCs lysed → gray hue; fibrin strands prominent |
| 4. Resolution | Day 8 onwards | Lobe softens; returns toward normal texture | Enzymatic digestion of exudate → granular, semifluid debris; resorbed, ingested by macrophages, expectorated, or organized by fibroblasts |
Gross Morphology Summary
| Feature | Description |
|---|---|
| Distribution | Entire lobe or large portion of a lobe; typically unilateral; lower lobes more common |
| Pleural surface | Pleural fibrinous exudate (pleuritis) often present when consolidation reaches the lung surface; may resolve or organize into fibrous adhesions |
| Cut surface (red hepatization) | Red, granular, airless, firm; looks like liver parenchyma |
| Cut surface (gray hepatization) | Grayish-brown, dry, granular; fibrin stands out on cut section |
| Air bronchogram | Radiolucent bronchi visible against consolidated (radiopaque) alveoli on CXR/CT - characteristic of lobar pneumonia |
| Consistency | Firm and consolidated - does not collapse when cut |
Complications
| Complication | Mechanism | Notes |
|---|---|---|
| Lung abscess | Tissue destruction and necrosis due to virulent organisms or delayed treatment | Particularly common with S. pneumoniae type III and Klebsiella pneumoniae; also S. aureus |
| Empyema | Spread of infection to the pleural cavity → intrapleural fibrinopurulent reaction | May require chest drainage; can organize into fibrothorax |
| Fibrous organization (Carnification) | Failure of resolution → fibroblasts grow into exudate → lung tissue is replaced by fibrous tissue | Lobe permanently "carnified" (meat-like); seen when enzymatic digestion fails |
| Pleural adhesions | Organization of pleural fibrinous exudate | Results in obliteration of pleural space |
| Bacteremia / Septicemia | Hematogenous dissemination of bacteria | Occurs in 20-30% in early disease; especially with pneumococcus |
| Metastatic abscesses / Endocarditis | Bacteremic seeding of distant organs | Can affect heart valves, brain, kidneys, spleen, joints |
| Meningitis | Bacteremic spread to meninges | Serious complication; associated with pneumococcal pneumonia |
| Suppurative arthritis | Bacteremic seeding of joint spaces | Less common |
| Pericarditis | Extension or hematogenous seeding | Can cause pericardial effusion or tamponade |
| Respiratory failure | Massive consolidation impairs gas exchange | More likely with bilateral or multilobar involvement |
| Death | <10% of hospitalized patients succumb with antibiotics; higher in pre-antibiotic era | Usually due to septic complications or underlying comorbidities |
Enumerate chronic obstructive pulmonary disease classify bronchial asthma discuss the pathogenesis of etopic bronchial asthma add a note on sputum findings of bronchial asthma
atopic asthma pathogenesis IgE mast cell Th2 mechanism diagram
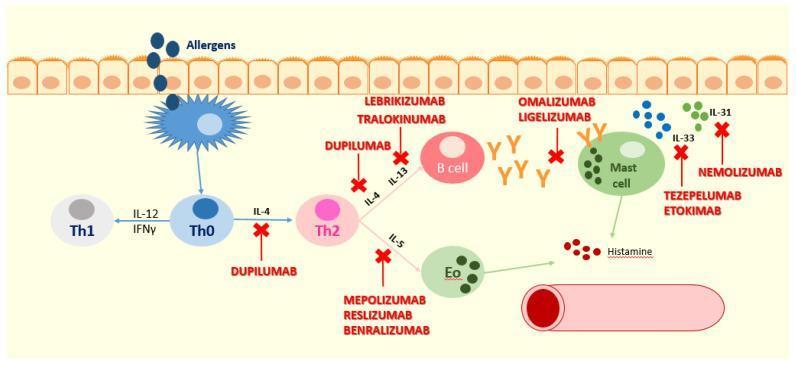
This pathophysiology diagram illustrates the type-2 inflammation pathway in atopic dermatitis and urticaria, highlighting the mechanism of action for various biologic drugs. The visual shows an epithelial barrier at the top, where allergens interact with a dendritic cell. This triggers a cascade involving T-helper cells (Th0 differentiating into Th1 or Th2). The Th2 cell releases cytokines IL-4, IL-5, and IL-13, which activate B cells (producing IgE), eosinophils (Eo), and mast cells (releasing histamine). Key therapeutic targets and their inhibitors are shown with red 'X' marks: Dupilumab blocks the IL-4/IL-13 pathway; Lebrikizumab and Tralokinumab target IL-13; Mepolizumab, Reslizumab, and Benralizumab inhibit the IL-5 pathway and eosinophil activation; Omalizumab and Ligelizumab block IgE; Nemolizumab targets the IL-31 receptor (associated with pruritus); and Tezepelumab and Etokimab act upstream by inhibiting TSLP and IL-33 respectively. The diagram effectively maps the transition from allergen exposure to clinical manifestations like inflammation and vascular changes, providing a comprehensive overview of biological treatments in pediatric dermatology and immunology.
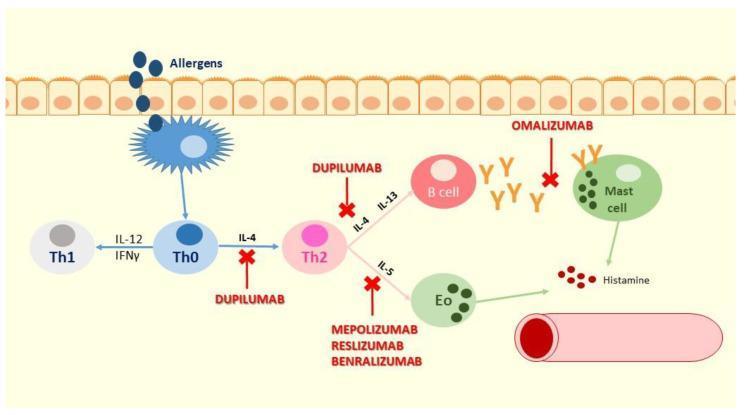
A pathophysiology diagram illustrating the Type 2 (T2) inflammatory pathway in asthma and the specific targets of various monoclonal antibodies. The diagram shows an epithelial barrier at the top where allergens trigger an antigen-presenting cell, which subsequently interacts with a naive T cell (Th0). The differentiation pathway is shown leading to Th2 cells, which produce cytokines IL-4, IL-5, and IL-13. Therapeutic interventions are indicated by red 'X' marks: Dupilumab is shown inhibiting IL-4 and IL-13 signaling; Omalizumab blocks free IgE (depicted as Y-shaped molecules) before they bind to Mast cells; and Mepolizumab, Reslizumab, and Benralizumab target the IL-5 pathway to prevent eosinophil (Eo) activation. Downstream effects include B cell class switching to IgE production, eosinophil recruitment, and mast cell degranulation leading to histamine release and airway inflammation. This educational visual provides a mechanistic overview of biologics used in severe asthma management.
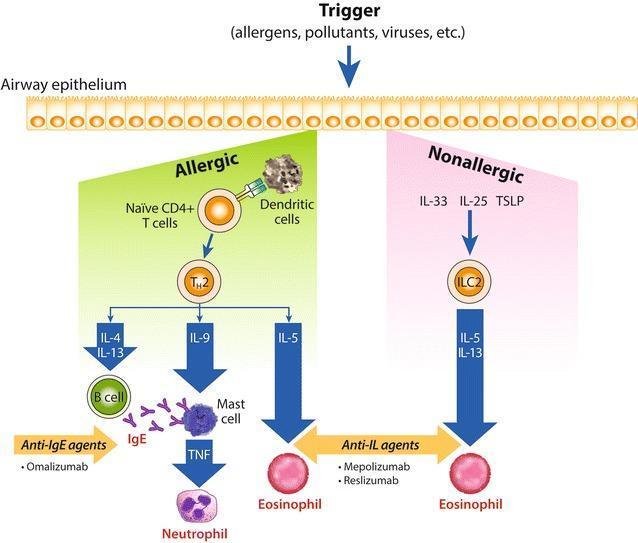
This pathophysiology diagram illustrates the inflammatory cascades of allergic and non-allergic asthma. The process is divided into two primary pathways stemming from the airway epithelium. The Allergic pathway (left, green) shows a Type 2 helper T cell (Th2) mediated response. Naive CD4+ T cells interact with dendritic cells to become Th2 cells, which release cytokines IL-4, IL-13 (activating B cells to produce IgE), IL-9 (stimulating mast cells to release TNF, leading to neutrophil recruitment), and IL-5 (promoting eosinophil activation). The Non-allergic pathway (right, pink) is triggered by epithelial-derived cytokines IL-33, IL-25, and TSLP, which activate Type 2 innate lymphoid cells (ILC2). These cells release IL-5 and IL-13, leading to eosinophilia. The diagram also highlights therapeutic targets, specifically anti-IgE agents like omalizumab and anti-IL agents such as mepolizumab and reslizumab, which inhibit the downstream recruitment of inflammatory cells like eosinophils and neutrophils.
COPD, Bronchial Asthma: Classification, Pathogenesis & Sputum Findings
PART 1: Chronic Obstructive Pulmonary Disease (COPD) - Enumeration
| Component | Key Features |
|---|---|
| Definition | A disease characterized by persistent, progressive airflow limitation that is not fully reversible; associated with an abnormal inflammatory response of the lungs to noxious particles or gases |
| Major forms | (1) Emphysema (2) Chronic Bronchitis - these commonly coexist |
| Spirometry | Reduced FEV1, normal or near-normal FVC → reduced FEV1/FVC ratio (<0.70) |
| Primary risk factor | Cigarette smoking (most important); also air pollution, occupational dusts, α1-antitrypsin deficiency |
| Emphysema | Permanent enlargement of air spaces distal to terminal bronchioles due to destruction of alveolar walls by proteases (neutrophil elastase, MMP); loss of elastic recoil |
| Emphysema subtypes | Centriacinar (most common; smoking-related; affects respiratory bronchioles, upper lobes) vs. Panacinar (α1-antitrypsin deficiency; involves entire acinus; lower lobe predominance) |
| Emphysema clinical | "Pink Puffer" (type A): barrel chest, increased AP diameter, hyperresonance, dyspnea without hypoxemia at rest; pursed-lip breathing |
| Chronic Bronchitis | Defined clinically: productive cough for ≥3 consecutive months in ≥2 consecutive years, after excluding other causes |
| Chronic Bronchitis pathology | Hyperplasia of submucosal mucous glands → Reid index >0.5; goblet cell metaplasia; small airway inflammation (chronic bronchiolitis) causes obstruction |
| Chronic Bronchitis clinical | "Blue Bloater" (type B): hypoxemia, hypercapnia, cyanosis, cor pulmonale, recurrent infections |
| Outcome | Progressive; can lead to pulmonary hypertension, cor pulmonale, and respiratory failure |
PART 2: Classification of Bronchial Asthma
| Category | Subtype | Features |
|---|---|---|
| By immunological mechanism | Atopic (Extrinsic/Allergic) | IgE-mediated; type I hypersensitivity; triggered by environmental allergens (dust, pollen, animal dander); positive skin test; family history common; onset in childhood |
| Non-atopic (Intrinsic) | No allergen sensitization; negative skin tests; triggers include viral infections, cold air, exercise, pollutants; onset in adulthood | |
| By trigger | Drug-induced | Aspirin/NSAIDs (inhibit COX → reduced PGE2 → excess leukotrienes); also beta-blockers |
| Occupational | Triggered by fumes (epoxy resins), organic dusts (wood, cotton), chemicals (formaldehyde, toluene), platinum salts | |
| Exercise-induced | Triggered by physical exertion; worse in cold, dry air | |
| Infection-induced | Viral URTI (rhinovirus, RSV, parainfluenza) precipitates attacks | |
| By severity | Intermittent / Mild persistent / Moderate persistent / Severe persistent | Based on frequency of symptoms, nocturnal symptoms, PEF/FEV1 values |
| By inflammatory cell pattern | Eosinophilic (Th2/type 2) | Most common; responds to steroids and anti-IL-5 biologics |
| Neutrophilic | Th17-mediated; often steroid-resistant; associated with bacterial colonization | |
| Mixed granulocytic / Paucigranulocytic | Less defined endotypes |
PART 3: Pathogenesis of Atopic (Extrinsic/Allergic) Bronchial Asthma
Step 1 - Sensitization Phase
| Event | Mechanism |
|---|---|
| Allergen inhalation (first exposure) | Allergens (dust mites, pollen, animal dander) are processed by dendritic cells in the bronchial mucosa |
| Antigen presentation | Dendritic cells present allergen peptides to naive CD4+ T cells → differentiation into Th2 cells (driven by IL-4 from mast cells and ILC2s) |
| IgE production | Th2 cells secrete IL-4 and IL-13 → B cells undergo class switching → produce allergen-specific IgE |
| Mast cell sensitization | IgE binds to high-affinity Fc receptors (FcεRI) on submucosal mast cells → patient is now "sensitized" |
Step 2 - Early Phase Reaction (Immediate; within minutes of re-exposure)
| Event | Mechanism | Mediators Released |
|---|---|---|
| Allergen re-exposure → cross-links IgE on mast cells | Mast cell degranulation | Histamine (mild bronchoconstriction, vasodilation) |
| Leukotrienes C4, D4, E4 (prolonged, potent bronchoconstriction; increased mucus secretion; increased vascular permeability) | ||
| Prostaglandin D2 (bronchoconstriction, vasodilation) | ||
| Platelet-activating factor (platelet aggregation, serotonin release) | ||
| Parasympathetic reflex activation | Mediators stimulate subepithelial vagal receptors | Acetylcholine → muscarinic receptor activation → smooth muscle contraction |
| Net result | Bronchoconstriction + increased mucus + vasodilation + edema | Peaks in 15-30 minutes; subsides in ~1 hour |
Step 3 - Late Phase Reaction (4-8 hours after exposure)
| Event | Mechanism |
|---|---|
| Cytokine release | Th2 cells and mast cells secrete IL-4, IL-5, IL-13, eotaxin, chemokines |
| Eosinophil recruitment | IL-5 activates eosinophils; eosinophil products (major basic protein, eosinophil cationic protein, eosinophil peroxidase) cause epithelial damage and amplify inflammation |
| T cell and neutrophil influx | Sustained inflammatory cell recruitment perpetuates bronchoconstriction and mucosal damage |
| ILC2 contribution | Group 2 innate lymphoid cells (ILC2) are activated by epithelial-derived IL-33, IL-25, and TSLP and release IL-5 and IL-13, amplifying type 2 immunity independent of antigen exposure |
| Charcot-Leyden crystal formation | Eosinophil-derived galectin-10 (GAL10) crystallizes → potent inducers of further inflammation and mucus production |
Step 4 - Airway Remodeling (repeated/chronic exposure)
| Change | Result |
|---|---|
| Sub-basement membrane fibrosis (type I and III collagen deposition) | Permanent airway narrowing |
| Submucosal gland enlargement + goblet cell hyperplasia | Excess mucus production |
| Smooth muscle hypertrophy and hyperplasia | Increased bronchoconstrictor response |
| Increased vascularity (angiogenesis) | Mucosal edema |
| Overall | Adds an irreversible component to airway obstruction even between attacks |
Genetic Susceptibility
| Gene/Factor | Role |
|---|---|
| HLA-DR alleles | Determine allergen peptide presentation efficiency |
| IL-4 receptor polymorphisms | Enhance Th2 differentiation |
| TSLP gene variants | Promotes allergic reactions via ILC2 activation |
| Hygiene hypothesis | Limited early microbial exposure in urban environments fails to direct immune system toward Th1 → default to Th2 → increased atopy |
PART 4: Sputum Findings in Bronchial Asthma (Short Note)
| Finding | Description | Significance |
|---|---|---|
| Appearance | Mucoid, viscid, tenacious; may be clear, white, or (if eosinophil-rich) slightly yellow-green without infection | Color alone does not indicate infection |
| Curschmann spirals | Whorled, spirally coiled mucus plugs (bronchiolar casts composed of mucus and shed cells) | Formed by extrusion of mucus plugs from subepithelial mucous gland ducts or bronchioles; pathognomonic of asthma |
| Charcot-Leyden crystals | Elongated, double-pointed (needle-like) crystals made of crystallized galectin-10 (eosinophil lysophospholipase) released from eosinophil granules | Indicator of eosinophilic airway inflammation; seen in asthma, tropical eosinophilia, allergic bronchopulmonary aspergillosis |
| Eosinophils | Numerous eosinophils (>3% of cells in induced sputum) | Hallmark of type 2 / atopic asthma; predicts steroid responsiveness |
| Creola bodies | Clusters of shed airway epithelial cells, often with visible beating cilia in fresh samples | Indicator of epithelial desquamation due to inflammatory damage |
| Mucus plugs | Thick, tenacious plugs occluding bronchi and bronchioles | Seen in status asthmaticus (acute severe asthma); can cause lobar collapse |
| Neutrophils | Increased in non-atopic, neutrophilic, or aspirin-sensitive asthma | Associated with steroid-resistant disease |
| Wright-stained smear | Used to differentiate eosinophils from neutrophils | Helps distinguish asthma from infective exacerbation (where neutrophils predominate) |