
Respiratory system notes physiology with all important points and topics that we should know for medical life purpose and exam purpose
oxygen hemoglobin dissociation curve
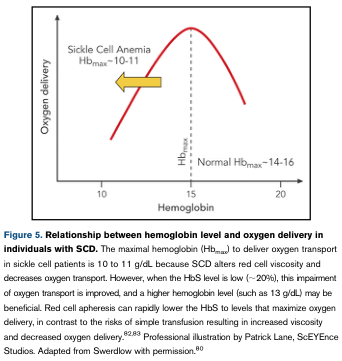
Summary : This figure illustrates the relationship between hemoglobin (Hb) level and oxygen delivery in individuals with sickle cell disease (SCD), highlighting the optimal Hb range for oxygen transport in SCD compared to normal individuals. line plot: # Title & Axes : • No explicit title on the plot, but the context is "Relationship between hemoglobin level and oxygen delivery in individuals with SCD." • X-axis: "Hemoglobin" (units not specified, but contextually g/dL). • Y-axis: "Oxygen delivery" (units not specified). • X-axis tick labels: 10, 15, 20. • Y-axis: No tick labels, only qualitative trend. # Data Points & Series : • Single red curve showing oxygen delivery as a function of hemoglobin level. • The curve rises from Hb = 10, peaks near Hb = 14–16, then declines toward Hb = 20. • Arrow and annotation for "Sickle Cell Anemia Hb_max ~10–11" indicating the optimal Hb range for SCD. • Dashed vertical line at "Normal Hb_max ~14–16" indicating the optimal Hb range for normal individuals. # Design Encodings : • Red solid line for the main curve. • Yellow arrow highlighting the SCD optimal Hb range. • Dashed vertical line for normal Hb_max. • Text annotations for "Sickle Cell Anemia Hb_max ~10–11" and "Normal Hb_max ~14–16". # Distribution & Trends : • The curve is unimodal, peaking at intermediate Hb levels. • Oxygen delivery increases with Hb up to a point, then decreases at higher Hb levels. • The optimal Hb for SCD is lower (~10–11 g/dL) than for normal individuals (~14–16 g/dL). # Analysis : • The figure visually demonstrates that the maximal oxygen delivery in SCD occurs at a lower hemoglobin level than in normal individuals, due to altered red cell viscosity and oxygen transport in SCD. • Increasing Hb above the SCD optimal range may decrease oxygen delivery, while lowering Hb to the optimal range can improve oxygen transport. • The curve supports clinical recommendations for transfusion targets in SCD patients to avoid excessive Hb levels that could impair oxygen delivery.
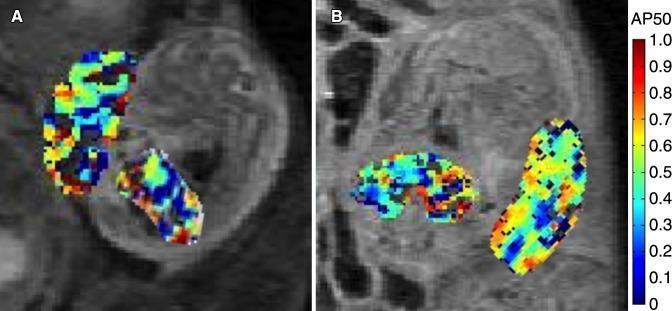
This diagnostic image set displays two functional MR images (A and B) showing maternal-fetal units in a mouse model at embryonic days 14.5 and 17.5. The images feature overlaid color-coded AP50 maps, which represent fetal and placental oxygen-hemoglobin dissociation parameters. In both panels, the placenta and fetal liver are isolated as regions of interest. A vertical color bar on the right side indicates AP50 values scaled from 0 to 1.0, with cool colors (dark blue) representing lower values and warm colors (red/orange) representing higher values. Panel A (day 14.5) demonstrates a heterogeneous distribution of oxygenation parameters within the tissues, showing a mix of green, yellow, and blue pixels. Panel B (day 17.5) illustrates the progression of these physiological markers over time, with the placental AP50 values showing a significant spatial shift toward warmer colors, reflecting changes in oxygen transfer efficiency. These maps provide a non-invasive visual method for studying fetal oxygenation and placental function during gestation.
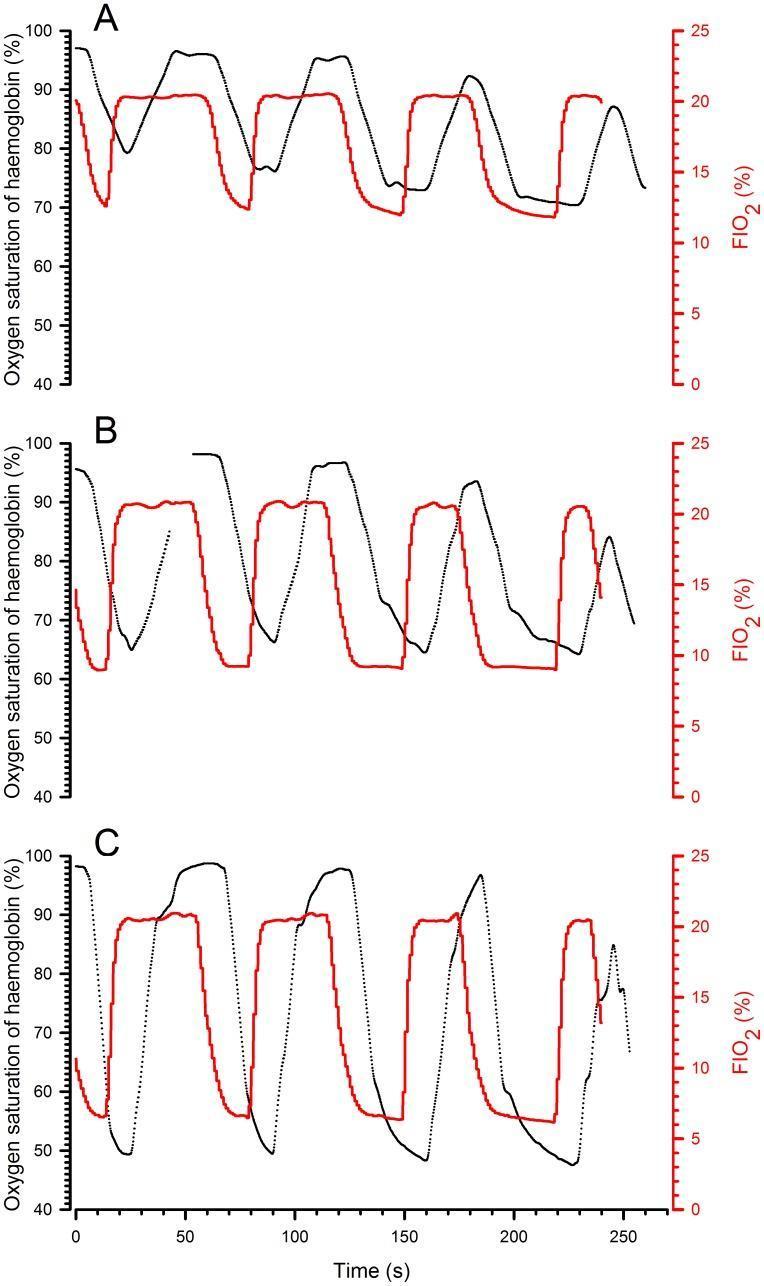
This physiological data visualization consists of three stacked line graphs (A, B, and C) depicting the relationship between inspired oxygen concentration (FIO2) and hemoglobin oxygen saturation over time in a cyclic hypoxia-reoxygenation model. The horizontal x-axis represents time in seconds (0 to 250s). Each graph features dual y-axes: the left axis measures 'Oxygen saturation of haemoglobin (%)' from 40% to 100%, represented by a black line; the right red axis measures 'FIO2 (%)' from 0% to 25%, represented by a red line. The graphs demonstrate physiological response to progressively longer hypoxic phases (15s, 20s, 30s, and 40s) across four cycles. Graph A shows mild hypoxia (FIO2 12%), Graph B shows moderate hypoxia (FIO2 9%), and Graph C shows severe hypoxia (FIO2 6%). Key clinical concepts illustrated include the latency period between FIO2 changes and hemoglobin desaturation, the nadir of saturation proportional to FIO2 severity, and the incomplete resaturation occurring when normoxic intervals are insufficient. These records provide a representative look at respiratory physiology and gas exchange dynamics during intermittent hypoxia.
lung volumes capacities spirometry diagram
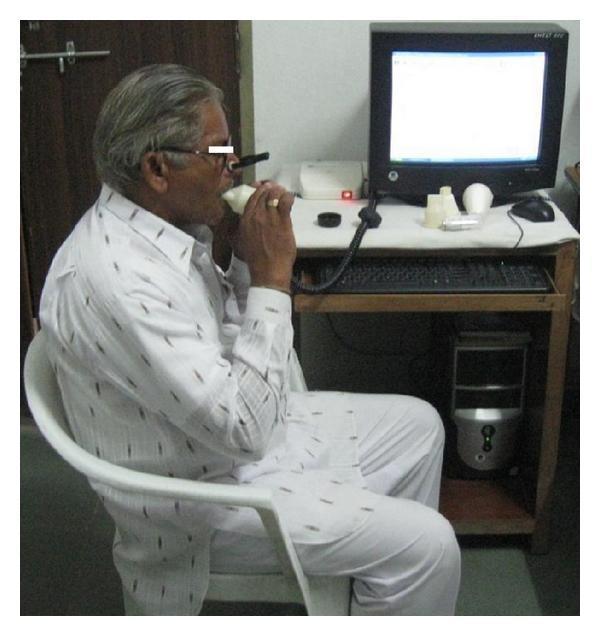
A clinical photograph illustrating a patient performing a Pulmonary Function Test (PFT) via spirometry in a clinical or research setting. The image depicts an older adult male seated upright, wearing a nose clip to ensure mouth-only breathing. He is actively interacting with a handheld spirometer, holding the disposable mouthpiece with both hands to maintain a tight seal. The device is connected via a data cable to a computer system, which includes a monitor displaying an active interface, likely for real-time visualization of flow-volume loops and spirograms. On the desk, several replacement white cylindrical mouthpieces and the hardware interface are visible. This visual serves as an educational example of the standardized setup for measuring lung volumes and ventilation capacities, such as Forced Vital Capacity (FVC) and Forced Expiratory Volume in 1 second (FEV1), highlighting the necessary equipment and proper patient positioning during the procedure.
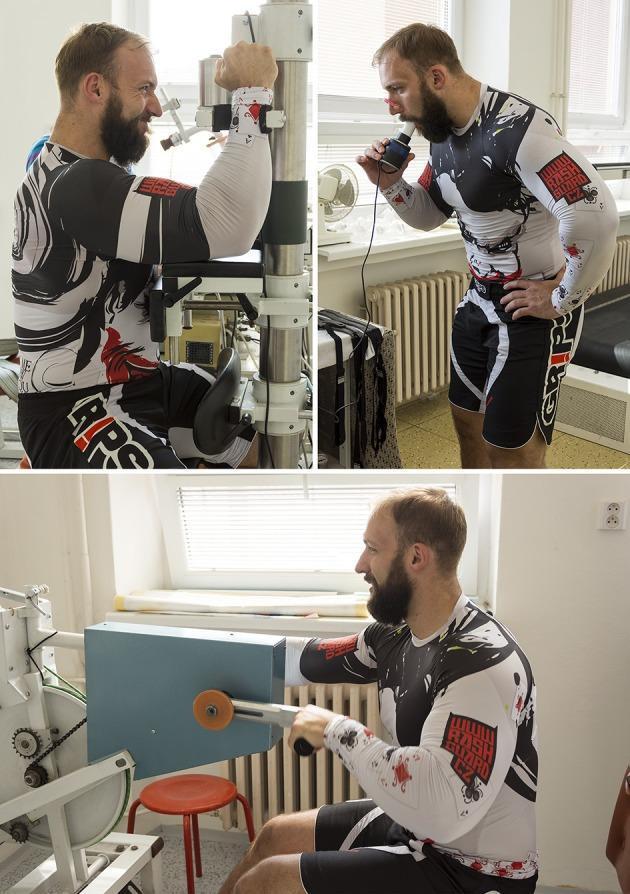
This composite of clinical photographs illustrates three standard methods for assessing physical performance and physiological capacity in a laboratory setting. Top Left: A participant undergoes maximal isometric strength measurement using an arm extension dynamometer. The subject is seated with the upper limb secured to a mechanical lever arm equipped with force transducers to quantify torque and muscular exertion. Top Right: A measurement of pulmonary function (spirometry) is shown. The participant uses a handheld spirometer with a nose clip to ensure isolated oral airflow, measuring lung volumes and capacities such as FVC and FEV1. Bottom: The participant is engaged in an anaerobic capacity assessment via a Wingate anaerobic test. This involves high-intensity cycling on a specialized ergometer to measure peak power, anaerobic fatigue, and total anaerobic work. These tests are essential in sports medicine and exercise physiology for evaluating cardiovascular fitness, neuromuscular strength, and metabolic efficiency.
ventilation perfusion V/Q ratio lung zones
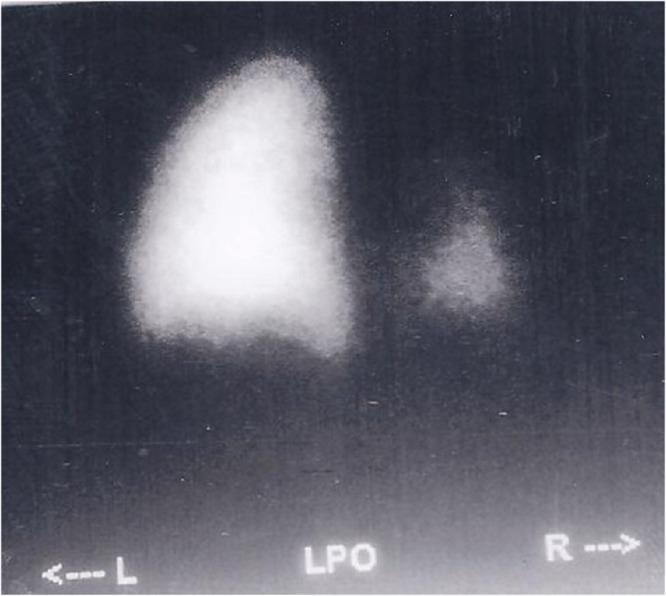
A diagnostic nuclear medicine image depicting a Ventilation-Perfusion (V/Q) scan, specifically in the Left Posterior Oblique (LPO) view as indicated by the label. The scan displays the radioisotope distribution within the lungs. The left lung (labeled 'L') appears physiologically normal with a well-defined, vertically elongated shape and homogeneous high-intensity tracer uptake across the upper, middle, and lower zones. In contrast, the right lung (labeled 'R') demonstrates significant pathology characterized by marked hypoplasia or a perfusion/ventilation defect. This region is substantially smaller, more rounded, and exhibits much lower signal intensity compared to the left side. The lower zone of the right lung is notably absent or poorly visualized, consistent with a hypoplastic lower lobe or a severe segmental defect. This imaging is utilized in pulmonology and radiology to assess pulmonary vascularity, ventilation efficiency, and congenital or acquired thoracic abnormalities.
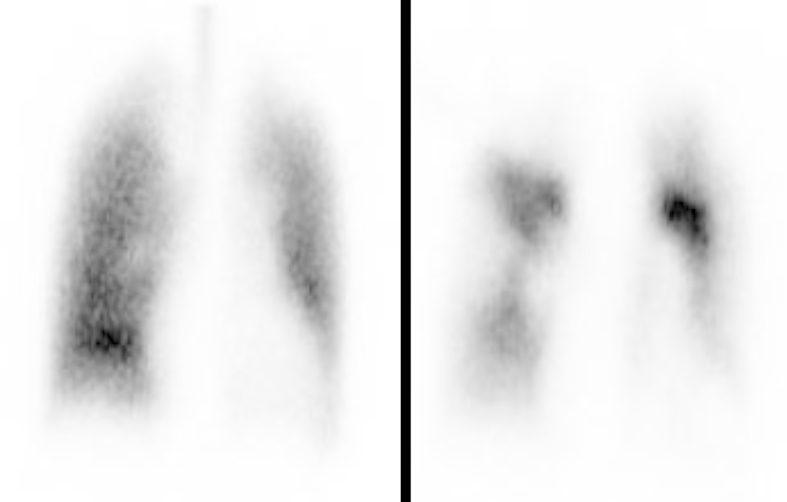
**Imaging Modality:** Lung Scintigraphy (V/Q Scan) **Anatomical Region:** Bilateral lungs, thoracic cavity. **Observed Pathology:** The image demonstrates a classic ventilation-perfusion (V/Q) mismatch. The perfusion scan (right panel) reveals multiple large, wedge-shaped, segmental photopenic areas indicating significant perfusion defects throughout both lung fields. Conversely, the ventilation scan (left panel) shows relatively homogeneous tracer distribution without corresponding filling defects. **Characteristic Visual Features:** * **Perfusion Scan:** Multi-focal areas of absent or diminished radiopharmaceutical uptake, particularly noted in the middle and lower zones of the right lung and the mid-zone of the left lung. * **Ventilation Scan:** Preserved ventilation across both lung fields, contrasting with the perfusion irregularities. * **Pattern:** Non-matched defects, where ventilation is normal in areas of absent perfusion. **Clinical Context and Diagnostic Features:** This V/Q mismatch pattern is highly suggestive of pulmonary embolism (PE). The presence of multiple segmental perfusion defects in the setting of normal ventilation is the primary diagnostic criterion for a "high probability" lung scan for thromboembolic disease. These findings allow for the differentiation from obstructive lung diseases, which typically present with matched V/Q defects.
control of breathing respiratory centers medulla pons
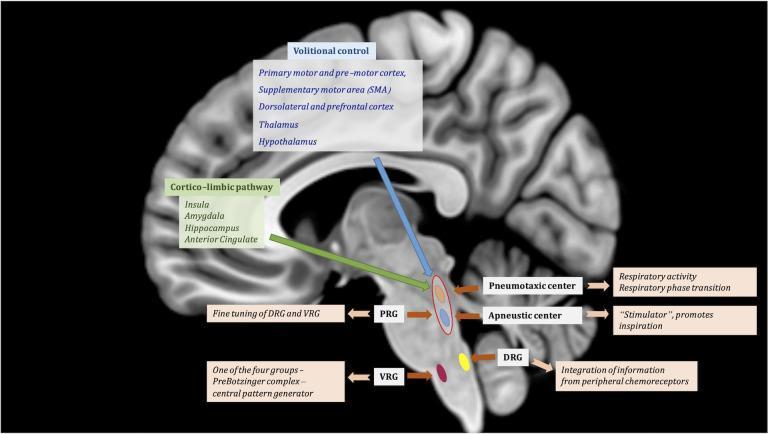
This medical illustration features a T1-weighted sagittal MRI of the human brain overlaid with a diagram of the central regulation of respiratory function. The graphic outlines two primary suprapontine pathways: the 'Volitional control' pathway (originating from the motor cortex, SMA, and thalamus/hypothalamus) and the 'Cortico-limbic pathway' (originating from the insula, amygdala, and hippocampus), both descending toward the brainstem. Within the pons, the Pontine Respiratory Group (PRG) is highlighted, comprising the Pneumotaxic center (responsible for respiratory phase transition) and the Apneustic center (a stimulator promoting inspiration). These centers exert fine-tuning over the medullary respiratory groups. In the medulla, the illustration identifies the Dorsal Respiratory Group (DRG), which integrates peripheral chemoreceptor information, and the Ventral Respiratory Group (VRG), specifically noting the PreBötzinger complex as the central pattern generator. The diagram effectively illustrates the hierarchical neuroanatomical structure of breathing regulation, from cortical modulation to autonomic brainstem control.
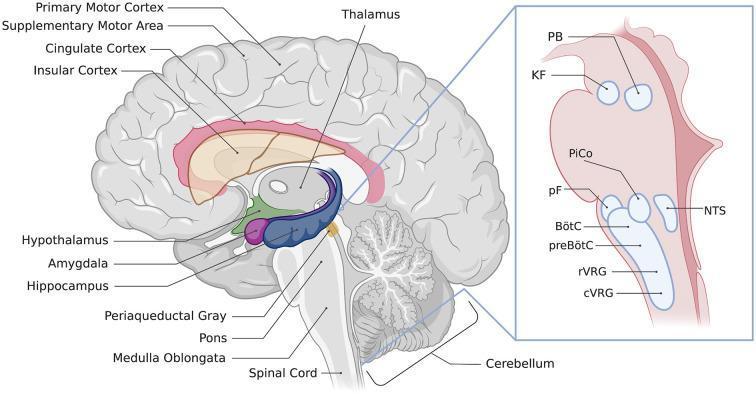
This medical anatomical diagram illustrates a mid-sagittal section of the human brain, highlighting the key regions involved in the neurological control of breathing. The main illustration color-codes forebrain and limbic structures: the Cingulate Cortex (pink), Insular Cortex (tan), Thalamus (gray), Hypothalamus (green), Amygdala (purple), and Hippocampus (dark blue). Landmarks such as the Primary Motor Cortex, Supplementary Motor Area, Periaqueductal Gray (PAG), Pons, Medulla Oblongata, and Cerebellum are clearly labeled. An enlarged inset provides a detailed view of the brainstem's respiratory control centers within the medulla and pons. This inset identifies specialized nuclei including the Parabrachial nuclei (PB), Kölliker-Fuse nucleus (KF), post-inspiratory complex (PiCo), parafacial respiratory groups (pF), Nucleus of the solitary tract (NTS), Bötzinger complex (BötC), preBötzinger complex (preBötC), and the rostral and caudal ventral respiratory groups (rVRG, cVRG). The diagram effectively maps the hierarchical organization of respiratory regulation from higher cortical and limbic centers down to autonomic brainstem nuclei and the spinal cord.
surfactant alveolar surface tension lung compliance
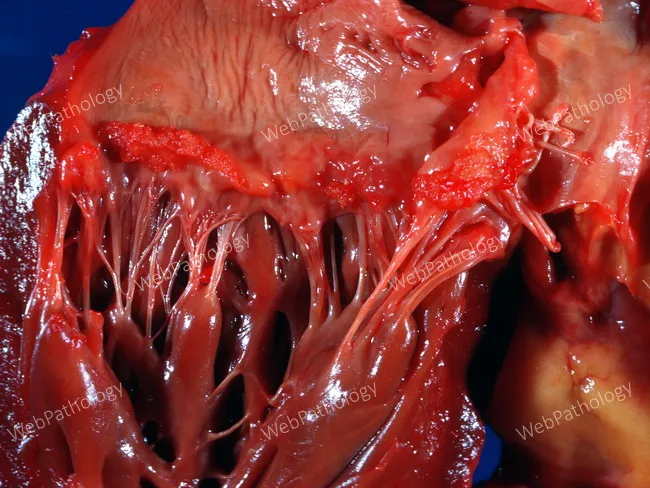
Gross macroscopic photograph of a resected lung parenchyma displaying extensive interstitial fibrosis with architectural distortion. The surface is densely red-brown and moist, with multiple translucent, web-like septa spanning alveolar spaces and creating irregular, honeycomb-like cystic spaces in subpleural regions. The parenchyma shows thickened alveolar walls and reticular remodeling throughout, most prominent in the bases and peripheries. There is vascular congestion and petechial hemorrhages in some areas; the pleural surface is partially adherent to fibrotic tissue. The underlying architecture demonstrates atelectasis and traction bronchiectasis in several lobes. The image reflects chronic fibrotic interstitial lung disease with end-stage features; however without histology correlation, the precise fibrosing phenotype is presumptive. This pattern aligns with idiopathic pulmonary fibrosis or other chronic fibrosing pneumonias, particularly those with a subpleural, basilar predominance. The gross features emphasize a restrictive physiology and reduced pulmonary compliance. Clinically, patients present with progressive dyspnea and nonproductive cough; radiology often shows reticular opacities, honeycombing, and architectural distortion on high-resolution CT. This specimen would be relevant for education in pulmonary pathology, interstitial lung disease differential, and surgical pathology workflows. It supports correlating clinical history, imaging, and histology to differentiate IPF from NSIP, hypersensitivity pneumonitis, and other fibrosing conditions. This description aids clinicians everywhere.
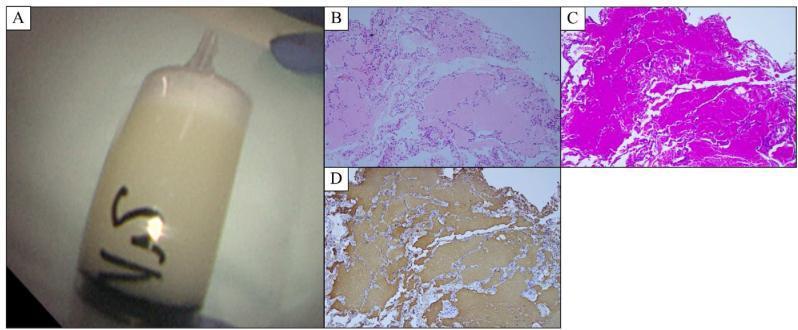
This composite image illustrates the diagnostic findings of pulmonary alveolar proteinosis (PAP). Panel A is a clinical photograph of bronchoalveolar lavage fluid (BALF) in a syringe, demonstrating a pathognomonic opaque, milky-white appearance due to surfactant accumulation. Panels B, C, and D are photomicrographs (100x magnification) of a transbronchial lung biopsy. Panel B (Hematoxylin and Eosin stain) shows alveolar spaces filled with an acellular, granular, and eosinophilic amorphous material, while the underlying alveolar architecture remains preserved. Panel C (Periodic Acid-Schiff stain) demonstrates that this intra-alveolar material is strongly PAS-positive, appearing deep magenta, which indicates a high carbohydrate/glycoprotein content. Panel D (Immunohistochemistry) shows positive brown staining for surfactant protein A within the alveolar exudate. Collectively, these images illustrate the characteristic macroscopic and histologic features of PAP, where impaired surfactant clearance leads to its accumulation within the distal air spaces, resulting in respiratory compromise.
pulmonary blood flow zones West lung apex base
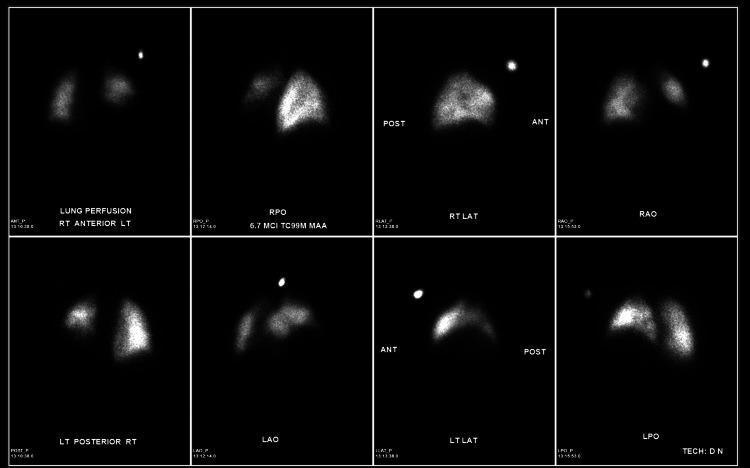
This diagnostic image is a nuclear medicine pulmonary perfusion scan consisting of eight static planar scintigraphic projections obtained using Technetium-99m labeled macroaggregated albumin (Tc-99m MAA). The views shown include Anterior (ANT), Posterior (POST), Right Lateral (RT LAT), Left Lateral (LT LAT), Right Posterior Oblique (RPO), Left Anterior Oblique (LAO), Right Anterior Oblique (RAO), and Left Posterior Oblique (LPO). The scan evaluates pulmonary blood flow distribution, with radiotracer uptake appearing as bright intensity against a dark background. A significant finding is a localized perfusion defect in the left lower lung zone, characterized by markedly decreased radiotracer uptake in the left base across multiple projections (notably ANT, POST, and LT LAT). In this clinical context, the defect corresponds to a significant elevation of the left hemidiaphragm and resultant basilar atelectasis, rather than a pulmonary embolism, as there is no mention of a ventilation-perfusion mismatch. The right lung shows relatively homogeneous and uniform tracer distribution throughout all zones. This imaging is used for evaluating suspected pulmonary embolism and diaphragmatic pathology in patients where contrast CT might be contraindicated.
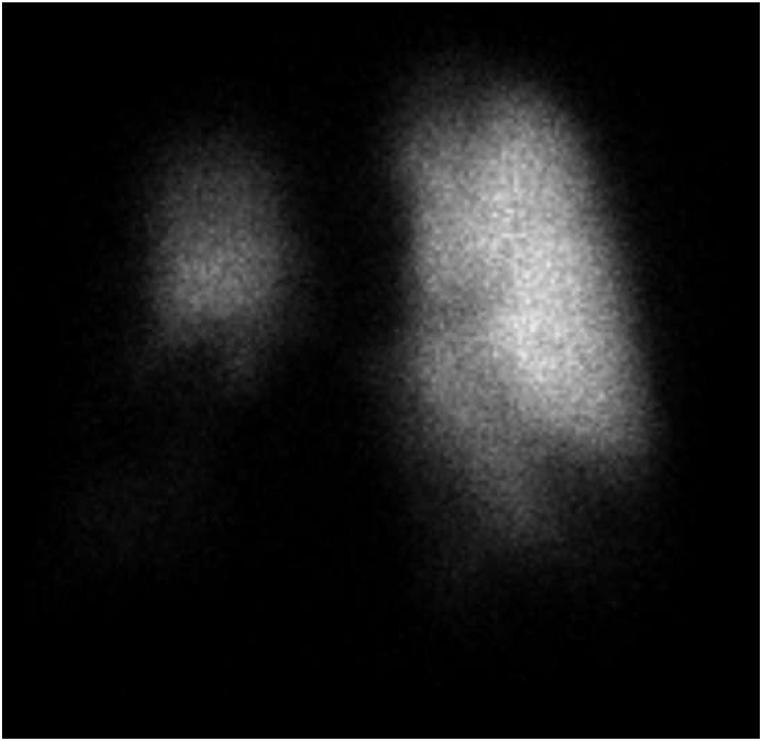
This diagnostic image is a nuclear medicine perfusion scan of the lungs in an anterior projection. The scan demonstrates a significant disparity in pulmonary blood flow distribution. The left lung exhibits relatively uniform and intense tracer uptake across its upper, middle, and lower zones. In contrast, the right lung shows marked perfusion defects, particularly localized to the right middle and right lower lobe regions. In these areas, the perfusion signal is significantly attenuated or absent compared to the right upper lobe and the entire left lung. Such findings are clinically consistent with severe vascular obstruction, such as that caused by fibrosing mediastinitis-induced pulmonary artery stenosis. This visual evidence serves as a critical educational example of how anatomical compression of the pulmonary vasculature results in segmental or lobar perfusion deficits, visible on V/Q scintigraphy, which can contribute to the development of precapillary pulmonary hypertension.
Respiratory System Physiology - Complete Medical Notes
1. OVERVIEW AND BASIC NUMBERS
- Breathing rate: 12-15 breaths/min
- Tidal volume: ~500 mL per breath
- Minute ventilation: 6-8 L/min
- O2 uptake: ~250 mL/min
- CO2 excretion: ~200 mL/min
- Respiratory quotient (RQ) = CO2 produced / O2 consumed = 0.8 (normal)
2. LUNG VOLUMES AND CAPACITIES
Static Lung Volumes (4 volumes)
| Volume | Definition | Normal Value |
|---|---|---|
| Tidal Volume (VT) | Volume of normal, quiet breath | ~500 mL |
| Inspiratory Reserve Volume (IRV) | Extra volume inspired above VT | ~3000 mL |
| Expiratory Reserve Volume (ERV) | Extra volume expired below VT | ~1200 mL |
| Residual Volume (RV) | Volume remaining after maximal expiration | ~1200 mL |
Key exam point: RV cannot be measured by spirometry. It requires helium dilution or body plethysmography.
Lung Capacities (2+ volumes combined)
| Capacity | Components | Normal Value |
|---|---|---|
| Inspiratory Capacity (IC) | VT + IRV | ~3500 mL |
| Functional Residual Capacity (FRC) | ERV + RV | ~2400 mL |
| Vital Capacity (VC) | IC + ERV = IRV + VT + ERV | ~4700 mL |
| Total Lung Capacity (TLC) | VC + RV | ~5900 mL |
FRC = equilibrium/resting volume of the lungs (balance between lung recoil inward and chest wall recoil outward). FRC and TLC cannot be measured by spirometry because they include RV.
Measuring FRC
- Helium dilution - helium (insoluble in blood) is breathed; concentration equilibrates, and FRC is back-calculated
- Body plethysmograph - uses Boyle's Law (P × V = constant)
3. VENTILATION
Minute Ventilation
Minute ventilation = VT × Breaths/min = 500 × 14 = ~7000 mL/min
Dead Space
- Anatomic dead space: ~150 mL - conducting airways (trachea, bronchi) that conduct air but don't exchange gas
- Physiologic dead space: anatomic + alveolar dead space (alveoli ventilated but not perfused)
- Measured by Bohr equation:
VD = VT × (PaCO2 - PECO2) / PaCO2
Alveolar Ventilation
VA = (VT - VD) × Breaths/min
Alveolar Ventilation Equation (KEY)
PACO2 = (VCO2 × K) / VA
Alveolar Gas Equation (KEY)
PAO2 = PIO2 - PACO2/R
- PAO2 = Alveolar PO2
- PIO2 = Inspired PO2 (~150 mmHg at sea level, humidified tracheal air)
- PACO2 = Alveolar PCO2 (~40 mmHg)
- R = Respiratory quotient (0.8)
- Normal PAO2 ≈ 150 - 40/0.8 = 100 mmHg
4. COMPLIANCE AND MECHANICS OF BREATHING
Compliance
- Compliance = ΔVolume / ΔPressure (how easily the lung expands)
- Normal lung compliance: ~200 mL/cmH2O
- High compliance = easier to inflate (emphysema - destroyed elastic tissue)
- Low compliance = harder to inflate (fibrosis, IRDS/RDS of newborn)
Pulmonary Surfactant
- Reduces surface tension - increases compliance, makes inflation easier
- Prevents alveolar collapse (atelectasis) - keeps small alveoli open
- Keeps alveoli uniform in size - prevents over-inflation of large alveoli while small ones collapse
Clinical pearl: In Infant Respiratory Distress Syndrome (IRDS/RDS), surfactant is absent in premature infants. Compliance drops dramatically, requiring huge effort to breathe. Treatment: exogenous surfactant + corticosteroids (to accelerate lung maturity).
Pressures
- Intrapleural pressure (Pip): -5 cmH2O at rest (always negative)
- Transpulmonary pressure (PTP): alveolar pressure - pleural pressure; the driving force for lung inflation
- During inspiration: diaphragm contracts → thoracic volume ↑ → intrapleural pressure becomes more negative → lungs expand
5. GAS EXCHANGE AND DIFFUSION
Fick's Law of Diffusion
- Extremely thin (~0.5 μm)
- Enormous surface area (~70 m²)
- Large pressure gradient for O2 and CO2
Partial Pressures (mmHg)
| Location | PO2 | PCO2 |
|---|---|---|
| Inspired air (sea level) | 160 | 0.3 |
| Humidified tracheal air | 150 | 0 |
| Alveolar air (PAO2) | 100 | 40 |
| Arterial blood (PaO2) | 95 | 40 |
| Venous blood | 40 | 45 |
| Tissues (cells) | <40 | >45 |
A-a Gradient (Alveolar-arterial O2 gradient)
A-a gradient = PAO2 - PaO2
6. OXYGEN TRANSPORT
Two Forms of O2 in Blood
- Dissolved - only 3% (0.003 mL O2 per 100 mL per mmHg PO2)
- Bound to hemoglobin (Hb) - 97% of O2 transport
Hemoglobin Capacity
- 1 g Hb binds 1.34 mL O2
- Normal Hb = 15 g/dL → can carry 20.1 mL O2 per 100 mL blood (oxygen-carrying capacity)
- Arterial blood (97% saturated): ~19.4 mL O2/100 mL
- Venous blood (75% saturated): ~14.4 mL O2/100 mL
- O2 delivery to tissues = ~5 mL O2 per 100 mL blood per pass
Oxygen-Hemoglobin Dissociation Curve
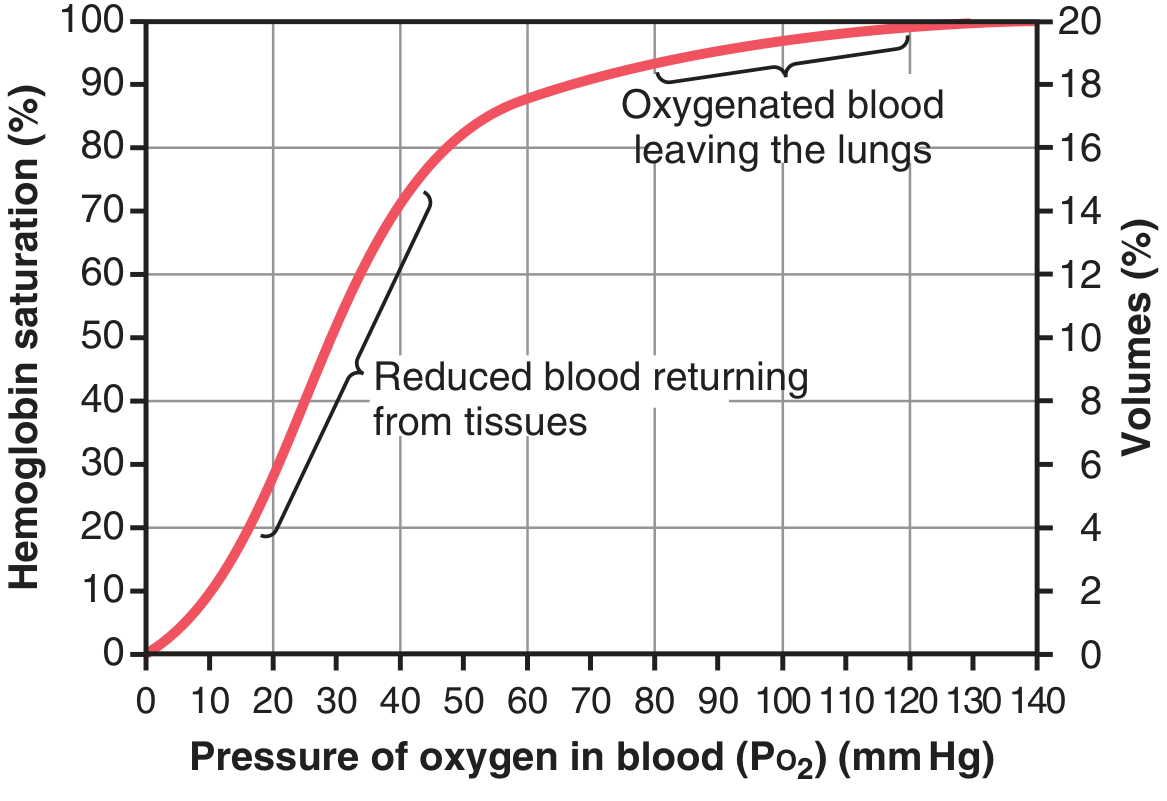
- At PO2 = 95 mmHg (arterial): SaO2 = 97%
- At PO2 = 40 mmHg (venous): SaO2 = 75%
- At PO2 = 27 mmHg: SaO2 = 50% (this is the P50)
- Normal P50 = 26-27 mmHg
Bohr Effect - Right Shift of ODC (↓ O2 affinity = more O2 released to tissues)
- ↑ CO2 (hypercapnia)
- ↑ H+ (acidosis / ↓ pH)
- ↑ Temperature (exercise, fever)
- ↑ 2,3-Bisphosphoglycerate (2,3-BPG / DPG) - important in chronic hypoxia, anemia
Mnemonic: CADET, face RIGHT - CO2, Acid, DPG, Exercise, Temperature → right shift
Left Shift of ODC (↑ O2 affinity = Hb holds onto O2 - bad for delivery)
- ↓ CO2, ↓ H+ (alkalosis), ↓ temperature, ↓ 2,3-BPG
- Fetal Hb (HbF) - binds less 2,3-BPG → left shift → better O2 uptake from placenta
- MetHb, CO poisoning → cannot release O2
7. CARBON DIOXIDE TRANSPORT
| Form | % of Total |
|---|---|
| Bicarbonate (HCO3-) | 70% (most important) |
| Carbaminohemoglobin (bound to Hb) | 23% |
| Dissolved CO2 | 7% |
Bicarbonate Formation (in RBCs)
CO2 + H2O → H2CO3 → H+ + HCO3- (catalyzed by carbonic anhydrase)
- HCO3- exits RBC in exchange for Cl- (chloride shift / Hamburger phenomenon)
- H+ is buffered by hemoglobin
Haldane Effect (KEY exam topic)
Compare: Bohr effect = O2 release is affected by CO2/H+ | Haldane effect = CO2 release is affected by O2
8. VENTILATION-PERFUSION (V/Q) RELATIONSHIPS
Normal V/Q ratio = 0.8 (overall; VA ~4.2 L/min, Q ~5 L/min)
V/Q in Different Lung Zones (Upright position - West Zones)
| Zone | Location | Condition | V/Q Ratio | Gas Exchange |
|---|---|---|---|---|
| Zone 1 (Apex) | Top of lung | PA > Pa > Pv (alveolar pressure crushes capillaries) | High (>1) | Poor perfusion |
| Zone 2 (Middle) | Mid lung | Pa > PA > Pv | Intermediate | Best exchange |
| Zone 3 (Base) | Bottom of lung | Pa > Pv > PA (gravity) | Low (<1) | Best perfusion |
At the apex: V/Q ≈ 3 (over-ventilated relative to perfusion)
At the base: V/Q ≈ 0.6 (under-ventilated relative to perfusion)
V/Q Extremes
| Extreme | Definition | Effect | Example |
|---|---|---|---|
| V/Q = 0 (Shunt) | Perfusion without ventilation | Blood bypasses gas exchange; gives venous blood | Pneumonia, atelectasis, ARDS |
| V/Q = ∞ (Dead space) | Ventilation without perfusion | Wasted ventilation | Pulmonary embolism |
V/Q Mismatch - Effect on Blood Gases
- Low V/Q (shunt): Hypoxemia (↓ PaO2) - does NOT correct well with O2 alone
- High V/Q (dead space): Hypercapnia and hypoxemia; corrects with supplemental O2
- V/Q mismatch is the most common cause of hypoxemia in clinical practice
9. CONTROL OF BREATHING
Brain Stem Respiratory Centers
| Center | Location | Function |
|---|---|---|
| Dorsal Respiratory Group (DRG) | Medulla | Controls inspiratory rhythm (basic breathing drive); receives input from CN IX, X; sends output via phrenic nerve |
| Ventral Respiratory Group (VRG) | Medulla | Active during forced expiration and heavy exercise |
| PreBötzinger complex | Medulla | Pacemaker / central pattern generator for breathing |
| Apneustic center | Lower pons | Prolongs inspiration (stimulates DRG); lesion causes apneusis (prolonged inspiratory gasps) |
| Pneumotaxic center | Upper pons | Turns OFF inspiration (limits tidal volume); regulates respiratory rate |
Chemoreceptors
Central Chemoreceptors (most important for minute-to-minute control)
- Located on the ventral surface of the medulla
- Respond to CSF pH (which reflects arterial PCO2)
- CO2 freely crosses the blood-brain barrier → enters CSF → forms H+ → stimulates ventilation
- H+ and HCO3- do NOT cross blood-brain barrier freely
- Hypercapnia (↑ PCO2) = ↑ ventilation | Hypocapnia = ↓ ventilation
Peripheral Chemoreceptors
- Carotid bodies (CN IX - most important) and Aortic bodies (CN X)
- Respond to: ↓ PaO2 (below 60 mmHg - the major stimulus for hypoxic drive), ↑ PaCO2, ↓ pH
- Only become the primary drive when central chemoreceptors are impaired (e.g., COPD with chronic hypercapnia)
COPD hypoxic drive (exam classic): In chronic CO2 retainers, central receptors are reset. Hypoxia (low PaO2) becomes the main drive. Giving high-flow O2 can remove this drive and cause hypoventilation.
Other Receptors
- Pulmonary stretch receptors (vagus): fire with lung inflation → Hering-Breuer reflex (stops inspiration when lungs are over-inflated - prevents over-distension)
- Irritant receptors: respond to smoke, dust → cough, bronchoconstriction
- J-receptors (juxtacapillary): respond to interstitial edema → dyspnea
10. ACID-BASE BALANCE AND RESPIRATORY COMPENSATION
Normal Blood Gas Values
| Parameter | Normal Value |
|---|---|
| pH | 7.35 - 7.45 |
| PaCO2 | 35 - 45 mmHg |
| PaO2 | 80 - 100 mmHg |
| HCO3- | 22 - 26 mEq/L |
| SaO2 | 95 - 100% |
Respiratory Acid-Base Disorders
| Disorder | pH | PaCO2 | Cause | Compensation |
|---|---|---|---|---|
| Respiratory Acidosis | ↓ | ↑ | Hypoventilation (COPD, opioids, neuromuscular disease) | Kidneys retain HCO3- |
| Respiratory Alkalosis | ↑ | ↓ | Hyperventilation (anxiety, altitude, pregnancy, sepsis early) | Kidneys excrete HCO3- |
Henderson-Hasselbalch Equation
pH = 6.1 + log (HCO3- / 0.03 × PaCO2)
11. PULMONARY CIRCULATION
Key Features
- Low pressure system: mean pulmonary artery pressure = ~15 mmHg (vs systemic 90-100 mmHg)
- Low resistance: accommodates entire cardiac output at low pressure
- Hypoxic pulmonary vasoconstriction (HPV): unique to pulmonary circulation - vessels constrict (not dilate) in response to low O2. This is a protective mechanism to redirect blood from poorly ventilated areas. Chronic hypoxia → pulmonary hypertension → cor pulmonale.
Pulmonary Vascular Resistance (PVR)
- Decreases with increased lung volumes (capillaries stretched - alveolar vessels) and at moderate lung volumes (extra-alveolar vessels dilate)
- Minimum PVR occurs at FRC
12. NON-RESPIRATORY FUNCTIONS OF THE LUNG
- Metabolic: Converts angiotensin I → angiotensin II (ACE on pulmonary endothelium)
- Filtration: Removes microemboli from pulmonary capillaries
- Reservoir: Acts as blood reservoir for left ventricle
- Defense: Mucociliary clearance, alveolar macrophages
- Vocalization and cough
- pH regulation: CO2 blowing off adjusts pH
13. HIGH-YIELD CLINICAL CORRELATIONS FOR EXAMS
| Condition | Key Physiology |
|---|---|
| COPD (Emphysema) | ↑ Compliance (destroyed elastic tissue), air trapping, ↑ TLC, ↑ RV, ↓ FEV1/FVC |
| Restrictive Disease (Fibrosis) | ↓ Compliance, ↓ TLC, ↓ VC, FEV1/FVC normal or ↑ |
| Asthma | Bronchoconstriction, ↑ airway resistance, ↑ RV, ↓ FEV1/FVC during attack |
| Pulmonary Embolism | ↑ Dead space, V/Q = ∞ in affected zone, hypoxemia + hypocapnia (hyperventilation) |
| Pneumonia/Atelectasis | Shunt (V/Q = 0), hypoxemia not correctable with O2 |
| ARDS | ↓ Compliance, diffuse alveolar damage, refractory hypoxemia |
| RDS of Newborn | Surfactant deficiency, ↓ compliance, atelectasis, prematurity |
| CO Poisoning | CO binds Hb (affinity 240× > O2), left shift of ODC, tissue hypoxia despite normal PaO2 |
| Altitude | ↓ PO2, hyperventilation, respiratory alkalosis, ↑ 2,3-BPG (days later), ↑ EPO → polycythemia |
14. KEY SPIROMETRY PATTERNS
| Pattern | FEV1 | FVC | FEV1/FVC | TLC | Example |
|---|---|---|---|---|---|
| Obstructive | ↓↓ | ↓ or normal | <0.7 (↓) | ↑ or normal | COPD, Asthma |
| Restrictive | ↓ | ↓↓ | >0.7 (normal/↑) | ↓↓ | Fibrosis, Pleural effusion, Neuromuscular |
| Mixed | ↓↓ | ↓↓ | <0.7 | Variable | Severe COPD + Fibrosis |
FEV1/FVC <0.7 is the definition of airflow obstruction (GOLD criteria for COPD).
15. QUICK FORMULA SUMMARY CHEAT SHEET
| Formula | Equation |
|---|---|
| Alveolar Gas Equation | PAO2 = PIO2 - PACO2/R |
| Bohr Dead Space | VD = VT × (PaCO2 - PECO2)/PaCO2 |
| Alveolar Ventilation | VA = (VT - VD) × RR |
| O2 Content of Blood | CaO2 = (Hb × 1.34 × SaO2) + (0.003 × PaO2) |
| O2 Delivery (DO2) | DO2 = CaO2 × CO × 10 |
| Compliance | C = ΔV/ΔP |
| Henderson-Hasselbalch | pH = 6.1 + log [HCO3-/0.03×PCO2] |
16. MEMORY AIDS
- "IRDS babies need surfactant" - Premature baby, no surfactant, stiff lungs, needs CPAP/surfactant
- "CADET, face right" - CO2, Acid, DPG, Exercise, Temperature → right shift of ODC
- "Dead space = V/Q infinity = PE" | "Shunt = V/Q zero = pneumonia"
- "Pneumotaxic = OFF switch" | "Apneustic = ON switch"
- "Central chemo = CO2/pH" | "Peripheral chemo = O2 (mainly)"
- FRC = Equilibrium volume (no active muscle contraction)
- Only RV-containing volumes cannot be measured by spirometry (FRC, TLC, RV itself)