
Partograph from sia community medicine textbook
partograph labour monitoring cervical dilation
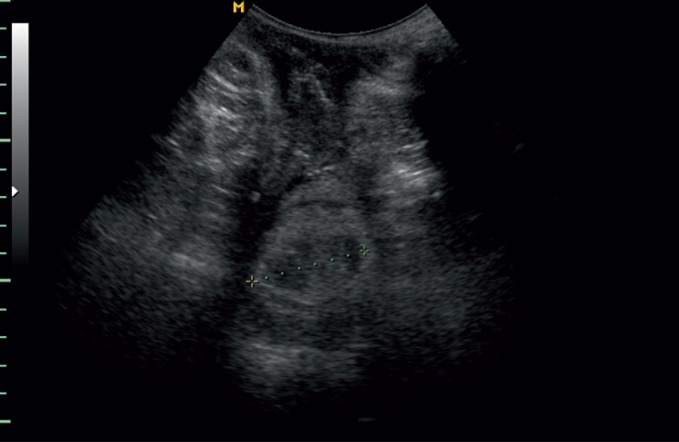
**Imaging Modality:** Two-dimensional (2D) transperitoneal ultrasound. **Anatomical Region:** Female pelvis, focusing on the uterine cervix in a transverse (axial) cross-section. **Observed Findings:** The image demonstrates a transverse view of the uterine cervix. Electronic calipers (indicated by ‘+’ markers and a dotted line) are positioned to measure the transverse diameter of the cervical canal, assessing for cervical dilation. **Characteristic Visual Features:** - The cervix appears as a circular, hypoechoic structure with a central echogenic or slightly dilated lumen. - The surrounding pelvic soft tissues are visible with varying echogenicity. - Measurement markers are placed at the maximum lateral margins of the internal or external cervical os to quantify the degree of opening. **Clinical Context:** This scan is used in obstetric monitoring to assess cervical progression during labor or to evaluate cervical competence in the second trimester of pregnancy. **Diagnostic Significance:** Quantitative measurement of cervical dilation via transperitoneal ultrasound serves as a non-invasive alternative to digital vaginal examination for monitoring labor progress or assessing risk for preterm birth.
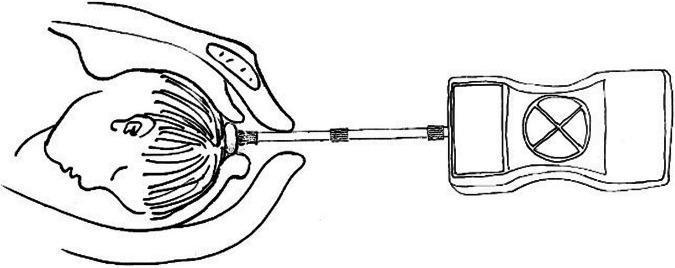
This schematic diagram illustrates a self-developed internal tocodynamometry machine used for monitoring fetal head descending thrust during labor. The illustration depicts three primary components: a pressure-sensitive sensor, a connecting rod, and an external monitoring unit. The sensor is shown in direct contact with the crown of a fetal head in the cephalic position, stabilized by a clinician's hand. A linear connecting rod, featuring three reinforcement bands, transmits the physical force from the sensor to the external device. The rectangular monitoring unit contains a display screen on the left and a circular dial with a cross-quadrant interface on the right. This diagnostic setup is designed to measure intrauterine pressure and fetal descent forces at specific stages of cervical dilation (3-5 cm, 5-8 cm, and 8-10 cm). The educational focus is on the instrumentation and clinical application of internal monitoring to assess labor progression and predict the necessity for emergency obstetric interventions.
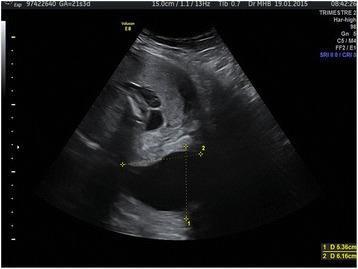
This diagnostic ultrasound image demonstrates a sagittal view of the uterine cervix in a patient at 21 3/7 weeks of gestation. The image displays a long but significantly dilated cervical canal, characterized by the presence of 'funneling' where the internal os is open. Crucially, the ultrasound reveals bulging fetal membranes (amniotic sac) protruding through the cervical opening and into the area of an Arabin pessary, which is visible as a distinct echogenic structure positioned around the cervix. Calipers on the image measure the dimensions of the cervical opening and the extent of the bulging membranes, indicating cervical insufficiency. The amniotic fluid within the protruding sac appears anechoic (black). This visual is representative of a high-risk obstetric scenario involving threatened second-trimester miscarriage or preterm labor, highlighting the sonographic monitoring of cervical changes and the mechanical limitations of a pessary in the presence of advanced cervical dilation.
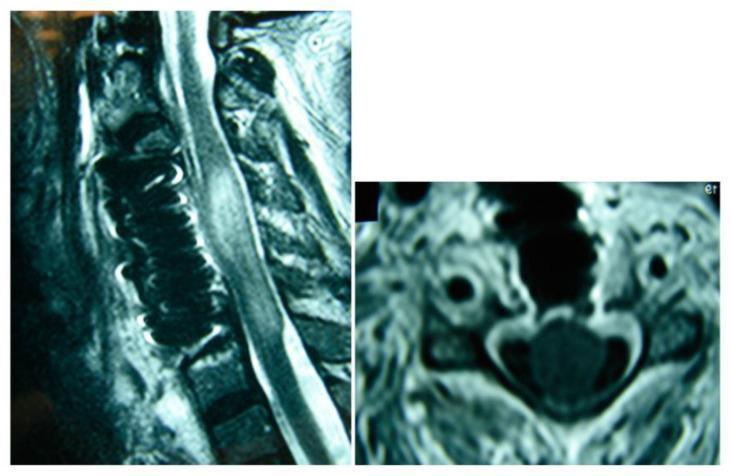
Postoperative magnetic resonance imaging (MRI) of the cervical spine in sagittal and axial views, demonstrating a multilevel anterior decompression and fusion. The sagittal view (left) reveals a titanium mesh cage positioned within the anterior column, replacing several vertebral bodies (corpectomy) to provide structural support. The spinal cord shows an area of intramedullary T2-hyperintensity and fusiform dilation, consistent with edema or syrinx formation following decompression for an infectious process such as spondylodiscitis. The axial view (right) shows the cross-sectional anatomy of the spinal canal with the spinal cord centrally located, exhibiting an altered morphology. Surrounding soft tissues and vascular structures are visible. This diagnostic imaging serves as an educational example of postoperative monitoring in complex spinal reconstructive surgery, highlighting the placement of metallic hardware and the subsequent radiological changes in the spinal cord parenchyma.
partograph WHO alert line action line cervical dilation fetal descent diagram
This schematic diagram illustrates a self-developed internal tocodynamometry machine used for monitoring fetal head descending thrust during labor. The illustration depicts three primary components: a pressure-sensitive sensor, a connecting rod, and an external monitoring unit. The sensor is shown in direct contact with the crown of a fetal head in the cephalic position, stabilized by a clinician's hand. A linear connecting rod, featuring three reinforcement bands, transmits the physical force from the sensor to the external device. The rectangular monitoring unit contains a display screen on the left and a circular dial with a cross-quadrant interface on the right. This diagnostic setup is designed to measure intrauterine pressure and fetal descent forces at specific stages of cervical dilation (3-5 cm, 5-8 cm, and 8-10 cm). The educational focus is on the instrumentation and clinical application of internal monitoring to assess labor progression and predict the necessity for emergency obstetric interventions.
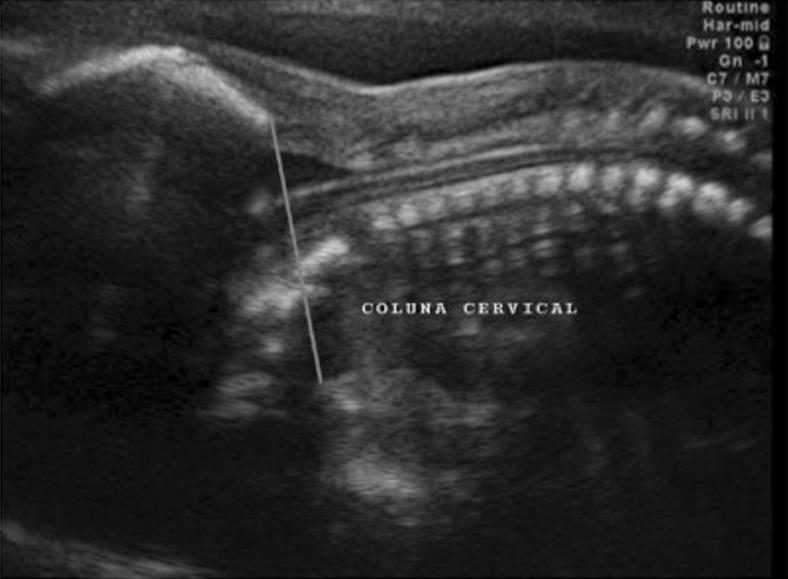
This diagnostic ultrasound image presents a sagittal view of a fetal posterior fossa and upper spine. The cervical spine is labeled 'COLUNA CERVICAL,' showing regularly spaced hyperechoic vertebral bodies. A vertical reference line, identified in clinical context as the 'occipitum-dens line,' is drawn between the lower margin of the occipital bone and the expected location of the cervical dens. This radiological landmark is used as a diagnostic tool in fetal neurosonography to evaluate the degree of hindbrain herniation (such as Chiari type II malformation) by measuring the descent of the cerebellum and brainstem relative to the foramen magnum. The image utilizes speckle reduction imaging (SRI) and harmonic imaging (Har-mid) to enhance tissue differentiation. This visual serves as a critical educational example of prenatal screening for neural tube defects and associated intracranial complications like hydrocephalus and posterior fossa crowding.
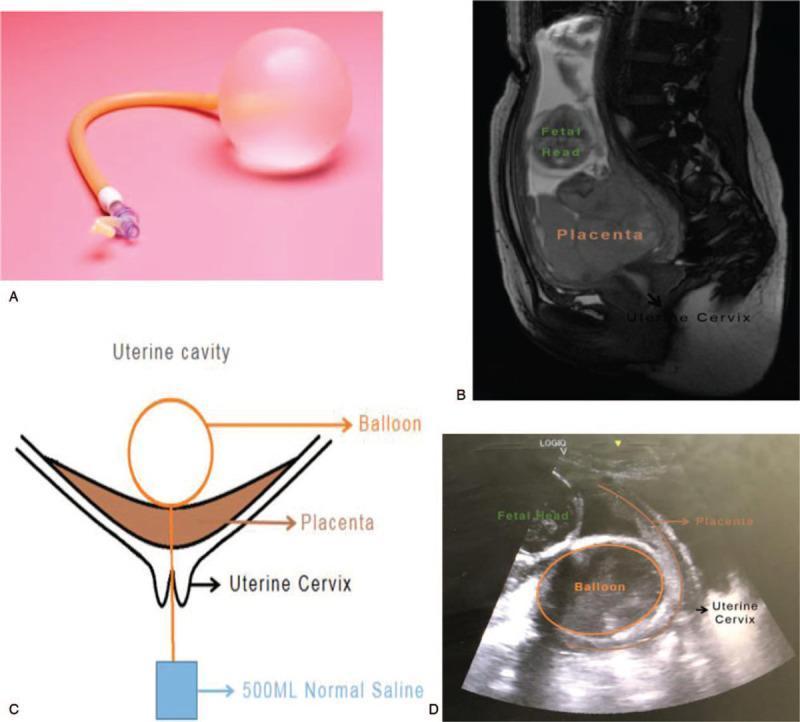
Multi-panel figure illustrating the application of a cervical ripening balloon for second-trimester pregnancy termination in cases of placenta previa. Panel A shows a clinical photograph of a single-balloon catheter with a translucent, spherical distal bulb and an orange inflation tube. Panel B presents a sagittal T2-weighted MRI of the pelvis, identifying the superior fetal head, an extensive inferior placenta overlying the internal os, and the uterine cervix. Panel C is a schematic diagram demonstrating the mechanical approach: the balloon is positioned within the uterine cavity between the fetus and the placenta, with a catheter extending through the placenta and cervix to an external 500mL saline weight for traction. Panel D is a transabdominal ultrasound image confirming the intra-amniotic placement of the inflated balloon in relation to the fetal head, placenta, and cervical canal. This educational sequence details the use of mechanical pressure and traction to manage hemorrhage and promote cervical dilation when the placenta covers the cervical os.
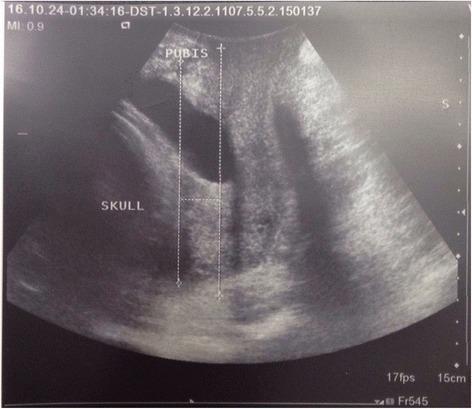
This diagnostic image is a translabial ultrasound (TLUS) captured in the sagittal plane, used for assessing fetal head descent during labor. The image illustrates the measurement of the 'fetal head–symphysis pubis distance' (HSPD). Key anatomical landmarks are labeled: the maternal 'PUBIS' (pubic symphysis) at the top and the fetal 'SKULL' on the left. Two vertical dotted caliper lines represent the reference axis, with a horizontal measurement line indicating the distance from the inferior-posterior margin of the pubic symphysis to the leading edge of the fetal skull. This sonographic parameter is clinically significant in obstetrics as a predictor for the mode of delivery and successful vaginal birth, often compared alongside the Bishop Score and cervical length. Machine metadata, including a Mechanical Index (MI) of 0.9, a frame rate of 17fps, and a depth scale of 15cm, are visible on the periphery.
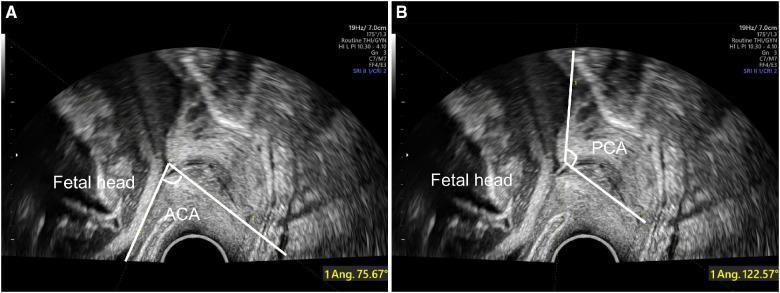
This diagnostic image consists of two sagittal-view transvaginal ultrasound (TVS) scans labeled A and B, illustrating the measurement of cervical angles in a late-pregnancy clinical setting. Both images show the fetal head in the cephalic presentation, the cervix, and the lower uterine segment. In Image A, the Anterior Cervical Angle (ACA) is measured at 75.67°, defined by the intersection of a line following the cervical canal and a line along the anterior uterine wall at the internal cervical os. In Image B, the Posterior Cervical Angle (PCA) is measured at 122.57°, formed by the intersection of the cervical canal line and a line extending along the posterior uterine wall. These ultrasound markers are utilized in obstetrics to assess the likelihood of successful spontaneous vaginal delivery (SVD) versus the risk of labor failure. The anatomical landmarks depicted facilitate the objective quantification of cervical-uterine geometry, where a wider angle generally indicates a more favorable alignment for fetal descent through the birth canal.
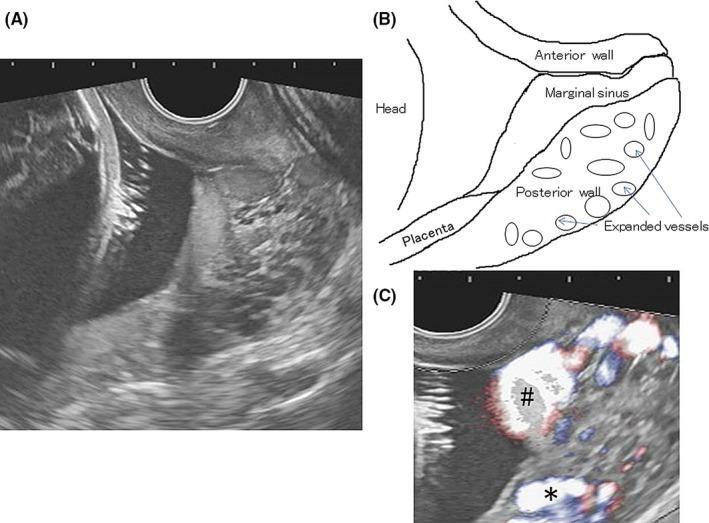
Diagnostic obstetric imaging showing transvaginal ultrasonography (TVS) of the cervical region in three panels. Panel A (B-mode) and the corresponding line diagram in Panel B illustrate an open cervix with low-lying posterior placentation. The placental parenchyma is situated near the internal os but does not occlude it. A key pathological finding is the descent of the placental marginal sinus through the dilated cervical canal towards the external os. Within the posterior cervical wall, multiple enlarged, tortuous vascular structures are identified. Panel C utilizes Color Doppler flow imaging to evaluate hemodynamics; flow is confirmed within the descended marginal sinus (marked with #) and the expanded cervical vessels (marked with *). Crucially, the imaging demonstrates no direct vascular communication between the marginal sinus and the expanded posterior cervical vessels. This case illustrates high-risk third-trimester ultrasound findings related to placental position and abnormal cervical vascularity, which are critical for assessing risks of obstetric hemorrhage.
partograph community medicine components alert line action line WHO 2000
Partograph - Community Medicine (Park's Textbook / Standard PSM)
Note: The medical library does not contain a textbook specifically by "Sia." The closest community medicine textbook available is Park's Textbook of Preventive and Social Medicine, which covers the partograph in the context of maternal health services. The content below follows standard community medicine curriculum as covered by Park's and WHO guidelines.
Definition
Purpose
- Assess progress of labour and detect abnormal labour early
- Monitor maternal and fetal well-being
- Serve as a legal record of labour management
- Facilitate referral decisions (especially at peripheral health facilities)
- Reduce maternal and perinatal morbidity and mortality
Structure of the WHO Partograph
PART I - Fetal Condition (Top section)
| Parameter | Frequency | Normal Range |
|---|---|---|
| Fetal Heart Rate (FHR) | Every 30 minutes | 120-160 beats/min |
| Status of membranes | Each vaginal examination | Intact / Ruptured |
| Colour of liquor (amniotic fluid) | Each vaginal examination | Clear (C); Absent (A); Meconium stained (M); Blood-stained (B) |
| Moulding of fetal skull | Each vaginal examination | 0 = sutures felt; + = sutures touching; ++ = sutures overlapping; +++ = fixed overlap |
PART II - Progress of Labour (Middle section - the most important)
- The most important parameter
- Plotted with an "X" on the graph
- X-axis = time in hours; Y-axis = cervical dilatation in cm (0-10 cm)
- Recording begins at active phase (3 cm or 4 cm dilatation)
- Expected rate: 1 cm/hour in active phase
- Drawn from 3 cm dilatation at a slope of 1 cm/hour
- Represents the mean rate of progress of the slowest 10% of a normal obstetric population (Philpott & Castle)
- If the plotting crosses to the right of this line, labour is slower than expected
- In a health centre: this signals transfer to hospital
- Drawn parallel to the alert line, 4 hours to its right
- Crossing this line = immediate action required (augmentation, ARM, or C-section)
- In hospital: this is the critical decision-making point
- Plotted with an "O"
- Assessed by abdominal palpation (fifths of head palpable above the pelvic brim)
- 5/5 = head entirely above brim; 0/5 = head fully engaged
- Normal: at least 1 cm descent per 4 hours
- Recorded as number per 10 minutes and duration
- Duration coded by shading: dotted (<20 sec), hatched (20-40 sec), solid (>40 sec)
- Recorded every 30 minutes
- Units/litre and drops/minute
PART III - Maternal Condition (Bottom section)
| Parameter | Frequency | Normal Range |
|---|---|---|
| Pulse | Every 30 minutes | 60-100/min |
| Blood pressure | Every 4 hours | <140/90 mmHg |
| Temperature | Every 4 hours | <37.5°C |
| Urine: volume | Each void | Adequate |
| Urine: protein / acetone | Each void | Absent |
Interpretation and Clinical Decisions
| Pattern | Meaning | Action |
|---|---|---|
| Plotting left of alert line | Normal labour progress | Continue monitoring |
| Plotting between alert and action line | Slower than expected | Augment vigilance; consider amniotomy; at periphery - refer |
| Plotting crosses action line | Abnormal - obstructed/prolonged labour | Immediate intervention: oxytocin augmentation or C-section |
| FHR <120 or >160 | Fetal distress | Change maternal position, oxygen, expedite delivery |
| Meconium-stained liquor | Fetal distress | Prepare for neonatal resuscitation; expedite delivery |
| Moulding ++ or +++ | Suggests CPD (cephalopelvic disproportion) | Evaluate for C-section |
Key Facts for Exams (PSM/Community Medicine)
- Partograph was included in WHO's Safe Motherhood Initiative and ICPD action plans
- WHO partograph trial (1994, Lancet) showed it reduced prolonged labour, C-section rates, and stillbirths
- The active phase of labour was historically defined as starting at 3-4 cm (original WHO) but the 2000 modified WHO partograph starts plotting at 4 cm, and the latest WHO Labour Care Guide (2020) starts at 5 cm
- Alert line = 1 cm/hr from time of admission / active phase entry
- Action line = 4 hours to the right of alert line
- The partograph does not cover the latent phase of labour
- It is part of Skilled Birth Attendance (SBA) training in India
- Required at all Type B sub-centres, PHCs, CHCs under the National Health Mission (NHM)
Partograph in India (Park's Context)
- Managing labour using the partograph is listed as an essential service at Type B sub-centres and PHCs
- SBA training mandates competence in partograph use
- It is used to identify need for referral from lower to higher facilities
- The Janani Suraksha Yojana (JSY) and LaQshya programme promote institutional delivery where partograph use is standard
Part from health planning
Pert from health planning
PERT - Programme Evaluation and Review Technique
(Under Network Analysis - Management Tools in Health Planning)
Context: Where PERT sits in Health Planning
- Cost-benefit analysis
- Cost-effective analysis
- Cost-accounting
- Input-output analysis
- Model
- Systems analysis
- Network Analysis (PERT and CPM) ← PERT is here
- Planning-Programming-Budgeting System (PPBS)
- Work sampling
- Decision making
Network Analysis (the parent concept)
"A network is a graphic plan of all events and activities to be completed in order to reach an end objective. It brings greater discipline in planning."
- (a) PERT - Programme Evaluation and Review Technique
- (b) CPM - Critical Path Method
PERT - Definition and Core Concept
"Every housewife who plans a meal so that each part of the menu is completed at the same time is using the basic technique of PERT."
The Arrow Diagram - Essence of PERT
- The logical sequence in which events must take place
- The activities connecting one event to the next
- Calculate the time by which each activity must be completed
- Identify critical activities (those that cannot be delayed without delaying the whole project)
Components of a PERT Network
| Term | Meaning |
|---|---|
| Event | A specific point in time - start or completion of an activity (shown as a circle/node) |
| Activity | A task or job that consumes time and resources (shown as an arrow between two events) |
| Network / Arrow Diagram | The complete graphic showing all events and activities in logical sequence |
Three Time Estimates in PERT
| Estimate | Symbol | Meaning |
|---|---|---|
| Optimistic time | a | Minimum time if everything goes perfectly |
| Most likely time | m | Time under normal conditions |
| Pessimistic time | b | Maximum time if everything goes wrong |
Critical Path Method (CPM) - the companion technique
"The longest path of the network is called the critical path. If any activity along the critical path is delayed, the entire project will be delayed."
| Feature | PERT | CPM |
|---|---|---|
| Time estimates | Three (optimistic, most likely, pessimistic) | One (deterministic) |
| Best suited for | New/uncertain projects (e.g., health programmes) | Repetitive/well-known projects |
| Focus | Time/uncertainty | Time and cost |
| Path concept | Probabilistic critical path | Fixed critical path |
Functions / Uses of PERT (as stated by Park's)
- Aids in planning, scheduling and monitoring the project
- Allows better communication between various levels of management
- Identifies potential problems in advance
- Furnishes continuous, timely progress reports
- Forms a solid foundation for building an evaluation and checking system
Application in Health Planning
- Setting up a new health centre
- Launching an immunisation campaign
- Constructing a hospital
- Introducing a new health programme
- Disease eradication/control campaigns (e.g., polio eradication)
(1)--[Select site]-->(2)--[Construct building]-->(3)--[Install equipment]-->(4)--[Train staff]-->(5)--[Start service]
         ↓
    [Procure equipment] (runs in parallel to construction)
Key Points for Exam (PSM / Community Medicine)
- PERT was developed by the US Navy in 1958 for the Polaris missile programme
- The two network techniques are PERT and CPM
- PERT uses 3 time estimates; CPM uses 1
- The formula for expected time: te = (a + 4m + b) / 6
- The critical path is the longest path in the network - any delay here delays the whole project
- PERT brings "greater discipline in planning" (Park's exact words)
- It is classified under management science tools in health planning
- Park's calls it a technique applicable to "a great variety of projects"