
explain about lipids in biochemistry from basis
Reading File
Now let me search the medical library for comprehensive lipid biochemistry content.
Finding Sources
Finding Sources
Finding Sources
Finding Sources
Reading File
Reading File
Reading File
Finding Sources
Excellent - I found Lippincott's Biochemistry textbook. Let me read from it and Harrison's for the best biochemistry foundation.
Finding Sources
Reading File
Reading File
Reading File
Finding Sources
Finding Sources
Reading File
Reading File
Reading File
Reading File
I now have excellent content from Lippincott's Biochemistry. Let me fetch a few key diagrams and pull in the lipoprotein section for a complete picture.
Loading Image
Reading File
Reading File
I now have comprehensive content from the Lippincott Biochemistry textbook. Let me also fetch one more key image and compile the full answer.
Loading Image
I now have all the content needed. Here is a comprehensive, from-basics explanation of lipids in biochemistry:
Lipids in Biochemistry - A Complete Guide from Basics
1. What Are Lipids?
Lipids are a heterogeneous group of water-insoluble (hydrophobic) organic molecules that are synthesized by the condensation of coenzyme A-thioesters or isoprene units. They are soluble in organic solvents but nearly insoluble in water. Because of their insolubility in aqueous solutions, body lipids are either:
- Compartmentalized (e.g., membrane-associated lipids, TAG droplets in adipocytes), or
- Transported in blood in association with proteins (lipoproteins or albumin)
Key functions of lipids:
- Major source of energy (more calorie-dense than carbohydrates or proteins)
- Provide the hydrophobic barrier that partitions aqueous contents of cells
- Fat-soluble vitamins (A, D, E, K) serve regulatory/coenzyme functions
- Prostaglandins and steroid hormones control homeostasis
- Structural components of cell membranes
2. Classification of Lipids
Here is a diagram showing the main classes:
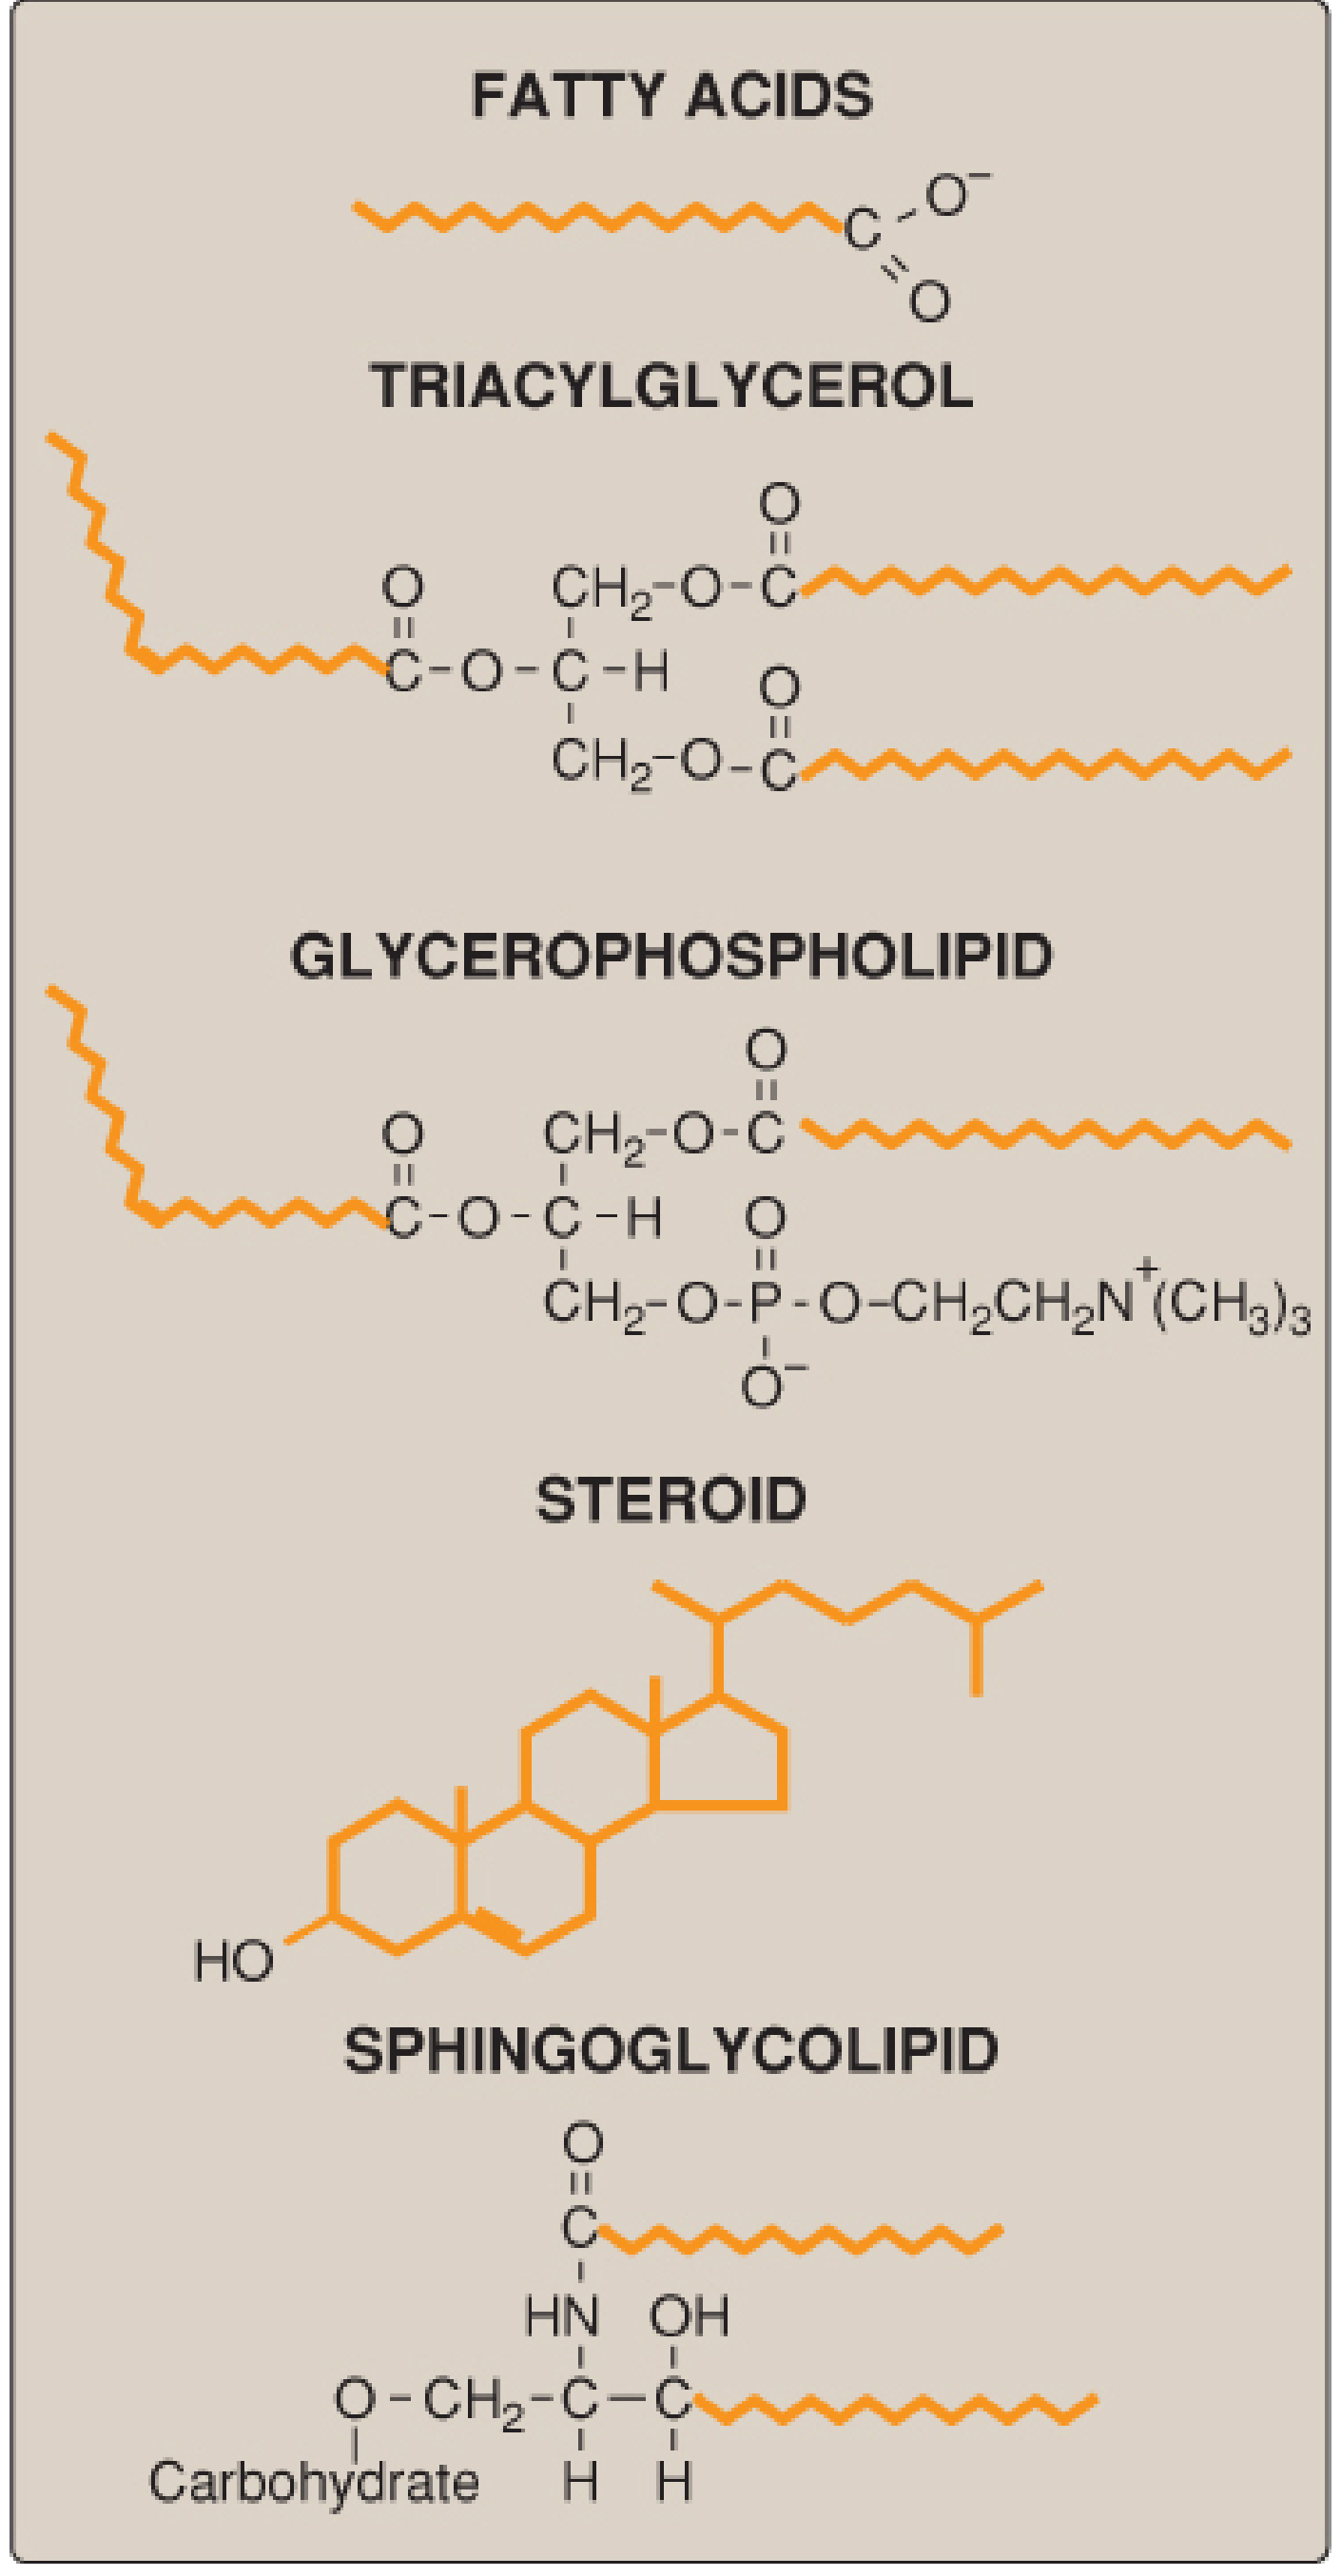
Fig. 15.1 - Structures of common lipid classes. Hydrophobic portions shown in orange. (Lippincott's Biochemistry, 8th ed.)
The major classes are:
| Class | Examples | Key Feature |
|---|---|---|
| Fatty acids | Palmitic, stearic, oleic | Simplest lipids; RCOOH formula |
| Triacylglycerols (TAG) | Triglycerides | 3 FA esterified to glycerol; energy storage |
| Glycerophospholipids | Phosphatidylcholine, PE | FA + glycerol + phosphate + head group; amphipathic |
| Sphingolipids | Sphingomyelin, gangliosides | Sphingosine backbone; cell signaling |
| Steroids | Cholesterol, cortisol, sex hormones | Fused 4-ring steroid nucleus |
| Waxes | Beeswax, earwax | Esters of long-chain FA + long-chain alcohol |
3. Fatty Acids - The Building Blocks
Fatty acids are the simplest lipid molecules, represented by the formula RCOOH (where R is an alkyl chain).
3a. Chain Length Classification
| Category | Carbon atoms |
|---|---|
| Short chain | 2-4 C |
| Medium chain | 6-12 C |
| Long chain | 14-26 C (most common in humans) |
| Very long chain | >26 C |
3b. Degree of Saturation
- Saturated fatty acids (SFA): No double bonds. The alkyl chain is extended and flexible; carbons rotate freely. Pack tightly together (higher melting point - solid at room temperature). Example: palmitic acid (C16:0), stearic acid (C18:0).
- Monounsaturated FA (MUFA): One double bond. Example: oleic acid (C18:1), found in olive oil.
- Polyunsaturated FA (PUFA): More than one double bond. Double bonds in natural fats are usually 3 carbons apart. Example: linoleic acid (C18:2), arachidonic acid (C20:4).
3c. Cis vs. Trans Configuration
- Cis-unsaturated FA: Have a fixed 30° bend at each double bond because two hydrogens are missing from the same side of the carbon double bond. Cannot pack tightly → lower melting points → liquid oils at room temperature.
- Trans FA: Result from industrial catalytic hydrogenation. Hydrogen is missing from each side of the double bond, so the chain is more linear, resembling saturated FA. Trans fats are solid at room temperature and are associated with increased cardiovascular risk (ASCVD).
In mammals, all naturally occurring unsaturated fatty acids are the cis variety.
3d. Essential Fatty Acids
Two fatty acids cannot be synthesized by humans and must be obtained from diet:
- Linoleic acid (omega-6) - from plants; converted to arachidonic acid
- Linolenic acid (omega-3) - from plants and marine sources
Arachidonic acid (derived from linoleic acid) is the precursor for prostaglandins and is required for myelination of neurons.
4. Triacylglycerols (TAG / Triglycerides)
TAG consist of three fatty acids esterified to a glycerol backbone. They are:
- The major form of dietary fat (>90% of dietary lipid intake)
- The main energy storage form in adipose tissue
- More energy-dense than carbohydrates: oxidizing 1 mole of palmitic acid (C16) produces ~129 moles of ATP vs. ~38 moles of ATP from glucose
Energy efficiency: Complete oxidation of palmitic acid yields 2340 Cal/mol (efficiency ~40% under standard conditions). TAG is a superior energy store because it is anhydrous (does not require water for storage, unlike glycogen).
5. Phospholipids
Phospholipids are amphipathic molecules - they have both a hydrophilic (polar) head and hydrophobic (fatty acid) tails. This makes them ideal membrane-forming molecules.
Glycerophospholipids
- Glycerol backbone with 2 FA chains at positions sn-1 and sn-2
- Phosphate group at sn-3 linked to a polar head group
- Common types:
- Phosphatidylcholine (lecithin) - most abundant membrane phospholipid
- Phosphatidylethanolamine (PE) - inner membrane leaflet
- Phosphatidylserine - inner leaflet, involved in apoptosis signaling
- Phosphatidylinositol - precursor to second messengers (IP3, DAG)
Sphingomyelin
- Sphingosine backbone (not glycerol)
- One FA attached via amide bond (ceramide)
- Phosphocholine head group
- Major component of myelin sheath
6. Cholesterol - Structure and Roles
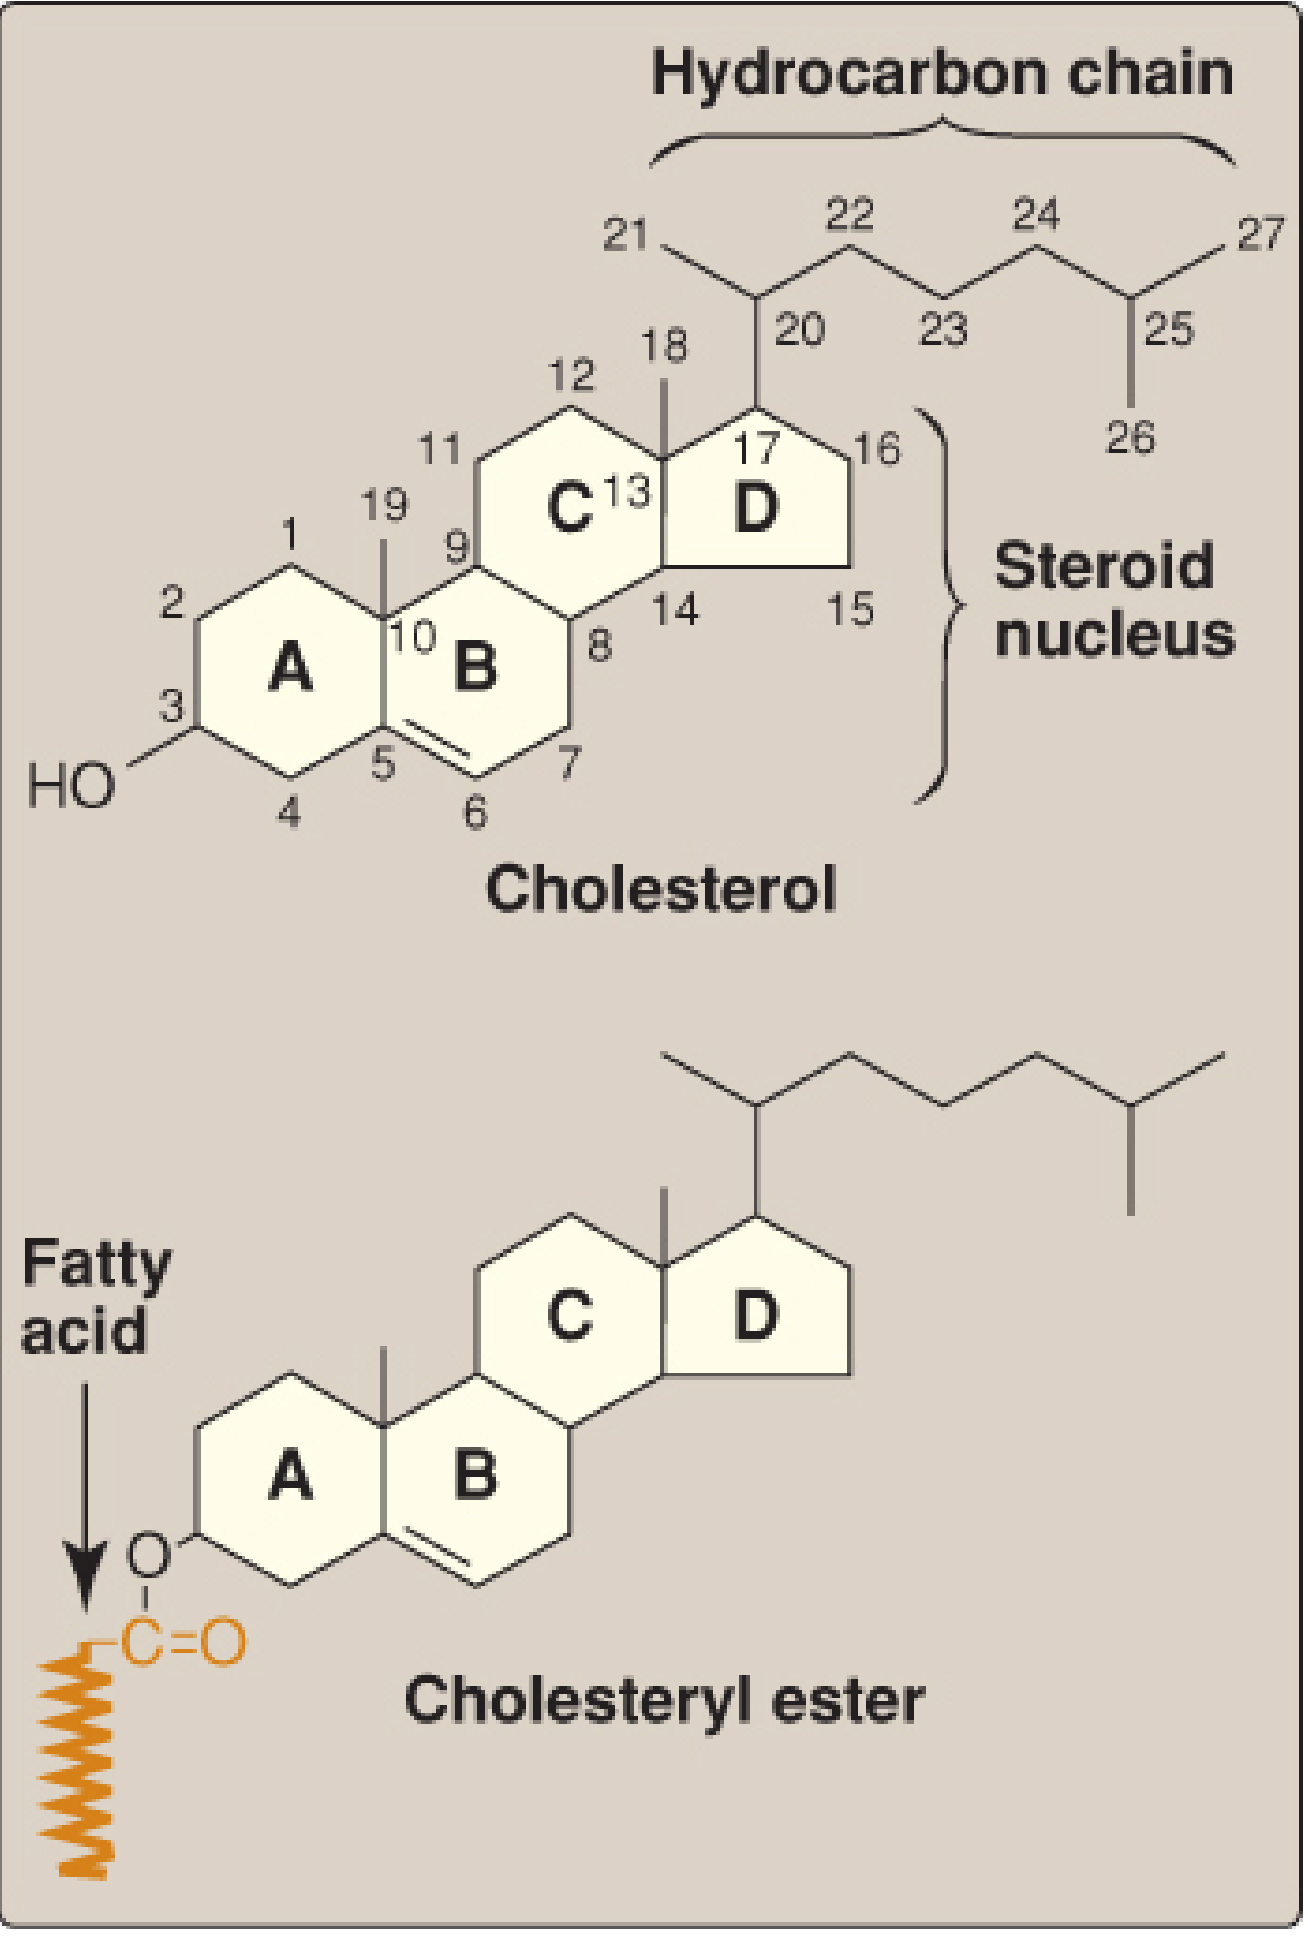
Fig. 18.2 - Structure of cholesterol and its ester. (Lippincott's Biochemistry, 8th ed.)
Cholesterol is a very hydrophobic compound consisting of:
- Four fused hydrocarbon rings (A-D) = the steroid nucleus
- 8-carbon branched hydrocarbon chain at C-17
- Hydroxyl group at C-3 of ring A
- Double bond between C-5 and C-6 of ring B
Roles of cholesterol:
- Structural component of cell membranes (modulates fluidity)
- Precursor for bile acids
- Precursor for steroid hormones (cortisol, aldosterone, testosterone, estrogen, progesterone)
- Precursor for vitamin D
- ~70% of plasma cholesterol is in LDL
Cholesteryl esters = cholesterol with a fatty acid attached at C-3. More hydrophobic; found in the core of lipoprotein particles.
7. Lipid Digestion and Absorption
| Location | Enzyme | Action |
|---|---|---|
| Mouth/Stomach | Lingual lipase, gastric lipase | Begin hydrolysis of short/medium-chain TAG; important in infants and CF patients |
| Small intestine | Pancreatic lipase + colipase | Major TAG hydrolysis; produces 2-monoglyceride + 2 FA |
| Small intestine | Cholesterol esterase | Hydrolyzes cholesteryl esters |
| Brush border | Various | Final absorption |
Emulsification by bile salts is essential before pancreatic lipase can work - bile salts (synthesized in liver from cholesterol) disperse dietary fat into micelles, vastly increasing surface area for enzymatic hydrolysis.
Absorption:
- Fatty acids and monoglycerides enter intestinal epithelial cells
- Re-esterified back into TAG in the smooth ER
- Packaged into chylomicrons with apolipoprotein B-48
- Released into lymphatics (not portal blood) via the thoracic duct into the bloodstream
8. Lipoproteins - Transport in Blood
Because lipids are insoluble in water, they are transported in blood as lipoproteins - particles with a hydrophobic lipid core surrounded by a hydrophilic shell of phospholipids, free cholesterol, and apolipoproteins.
Types of Lipoproteins
| Lipoprotein | Density | Major Lipid | Key Apolipoprotein | Function |
|---|---|---|---|---|
| Chylomicrons | Lowest | TAG (90%) | Apo B-48 | Carry dietary fat from gut to tissues |
| VLDL | Very low | TAG | Apo B-100, Apo C-II, Apo E | Carry endogenous TAG from liver to tissues |
| IDL | Intermediate | Cholesterol + TAG | Apo B-100, Apo E | Intermediate in VLDL → LDL conversion |
| LDL | Low | Cholesterol (70% of plasma) | Apo B-100 | Deliver cholesterol to peripheral tissues |
| HDL | Highest | Protein + phospholipids | Apo A-I | Reverse cholesterol transport (periphery → liver) |
Metabolism Pathways
Exogenous pathway (dietary fat):
- Dietary fat absorbed → chylomicrons assembled in intestinal cells with Apo B-48
- Enter lymphatics → bloodstream
- In capillaries: Apo C-II activates lipoprotein lipase (LPL), which hydrolyzes TAG
- FA taken up by muscle (energy) and adipose (storage)
- Chylomicron remnants taken up by liver (via Apo E receptor)
Endogenous pathway (liver-synthesized fat):
- Liver synthesizes VLDL containing Apo B-100 + TAG
- VLDL → IDL (after LPL removes TAG) → LDL (after further TAG removal by hepatic lipase)
- LDL delivers cholesterol to peripheral tissues via LDL receptor (Apo B-100/E receptor)
- Receptor-mediated endocytosis: LDL binds → clathrin-coated pit → endosome → lysosome → cholesterol released
Reverse cholesterol transport (HDL pathway):
- HDL is nascent (disk-shaped) from liver/intestine
- Acquires cholesterol from peripheral tissues via LCAT (lecithin:cholesterol acyltransferase; activated by Apo A-I)
- LCAT esterifies cholesterol → moves to HDL core
- Mature spherical HDL returns to liver → cholesterol excreted in bile
9. Fatty Acid Synthesis (De Novo Lipogenesis)
Location: Cytosol of liver cells (primarily), lactating mammary glands, adipose tissue
Starting material: Acetyl-CoA (from glucose via pyruvate, or amino acid catabolism)
Energy cost: ATP + NADPH
Starting material: Acetyl-CoA (from glucose via pyruvate, or amino acid catabolism)
Energy cost: ATP + NADPH
Key Steps:
-
Acetyl-CoA exits mitochondria as citrate (CoA cannot cross the inner mitochondrial membrane; acetyl group is shuttled out via the citrate shuttle)
-
Acetyl-CoA carboxylation → Malonyl-CoA (rate-limiting step)
- Enzyme: Acetyl-CoA carboxylase (ACC)
- Cofactor: Biotin (Vitamin B7)
- Requires ATP
- Activated by: citrate, insulin
- Inhibited by: palmitoyl-CoA, glucagon, epinephrine
-
Fatty acid synthase (FAS) complex - a multifunctional enzyme that repeats a 4-step cycle:
- Condensation
- Reduction (NADPH)
- Dehydration
- Reduction (NADPH again)
- Each cycle adds 2 carbons from malonyl-CoA
- Product of 7 cycles: Palmitate (C16:0)
Net equation: Acetyl-CoA + 7 Malonyl-CoA + 14 NADPH + 14 H⁺ → Palmitate + 7 CO₂ + 8 CoA + 14 NADP⁺ + 6 H₂O
10. Fatty Acid Catabolism (Beta-Oxidation)
Location: Mitochondrial matrix
Entry step: Long-chain fatty acids must be activated to fatty acyl-CoA, then transported into the mitochondria via the carnitine shuttle (carnitine acyltransferase I is the rate-limiting step; inhibited by malonyl-CoA)
Entry step: Long-chain fatty acids must be activated to fatty acyl-CoA, then transported into the mitochondria via the carnitine shuttle (carnitine acyltransferase I is the rate-limiting step; inhibited by malonyl-CoA)
The Beta-Oxidation Cycle (4 steps per turn):
- Oxidation (FAD → FADH₂)
- Hydration
- Oxidation (NAD⁺ → NADH)
- Thiolysis - releases acetyl-CoA + shorter acyl-CoA (by 2 carbons)
Energy yield from palmitate (C16):
- 7 turns of beta-oxidation → 8 acetyl-CoA + 7 FADH₂ + 7 NADH
- 8 acetyl-CoA enter the TCA (Krebs) cycle
- Total ATP yield: ~129 moles of ATP per mole of palmitate
Key point: Beta-oxidation depends on adequate oxaloacetate to accept acetyl-CoA into the TCA cycle. In fasting/starvation, OAA is diverted to gluconeogenesis → acetyl-CoA accumulates → ketone body synthesis (ketogenesis).
11. Cholesterol Synthesis (Mevalonate Pathway)
Location: Smooth ER and cytosol (primarily liver, intestine, adrenal cortex)
All carbons come from acetyl-CoA
All carbons come from acetyl-CoA
Steps:
- 2 Acetyl-CoA → Acetoacetyl-CoA (thiolase)
- Acetoacetyl-CoA + Acetyl-CoA → HMG-CoA (HMG-CoA synthase)
- HMG-CoA → Mevalonate ← RATE-LIMITING STEP
- Enzyme: HMG-CoA reductase (target of statins)
- Requires 2 NADPH
- Inhibited by: high intracellular cholesterol (feedback), statins, bile acids
- Mevalonate → Isopentenyl pyrophosphate (IPP) (5-carbon isoprene unit)
- IPP → Geranyl-PP → Farnesyl-PP → Squalene → Lanosterol → Cholesterol
- Farnesyl-PP is also used for protein prenylation (e.g., Ras protein anchoring)
Regulation of HMG-CoA reductase:
- Transcriptional: SREBP-2 (sterol regulatory element binding protein) - when cholesterol is low, SREBP-2 is activated → increases HMG-CoA reductase expression
- Post-translational: phosphorylation inactivates; dephosphorylation activates
- Degradation: accelerated by high intracellular cholesterol
12. Bile Acid Synthesis
Bile acids are synthesized in the liver from cholesterol:
- Primary bile acids: Cholic acid (triol) and Chenodeoxycholic acid (diol)
- Rate-limiting enzyme: Cholesterol 7-alpha-hydroxylase (in SER)
- Bile acids are conjugated with glycine or taurine before secretion
- In the intestine, bacteria convert them to secondary bile acids (deoxycholic acid, lithocholic acid)
- ~95% are reabsorbed in the terminal ileum → enterohepatic circulation
Function: Bile acids are amphipathic - they emulsify dietary fats, forming micelles that allow pancreatic lipase to access and hydrolyze TAG.
13. Clinical Correlations
| Disorder | Defect | Result |
|---|---|---|
| Familial hypercholesterolemia (FH) | LDL receptor mutation (Apo B-100 cannot bind) | Very high LDL-C, premature atherosclerosis |
| Familial chylomicronemia (Type I HLP) | LPL or Apo C-II deficiency | Massive hypertriglyceridemia, pancreatitis |
| Niemann-Pick disease Type C | Cannot transport free cholesterol out of lysosomes | Cholesterol accumulates in lysosomes |
| Sitosterolemia | Defective ABCG5/8 efflux transporter | Plant sterols accumulate in blood → early MI/stroke |
| CF + fat malabsorption | Absent pancreatic lipase | Cannot absorb fat-soluble vitamins |
| Atherosclerosis | Oxidized LDL → foam cells → plaque | CAD, stroke, PAD |
14. Summary Diagram - The Big Picture
Diet (TAG, Cholesterol)
↓
[Gut - Digestion + Emulsification by bile acids]
↓
Chylomicrons (Apo B-48)
↓ [LPL in capillaries]
Fatty acids → Muscle (energy) / Adipose (storage)
Remnants → Liver
Liver synthesizes:
Acetyl-CoA → Fatty acids (FAS) → TAG
Acetyl-CoA → Cholesterol (HMG-CoA reductase ← target of STATINS)
↓
VLDL (Apo B-100) → IDL → LDL
↓
Peripheral cells (via LDL receptor)
↓
Cholesterol homeostasis (ACAT, SREBP-2)
Peripheral cholesterol → HDL (Apo A-I) → Liver [Reverse cholesterol transport]
Source: Biochemistry, 8th ed., Lippincott Illustrated Reviews (primary source throughout); supplemented by Tietz Textbook of Laboratory Medicine, 7th Edition.
lipid metabolism
Lipid metabolism covers the digestion, absorption, transport, synthesis, and breakdown of all lipid types. It involves fatty acid oxidation (beta-oxidation), fatty acid synthesis (de novo lipogenesis), cholesterol metabolism, lipoprotein transport pathways, and ketogenesis. Key organs are the liver, adipose tissue, intestine, and muscle.
Searching sources...
Reading File
Finding Sources
Finding Sources
Finding Sources
Finding Sources
Reading File
Reading File
Reading File
Reading File
Finding Sources
Finding Sources
Finding Sources
Finding Sources
Reading File
Loading Image
Reading File
Loading Image
Reading File
Loading Image
I now have everything needed for a comprehensive, well-illustrated explanation. Let me compile the full answer.
Lipid Metabolism - Complete Biochemistry Guide
Lipid metabolism encompasses all the processes by which the body digests, absorbs, synthesizes, transports, stores, and breaks down lipids. The major pathways are:
- Lipolysis (fat mobilization from adipose)
- Fatty acid oxidation (beta-oxidation)
- Fatty acid synthesis (de novo lipogenesis)
- Ketogenesis and ketolysis
- Lipoprotein metabolism (transport pathways)
- Cholesterol metabolism
1. Overview of Lipid Storage and Mobilization
Fatty acids stored in white adipose tissue (WAT) as triacylglycerols (TAG) serve as the body's primary energy reserve. They are highly reduced and largely anhydrous, yielding 9 kcal/g - more than double the energy from carbohydrate or protein (4 kcal/g).
Lipolysis (TAG Breakdown in Adipose)
Three lipases act sequentially:
| Step | Enzyme | Product |
|---|---|---|
| 1 | Adipose triglyceride lipase (ATGL) | Diacylglycerol (DAG) |
| 2 | Hormone-sensitive lipase (HSL) | Monoacylglycerol (MAG) |
| 3 | MAG lipase | Glycerol + Free FA (FFA) |
Hormonal regulation:
- Epinephrine/glucagon (fasting): bind beta-adrenergic receptors → adenylyl cyclase → cAMP → PKA → phosphorylates and activates perilipins and HSL → lipolysis ON
- Insulin (fed state): dephosphorylates and inactivates HSL, suppresses ATGL expression → lipolysis OFF
Fate of products:
- Glycerol - cannot be used by adipocytes (no glycerol kinase). Travels to liver → converted to DHAP → enters glycolysis or gluconeogenesis
- Free fatty acids (FFA) - bind albumin in blood, transported to muscles (energy) and liver. Cannot be used by RBCs (no mitochondria) or brain (to any significant extent)
2. Fatty Acid Activation and the Carnitine Shuttle
Before oxidation, FFA must be activated to fatty acyl-CoA by acyl-CoA synthetase (thiokinase) at the outer mitochondrial membrane, consuming 2 ATP equivalents (ATP → AMP + PPi).
Since CoA cannot cross the inner mitochondrial membrane, long-chain fatty acyl-CoA must enter via the carnitine shuttle:
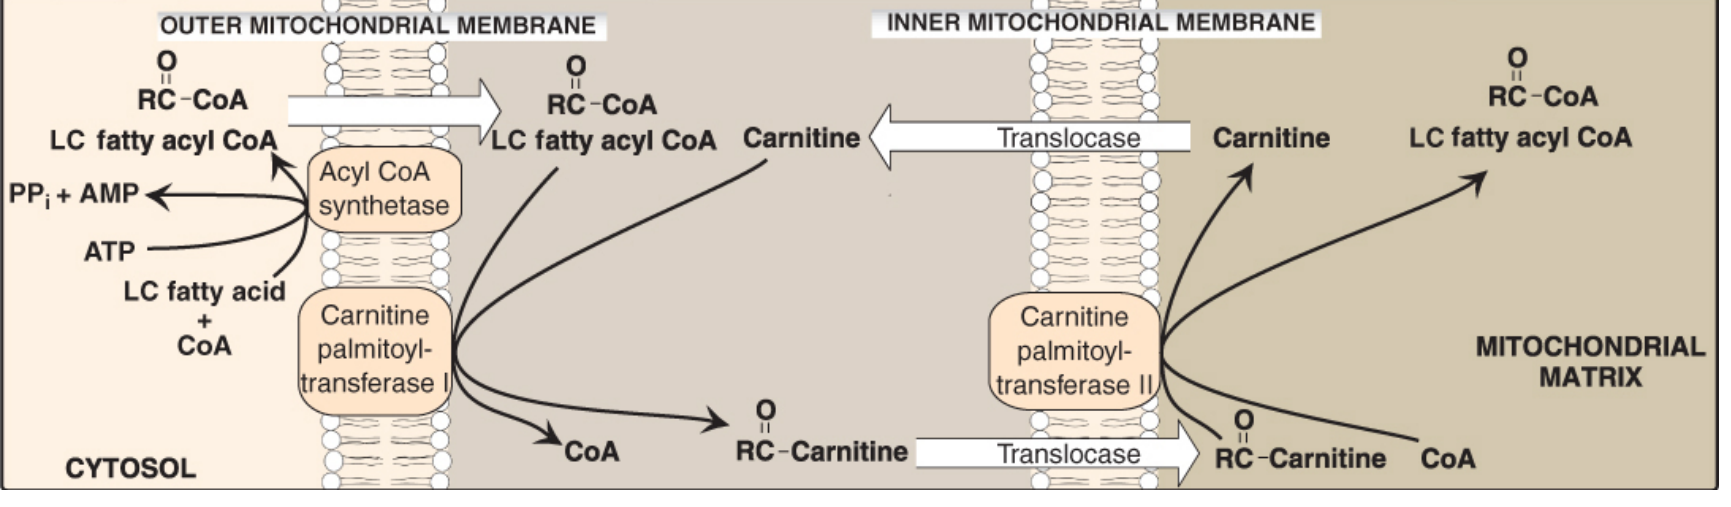
Figure 16.16 - Carnitine Shuttle (Lippincott's Biochemistry, 8th ed.)
Steps:
- CPT-I (carnitine palmitoyltransferase I) - outer mitochondrial membrane; transfers acyl group from CoA to carnitine → acylcarnitine. This is the rate-limiting step
- Translocase - transports acylcarnitine in, free carnitine out
- CPT-II - inner mitochondrial membrane; transfers acyl group back to CoA in the matrix
Key inhibitor: Malonyl-CoA inhibits CPT-I, thus when fatty acid synthesis is active (malonyl-CoA is elevated), fatty acid oxidation is simultaneously blocked. This prevents a futile cycle.
Carnitine is synthesized from lysine + methionine in the liver and kidneys. Skeletal and cardiac muscle cannot synthesize it and depend entirely on dietary/circulating supply (97% of body carnitine is in skeletal muscle).
3. Beta-Oxidation (Fatty Acid Catabolism)
Location: Mitochondrial matrix
Substrate: Fatty acyl-CoA
Substrate: Fatty acyl-CoA
The 4-step Repeating Cycle
Each cycle removes 2 carbons as acetyl-CoA and produces NADH + FADH₂:
| Step | Reaction | Enzyme | Coenzyme Change |
|---|---|---|---|
| 1 | Oxidation - remove 2H, form trans-double bond | Acyl-CoA dehydrogenase | FAD → FADH₂ |
| 2 | Hydration - add water across the double bond | Enoyl-CoA hydratase | - |
| 3 | Oxidation - oxidize hydroxyl to ketone | L-3-hydroxyacyl-CoA dehydrogenase | NAD⁺ → NADH |
| 4 | Thiolysis - cleave off 2-carbon acetyl-CoA | Thiolase (beta-ketothiolase) | CoA consumed |
The remaining acyl-CoA (now 2 carbons shorter) re-enters the cycle.
Energy Yield - Palmitate (C16:0)
- 7 cycles of beta-oxidation produce:
- 8 acetyl-CoA
- 7 FADH₂ → 7 × 1.5 ATP = 10.5 ATP
- 7 NADH → 7 × 2.5 ATP = 17.5 ATP
- 8 acetyl-CoA enter TCA cycle → 8 × 10 ATP = 80 ATP
- Minus 2 ATP for activation
- Net: ~106 ATP per palmitate molecule
Special Oxidation Pathways
| Fatty Acid Type | Additional Step | Where |
|---|---|---|
| Unsaturated (odd double bonds) | Isomerase converts cis-Δ³ → trans-Δ² | Mitochondria |
| Unsaturated (even double bonds) | 2,4-dienoyl-CoA reductase (requires NADPH) | Mitochondria |
| Odd-chain FA | Final product = propionyl-CoA → succinyl-CoA via methylmalonyl-CoA (requires B12) | Mitochondria |
| Very-long-chain FA (>22C) | Initial shortening occurs in peroxisomes (peroxisomal beta-oxidation) | Peroxisomes → then mitochondria |
4. Ketogenesis and Ketolysis
Why Ketone Bodies Are Made
During fasting, the liver is flooded with fatty acids from adipose. Elevated hepatic acetyl-CoA:
- Inhibits pyruvate dehydrogenase (PDH)
- Activates pyruvate carboxylase (PC) → OAA
- But OAA is diverted to gluconeogenesis, not TCA
- Also: fatty acid oxidation raises NADH, which shifts OAA → malate
- Result: OAA unavailable for TCA → acetyl-CoA accumulates → ketogenesis
Ketogenesis (in liver only)
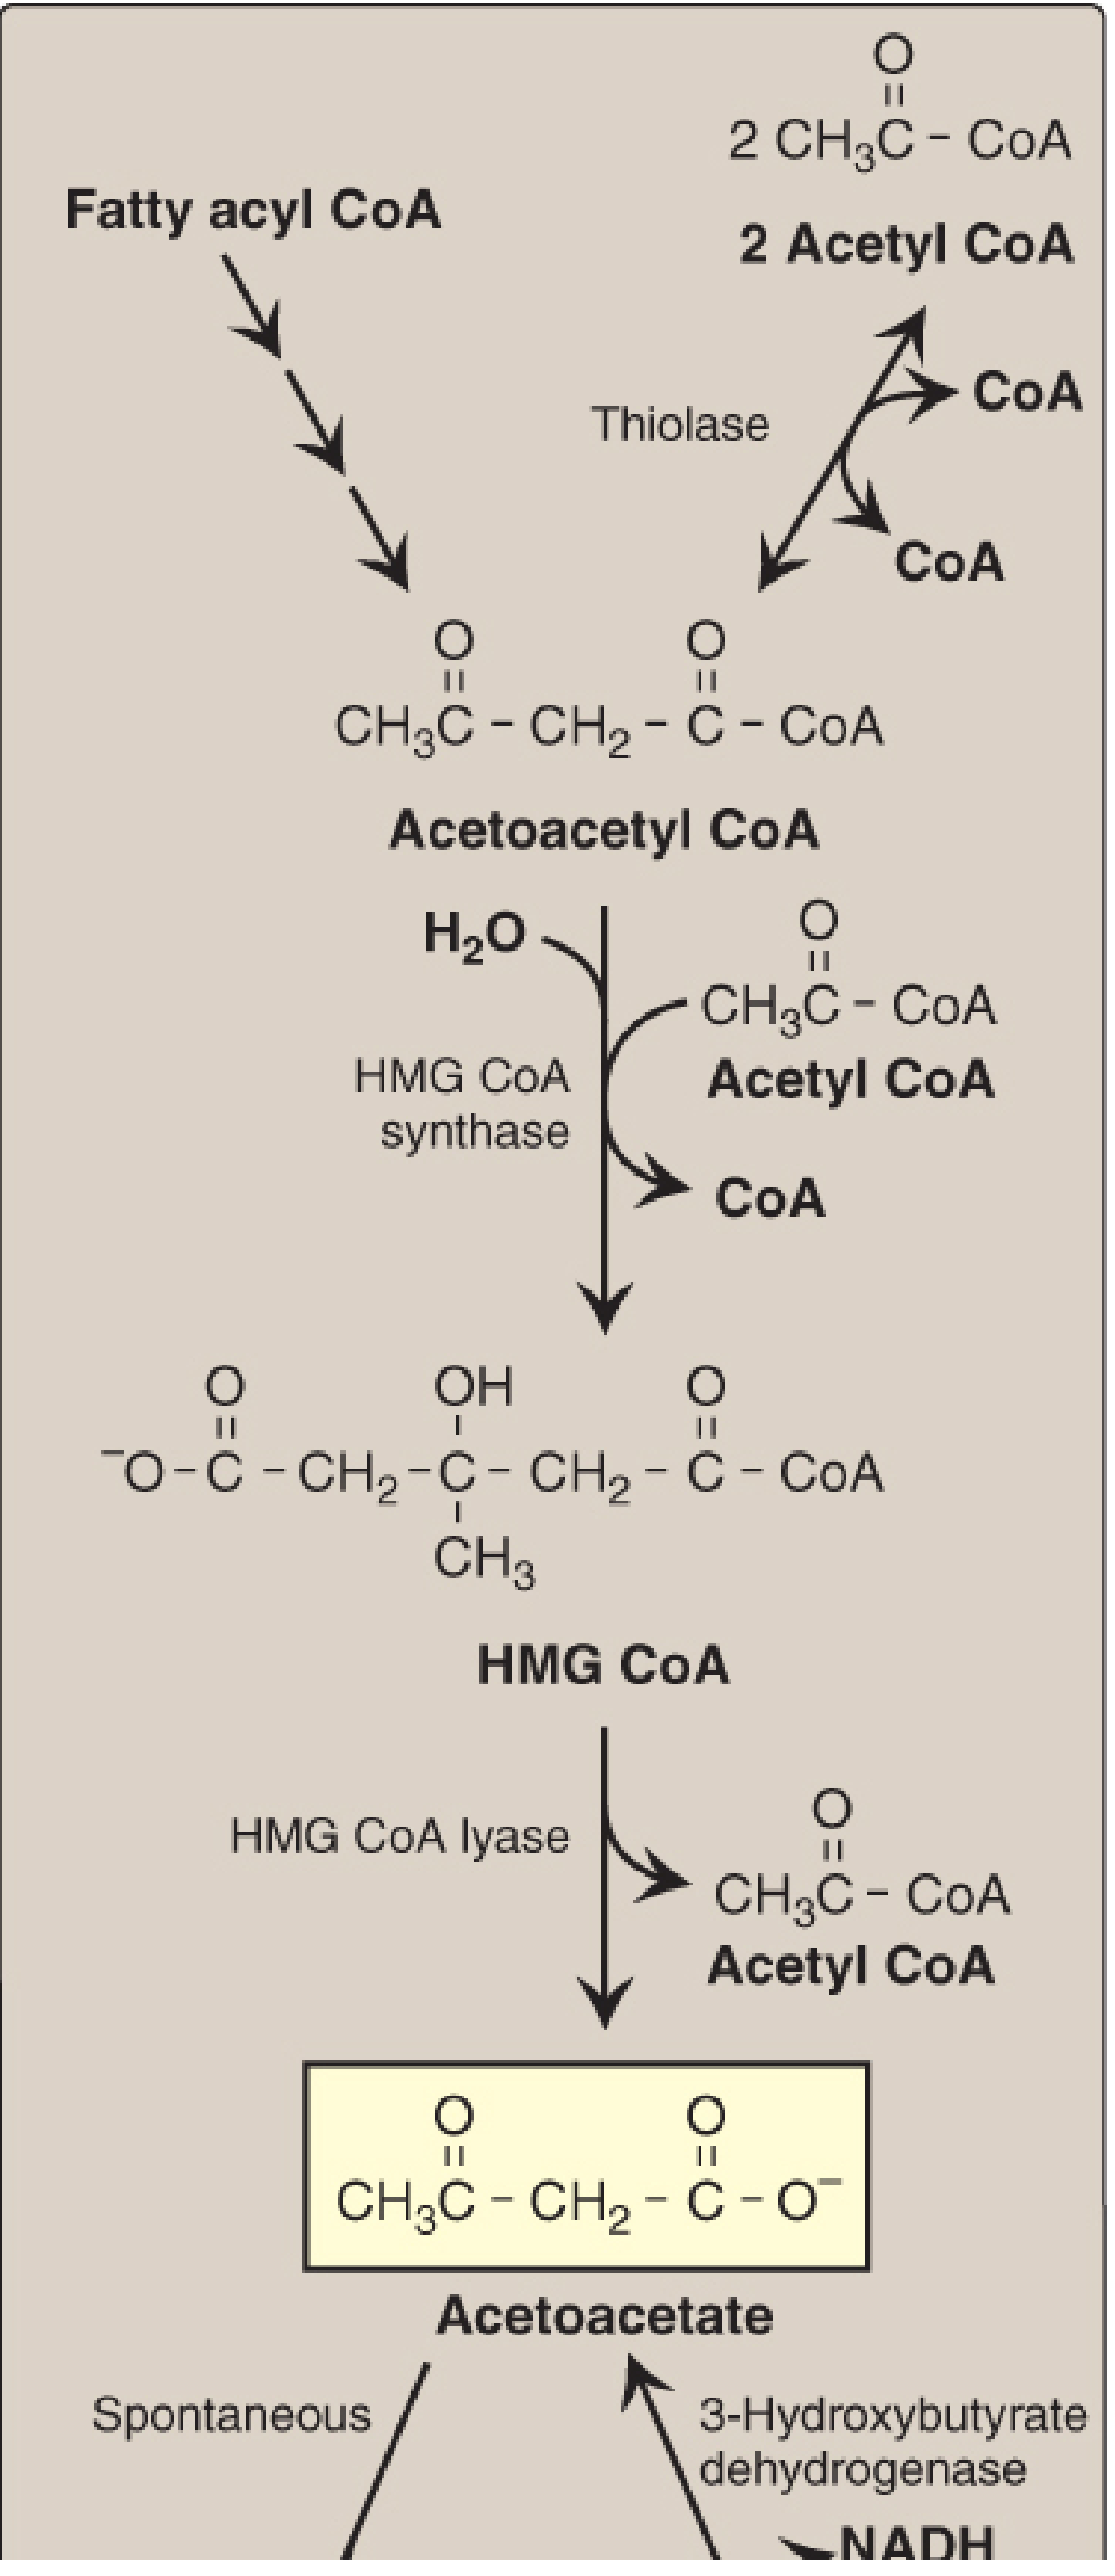
Figure 16.22 - Ketone body synthesis (Lippincott's Biochemistry, 8th ed.)
Steps:
- 2 Acetyl-CoA → Acetoacetyl-CoA (thiolase, reversal)
- Acetoacetyl-CoA + Acetyl-CoA → HMG-CoA - rate-limiting; HMG-CoA synthase (mitochondrial; present in significant amounts only in liver)
- HMG-CoA → Acetoacetate + Acetyl-CoA (HMG-CoA lyase)
- Acetoacetate + NADH → 3-Hydroxybutyrate (3-hydroxybutyrate dehydrogenase); high NADH ratio during FA oxidation favors this direction
- Acetoacetate → Acetone (spontaneous, non-enzymatic decarboxylation; produces fruity breath in DKA)
Three ketone bodies: Acetoacetate, 3-hydroxybutyrate (beta-hydroxybutyrate), acetone
Ketolysis (in peripheral tissues - muscle, brain, kidney)
The liver makes ketone bodies but cannot use them (lacks thiophorase).
Extrahepatic tissues use them as follows:
Extrahepatic tissues use them as follows:
- 3-Hydroxybutyrate → Acetoacetate + NADH (3-hydroxybutyrate dehydrogenase)
- Acetoacetate + Succinyl-CoA → Acetoacetyl-CoA + Succinate (thiophorase / succinyl-CoA:acetoacetate CoA transferase - the enzyme absent in liver)
- Acetoacetyl-CoA → 2 Acetyl-CoA (thiolase) → enter TCA cycle
In prolonged starvation (>2-3 weeks), plasma ketone bodies reach high levels and the brain switches from glucose to ketone bodies as its primary fuel - sparing glucose and thus preventing excessive muscle protein breakdown.
Diabetic Ketoacidosis (DKA)
In uncontrolled Type 1 diabetes, low insulin → massive lipolysis + excess ketogenesis → blood ketones up to 90 mg/dL (normal <3 mg/dL). Each ketone body (pKa ~4) loses H⁺ in blood → severe metabolic acidosis. Hallmark: fruity breath (acetone), Kussmaul breathing, hyperglycemia, dehydration.
5. Fatty Acid Synthesis (De Novo Lipogenesis)
Location: Cytosol of liver, lactating mammary glands, adipose
Building blocks: Acetyl-CoA (from glucose/amino acids)
Energy input: ATP + NADPH
Building blocks: Acetyl-CoA (from glucose/amino acids)
Energy input: ATP + NADPH
Step 1 - Getting Acetyl-CoA to Cytosol (Citrate Shuttle)
Mitochondrial acetyl-CoA + OAA → Citrate (citrate synthase) → exits mitochondria → cleaved in cytosol by ATP-citrate lyase → acetyl-CoA + OAA
This happens when ATP is high (TCA inhibited) → citrate accumulates → transported out as a "high-energy signal."
Step 2 - Rate-Limiting Step: Acetyl-CoA → Malonyl-CoA
Acetyl-CoA Carboxylase (ACC)
- Cofactor: Biotin (Vitamin B7)
- Reaction: Acetyl-CoA + CO₂ + ATP → Malonyl-CoA
- Allosteric activation: Citrate (signal of energy surplus)
- Allosteric inhibition: Palmitoyl-CoA (end-product feedback)
- Hormonal activation: Insulin (promotes dephosphorylation → active form)
- Hormonal inhibition: Glucagon, epinephrine (promote phosphorylation → inactive)
Step 3 - Fatty Acid Synthase (FAS) Complex
A multifunctional enzyme complex that repeats a 4-reaction cycle adding 2 carbons (from malonyl-CoA) per turn:
| Reaction | Enzyme Activity | Change |
|---|---|---|
| Condensation | KS (β-ketoacyl-ACP synthase) | Acyl + malonyl → β-ketobutyryl (release CO₂) |
| Reduction | KR (ketoreductase) | NADPH consumed |
| Dehydration | DH (dehydratase) | Remove H₂O |
| Reduction | ER (enoylreductase) | NADPH consumed |
After 7 cycles, the product is Palmitate (C16:0), released by thioesterase.
Net: Acetyl-CoA + 7 Malonyl-CoA + 14 NADPH → Palmitate + 7 CO₂ + 8 CoA + 14 NADP⁺ + 6 H₂O
NADPH sources for synthesis:
- Pentose phosphate pathway (major source)
- Malic enzyme (malate → pyruvate + NADPH)
6. Lipoprotein Metabolism - Transport in Blood
Lipids are insoluble in water and travel in blood as lipoprotein particles - spherical complexes with a hydrophobic core (TAG + cholesteryl esters) and a polar shell (phospholipids + free cholesterol + apolipoproteins).
Lipoprotein Classification
| Particle | Density | Major Core Lipid | Key Apo | Origin |
|---|---|---|---|---|
| Chylomicron | Lowest (<0.95) | TAG ~90% | Apo B-48 | Intestine |
| VLDL | Very low (0.95-1.006) | TAG ~60% | Apo B-100 | Liver |
| IDL | Intermediate (1.006-1.019) | TAG + CE | Apo B-100, E | Plasma (from VLDL) |
| LDL | Low (1.019-1.063) | CE ~45% | Apo B-100 | Plasma (from VLDL) |
| HDL | High (1.063-1.21) | Protein ~50% | Apo A-I | Liver + intestine |
Pathway A: Exogenous Pathway (Dietary Fat Transport)
Chylomicron metabolism:
- Intestinal cells absorb dietary FA + 2-monoglyceride → re-esterify to TAG → assembled into chylomicrons with Apo B-48 (unique to intestinal chylomicrons)
- Chylomicrons leave via lymphatics (thoracic duct → left subclavian vein)
- In plasma: receive Apo C-II and Apo E from circulating HDL
- Lipoprotein lipase (LPL) on capillary walls - activated by Apo C-II - hydrolyzes TAG → FA + glycerol
- FA → muscle (energy) or adipose (storage)
- Glycerol → liver
- As TAG is removed, chylomicron shrinks → chylomicron remnant (retains Apo B-48 + Apo E, loses Apo C)
- Remnants taken up by liver via Apo E receptor → receptor-mediated endocytosis → lysosomal degradation
Pathway B: Endogenous Pathway (Liver-Derived Fat Transport)
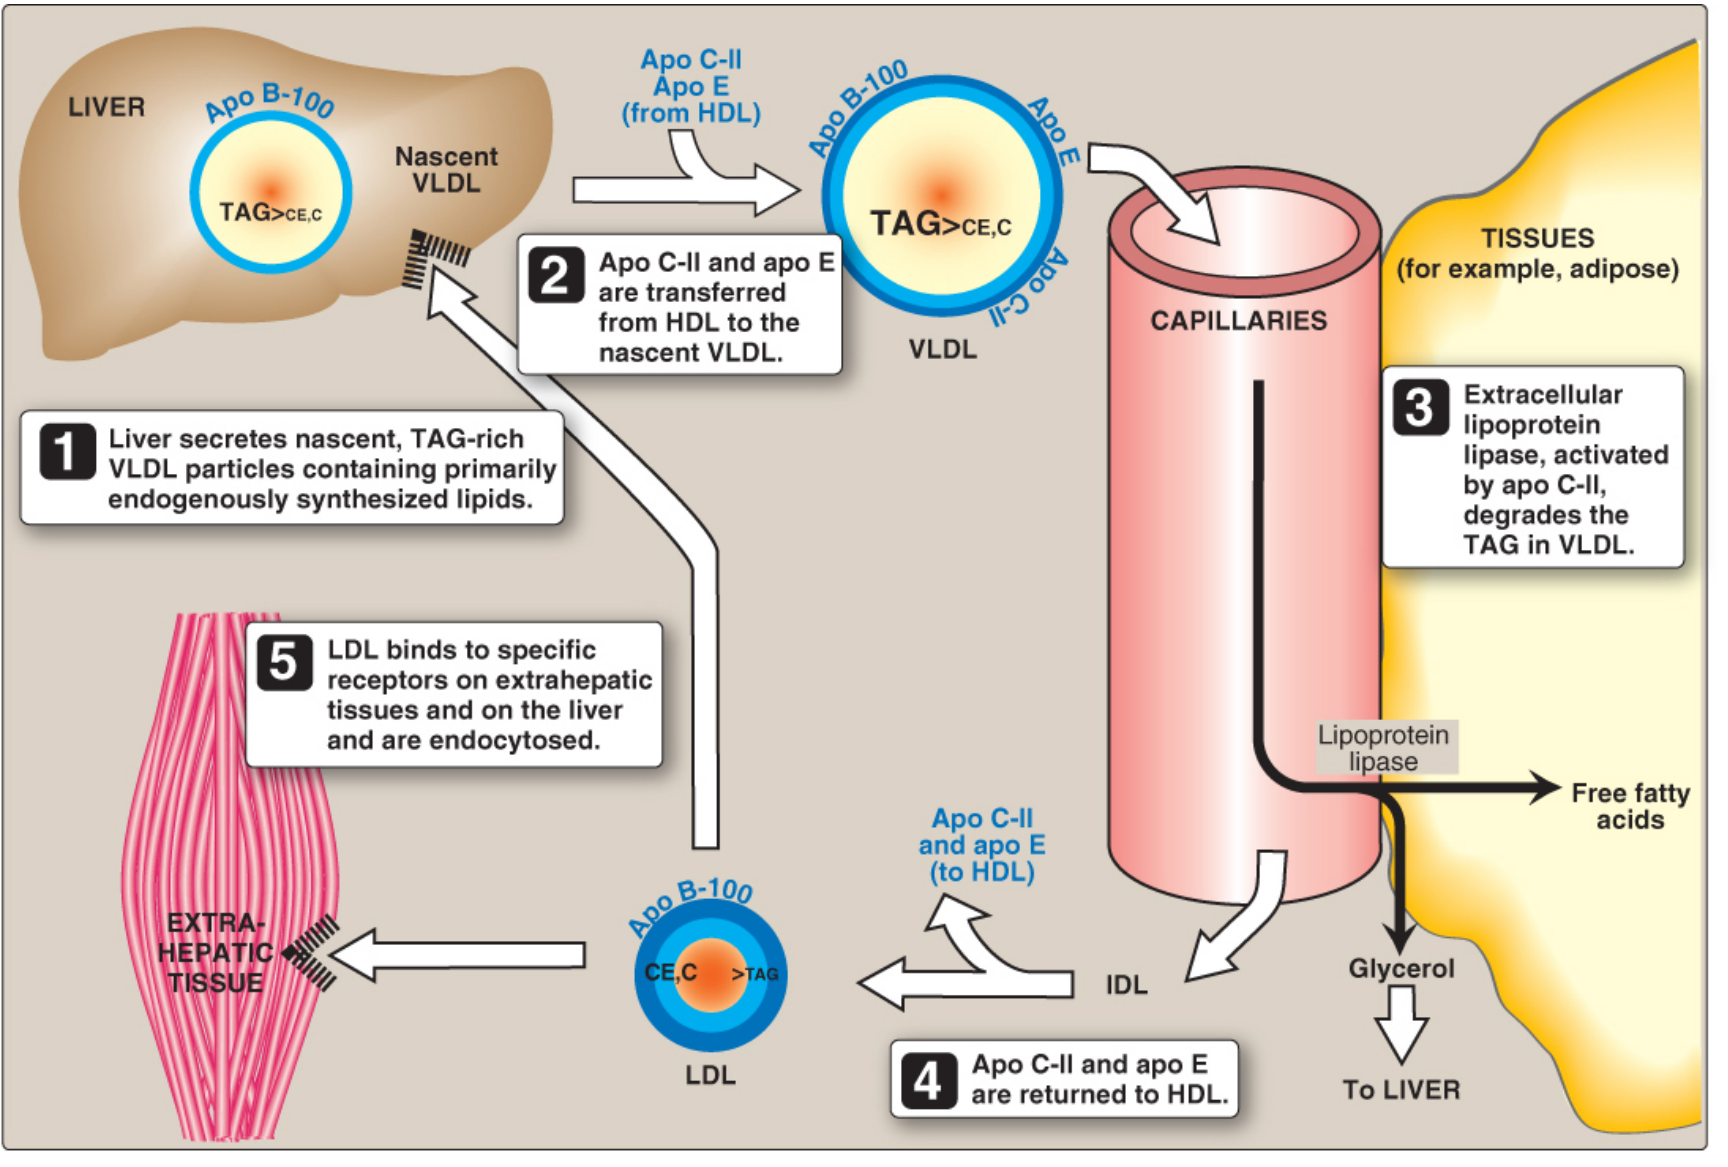
Figure 18.18 - VLDL and LDL metabolism (Lippincott's Biochemistry, 8th ed.)
VLDL metabolism (steps 1-5 shown above):
- Liver synthesizes nascent VLDL containing Apo B-100 + endogenous TAG
- VLDL gains Apo C-II and Apo E from HDL in plasma
- LPL (activated by Apo C-II) degrades VLDL-TAG in capillaries → FA released to tissues
- VLDL shrinks → IDL (intermediate density lipoprotein); Apo C-II and Apo E returned to HDL
- IDL further processed by hepatic lipase → LDL (retains Apo B-100 only)
LDL receptor pathway:
- LDL binds LDL receptor (recognizes Apo B-100) on peripheral cells or liver
- Receptor-mediated endocytosis via clathrin-coated pits
- Vesicle → endosome (pH drops) → LDL separates from receptor
- Receptor recycled; LDL → lysosome → hydrolysis → free cholesterol, FA, amino acids released
- Cholesterol homeostasis effects on the cell:
- Inhibits HMG-CoA reductase (reduces de novo synthesis)
- Downregulates LDL receptor expression
- Activates ACAT (stores excess cholesterol as cholesteryl esters)
Familial Hypercholesterolemia (FH): Defect in LDL receptor → LDL-C very high → premature atherosclerosis. Also caused by Apo B-100 mutations or gain-of-function PCSK9 mutations (PCSK9 targets LDL receptor for degradation).
Pathway C: Reverse Cholesterol Transport (RCT) - HDL Pathway
HDL removes cholesterol from peripheral tissues and returns it to the liver - the basis for HDL being "good cholesterol."
Steps:
- Liver/intestine secrete nascent HDL (disc-shaped; Apo A-I + phospholipids)
- Peripheral cells export cholesterol to HDL via ABCA1 transporter
- LCAT (lecithin:cholesterol acyltransferase), activated by Apo A-I, esterifies cholesterol → cholesteryl ester moves to HDL core → nascent disc → HDL3 → HDL2 (spherical, CE-rich)
- Some cholesteryl esters transferred from HDL to VLDL/LDL by CETP (cholesteryl ester transfer protein) in exchange for TAG
- HDL2 delivers cholesteryl esters to the liver via SR-B1 receptor (selective lipid uptake, particle not endocytosed)
- Lipid-depleted HDL3 is regenerated and recirculates
Tangier disease: Deficiency of ABCA1 → virtual absence of HDL → cholesterol accumulates in macrophages → orange tonsils, splenomegaly, neuropathy
7. Regulation of Lipid Metabolism - Hormonal Control
| Hormone | State | Effect on FA Oxidation | Effect on FA Synthesis | Effect on Lipolysis |
|---|---|---|---|---|
| Insulin | Fed | ↓ (inhibits CPT-I via malonyl-CoA; inhibits HSL) | ↑ (activates ACC) | ↓ |
| Glucagon | Fasting | ↑ | ↓ (inactivates ACC) | ↑ |
| Epinephrine | Stress/exercise | ↑ | ↓ | ↑ (activates HSL) |
| Cortisol | Stress | ↑ | Variable | ↑ |
Key Regulatory Molecules
| Molecule | Role |
|---|---|
| Malonyl-CoA | Inhibits CPT-I → links synthesis to oxidation (prevents futile cycle) |
| AMPK | Activated by AMP (low energy) → phosphorylates/inactivates ACC → ↓ malonyl-CoA → ↑ FA oxidation |
| SREBP-1c | Transcription factor activated by insulin → upregulates FA synthesis genes (FAS, ACC) |
| SREBP-2 | Activated when cholesterol is low → upregulates HMG-CoA reductase + LDL receptor |
| PPAR-alpha | Nuclear receptor activated by FA → upregulates beta-oxidation enzymes (fasting) |
8. Phospholipid and Sphingolipid Metabolism
Phospholipid Synthesis
- CDP-choline pathway (Kennedy pathway): Choline → phosphocholine → CDP-choline + DAG → phosphatidylcholine (PC). This is the major route in liver.
- Phospholipid remodeling: Phospholipase A2 removes FA at sn-2; reacylation with a new FA
Sphingomyelin Synthesis
- Ceramide (sphingosine + FA via amide bond) + CDP-choline → sphingomyelin + DAG
Arachidonic Acid Cascade (from membrane phospholipids)
- Phospholipase A2 → releases arachidonic acid from membrane PC
- COX (cyclooxygenase) → prostaglandins, thromboxanes
- Lipoxygenase → leukotrienes
- Target of NSAIDs (inhibit COX), steroids (inhibit phospholipase A2)
9. Clinical Correlations
| Condition | Biochemical Defect | Key Features |
|---|---|---|
| Familial Hypercholesterolemia | LDL receptor or Apo B-100 mutation | Very high LDL, xanthomas, early MI |
| Familial Chylomicronemia (Type I) | LPL or Apo C-II deficiency | Massive TG elevation (>1000 mg/dL), pancreatitis, eruptive xanthomas |
| Diabetic Ketoacidosis | Insulin deficiency → uncontrolled lipolysis + ketogenesis | High ketones, acidosis, fruity breath |
| Abetalipoproteinemia | MTP defect → no chylomicrons or VLDL | Fat malabsorption, fat-soluble vitamin deficiency, acanthocytosis |
| Tangier Disease | ABCA1 defect | No HDL, orange tonsils, neuropathy |
| McArdle disease | Muscle phosphorylase deficiency | No oxidative metabolism of glycogen; relies on FA |
| MCAD deficiency | Medium-chain acyl-CoA dehydrogenase deficiency | Cannot oxidize medium-chain FA; hypoglycemia, hypoketosis during fasting |
| Carnitine deficiency | Carnitine transporter or biosynthesis defect | Cannot transport LCFA into mitochondria; muscle weakness, hypoketotic hypoglycemia |
| Zellweger syndrome | No peroxisomes | Cannot oxidize very-long-chain FA; accumulate in brain |
| Statins | Inhibit HMG-CoA reductase | ↓ cholesterol synthesis, ↑ LDL receptor expression → lower plasma LDL |
10. Integrated Overview - Fed vs. Fasted State
FED STATE (insulin high)
- Glucose → Acetyl-CoA → FA synthesis (ACC active, FAS active)
- Malonyl-CoA high → CPT-I inhibited → beta-oxidation OFF
- LPL active in adipose → FA uptake for storage
- Liver: glycogen + TAG synthesis
FASTED STATE (glucagon/epinephrine high)
- ACC phosphorylated → inactive → malonyl-CoA low
- CPT-I uninhibited → beta-oxidation ON
- HSL active → adipose lipolysis → FFA to blood → liver + muscle
- Liver: beta-oxidation + ketogenesis
- Muscle: primarily burns FA
- Brain: initially glucose, then ketone bodies (prolonged fasting)
Sources: Biochemistry, 8th ed., Lippincott Illustrated Reviews (primary source throughout - Chapters 15, 16, 18, 24); Tietz Textbook of Laboratory Medicine, 7th Edition
so ketogenesis occur after beta oxidation
Yes, exactly. Ketogenesis occurs as a consequence of beta-oxidation - it is essentially what happens to the acetyl-CoA produced by beta-oxidation when it cannot enter the TCA cycle.
Here is the precise relationship:
Beta-Oxidation → Ketogenesis: The Sequential Link
Fatty acids (from adipose lipolysis)
↓
[Carnitine Shuttle → Mitochondrial matrix]
↓
BETA-OXIDATION
(repeated cycles)
↓
Acetyl-CoA ←── this is the product
↓
NORMALLY → enters TCA cycle (+ oxaloacetate → citrate)
↓
BUT in fasting/starvation/T1DM:
OAA is depleted (diverted to gluconeogenesis)
↓
Acetyl-CoA has nowhere to go
↓
KETOGENESIS
(liver mitochondria only)
Why OAA Gets Depleted - The Key Trigger
Beta-oxidation itself causes OAA depletion through two mechanisms:
-
NADH accumulates from beta-oxidation → the high NADH/NAD⁺ ratio shifts OAA to malate (malate dehydrogenase runs in reverse) → OAA effectively disappears from the mitochondrial pool
-
Glucagon signals the liver (in fasting) to use OAA for gluconeogenesis (via phosphoenolpyruvate carboxykinase/PEPCK) → OAA is consumed for glucose production instead of TCA
So the more beta-oxidation runs, the more it destroys its own TCA entry point, and the more acetyl-CoA is shunted into ketogenesis.
The Sequential Flow in Detail
| Stage | Process | Location | Product |
|---|---|---|---|
| 1 | Lipolysis | Adipose cytosol | Free fatty acids |
| 2 | Activation | Outer mitochondrial membrane | Fatty acyl-CoA |
| 3 | Carnitine shuttle | Inner mitochondrial membrane | Acyl-CoA in matrix |
| 4 | Beta-oxidation | Mitochondrial matrix | Acetyl-CoA + NADH + FADH₂ |
| 5 | Ketogenesis | Mitochondrial matrix (liver) | Acetoacetate, 3-hydroxybutyrate |
| 6 | Export | Blood | Ketone bodies to periphery |
| 7 | Ketolysis | Muscle, brain, kidney | Acetyl-CoA → TCA → ATP |
Important Nuances
Ketogenesis is liver-specific. Even though beta-oxidation occurs in ALL tissues with mitochondria (muscle, heart, kidney), only the liver has sufficient HMG-CoA synthase (mitochondrial isoform) - the rate-limiting enzyme of ketogenesis - to produce ketone bodies in significant amounts.
So in muscle:
- Beta-oxidation runs → acetyl-CoA → directly enters TCA cycle → ATP production (muscle has abundant OAA)
In liver during fasting:
- Beta-oxidation runs → acetyl-CoA → OAA gone → ketogenesis
The liver is essentially a ketone factory - it makes ketone bodies from its own beta-oxidation products and exports them as fuel for the brain and muscles.
Simple Summary
Beta-oxidation produces acetyl-CoA. Ketogenesis consumes that acetyl-CoA when the TCA cycle cannot. They are sequential, not competing pathways - ketogenesis is the overflow valve for beta-oxidation in the fasting liver.
explain alcohol metabolism
Alcohol (ethanol) is metabolized primarily in the liver by two main pathways: alcohol dehydrogenase (ADH) and the microsomal ethanol oxidizing system (MEOS). Both produce acetaldehyde, which is then oxidized to acetate by aldehyde dehydrogenase. The key consequence is massive NADH generation, which disrupts virtually every aspect of liver metabolism.
Searching sources...
Finding Sources
Finding Sources
Finding Sources
Finding Sources
Excellent - found a dedicated biochemistry textbook section. Let me read it in full.
Reading File
Reading File
Finding Sources
Reading File
Reading File
Reading File
Loading Image
Reading File
Loading Image
Reading File
Loading Image
I now have everything needed - including excellent diagrams. Let me compile the full answer.
Alcohol (Ethanol) Metabolism - Complete Biochemistry Guide
1. Absorption and Distribution
Ethanol (CH₃CH₂OH) is a small, amphipathic molecule - both lipid and water soluble. It is rapidly absorbed from the GI tract by passive diffusion.
Distribution of ingested alcohol:
- 0-5% metabolized in gastric mucosal cells (tongue, esophagus, stomach)
- 85-98% metabolized in the liver (the primary site)
- 2-10% excreted unchanged via lungs and kidneys (the basis of breathalyzer testing)
Ethanol is cleared from blood at approximately 15 mg/dL/hr (about 0.5 oz/hr) - a fixed, zero-order rate at typical drinking levels because ADH is saturated.
2. The Two Major Pathways of Ethanol Oxidation
Both pathways convert ethanol → acetaldehyde as the first step.
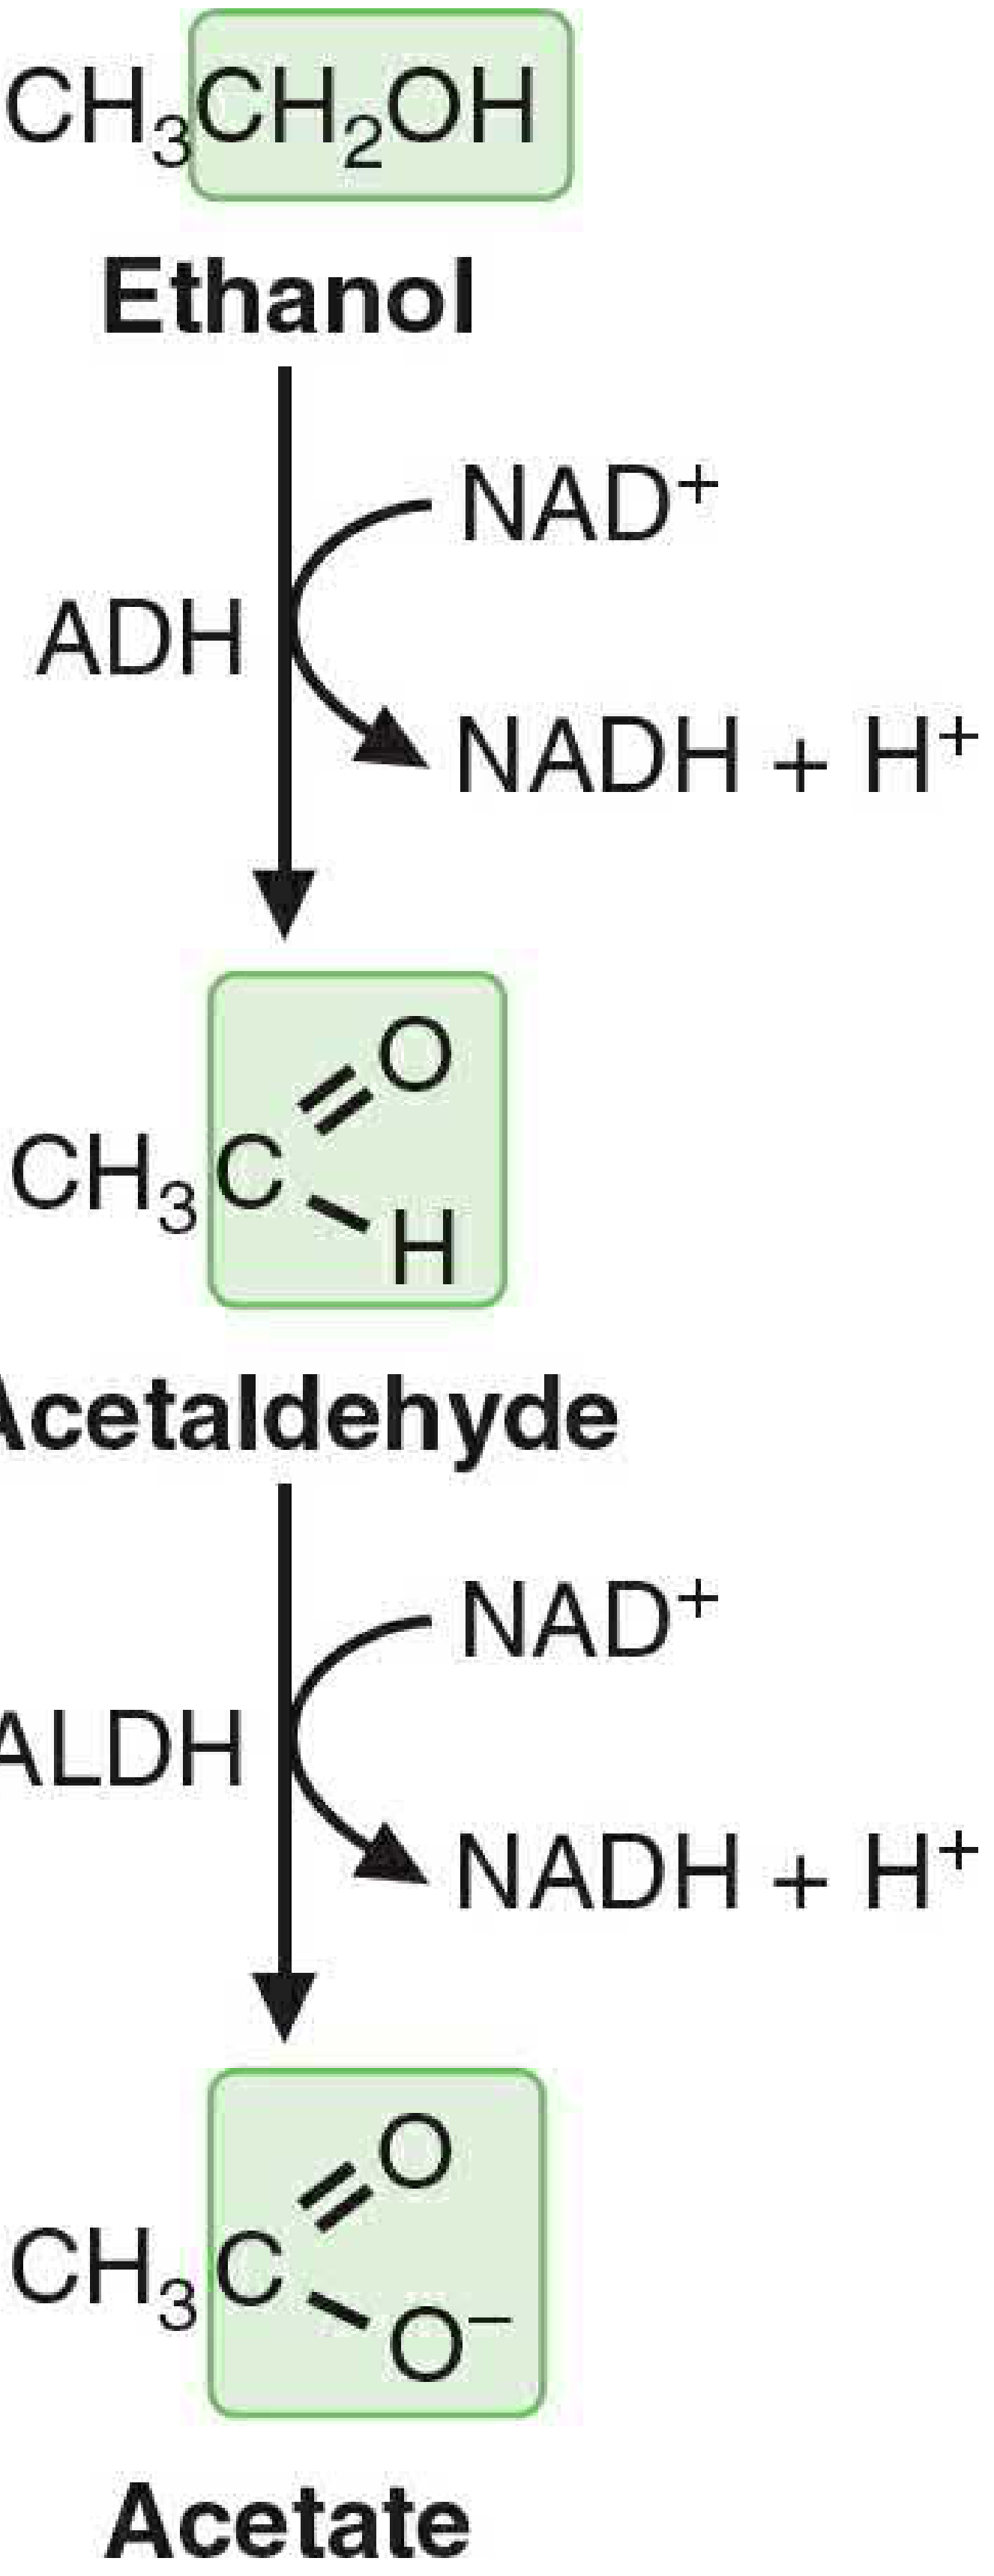
Figure 33.2 - The pathway of ethanol metabolism (Basic Medical Biochemistry, 6th ed.)
Pathway 1: Alcohol Dehydrogenase (ADH) - Major Route (~80-90%)
Step 1 - Cytosol:
Ethanol + NAD⁺ → Acetaldehyde + NADH + H⁺ Enzyme: Alcohol dehydrogenase (ADH)
Step 2 - Mitochondria (mainly):
Acetaldehyde + NAD⁺ → Acetate + NADH + H⁺ Enzyme: Acetaldehyde dehydrogenase (ALDH) - low Km mitochondrial isoform (ALDH2)
- ADH is a cytosolic dimer; exists as a family of isoenzymes (ADH1 family has low Km for ethanol)
- ALDH2 has very low Km for acetaldehyde → rapidly clears the toxic acetaldehyde
- ~90% of generated acetaldehyde is metabolized to acetate in the liver
Pathway 2: Microsomal Ethanol-Oxidizing System (MEOS) - Minor Route (~10-20%)
Ethanol + NADPH + H⁺ + O₂ → Acetaldehyde + NADP⁺ + 2H₂O Principal enzyme: CYP2E1 (cytochrome P450 2E1) in the endoplasmic reticulum
Key features of MEOS/CYP2E1:
- High Km for ethanol (~11 mM vs. 0.013-4 mM for ADH) → only becomes significant at high ethanol concentrations
- Inducible by chronic ethanol consumption (5-10 fold increase in CYP2E1 levels)
- Therefore chronic heavy drinkers metabolize proportionately more ethanol through MEOS
- Consumes NADPH (an energy cost) rather than producing NADH
- Generates reactive oxygen species (free radicals) - a major source of liver damage
The Overall Pathway and What Happens to Acetate
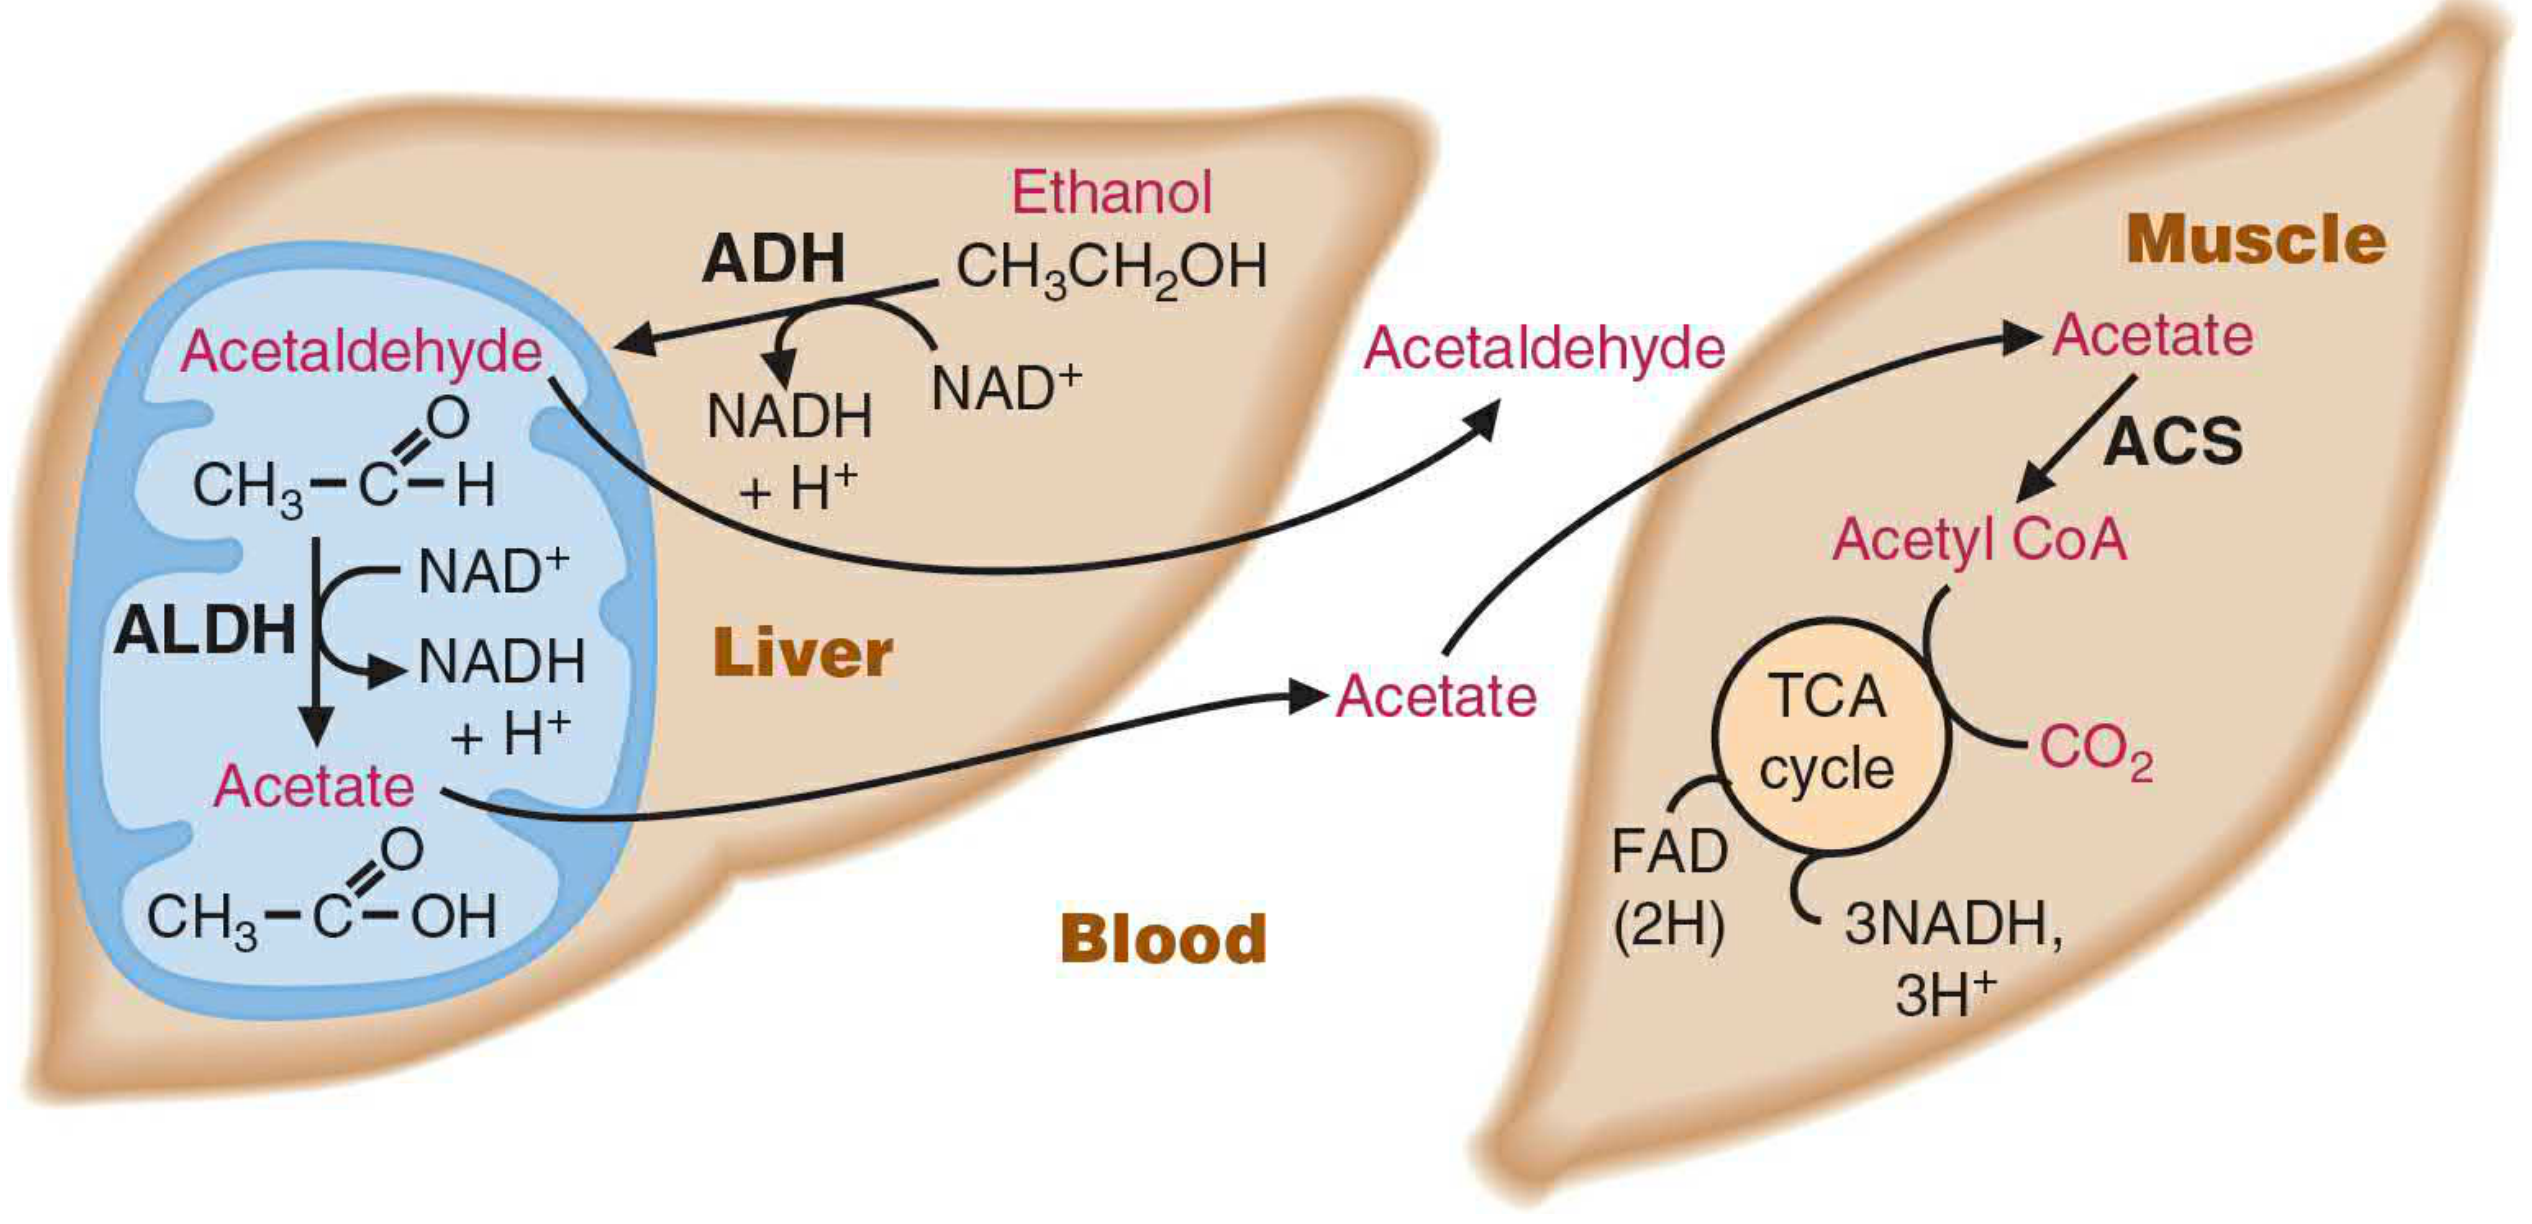
Figure 33.1 - Ethanol metabolism and acetate utilization by muscle (Basic Medical Biochemistry, 6th ed.)
Acetate produced in the liver:
- Has no toxic effects
- Most enters the blood and is taken up by skeletal muscle and other extrahepatic tissues
- Activated to acetyl-CoA by acetyl-CoA synthetase (ACS): Acetate + CoA + ATP → Acetyl-CoA + AMP + PPi
- Acetyl-CoA enters the TCA cycle for energy production
- Only a small amount is metabolized further in the liver itself
3. The Central Problem: NADH Accumulation and the High NADH/NAD⁺ Ratio
This is the single most important concept in alcohol metabolism. Each mole of ethanol oxidized via the ADH/ALDH pathway generates 2 moles of NADH:
- 1 NADH from ADH (cytosol)
- 1 NADH from ALDH (mitochondria)
The NADH/NAD⁺ ratio in the liver rises dramatically. This has cascading metabolic consequences:
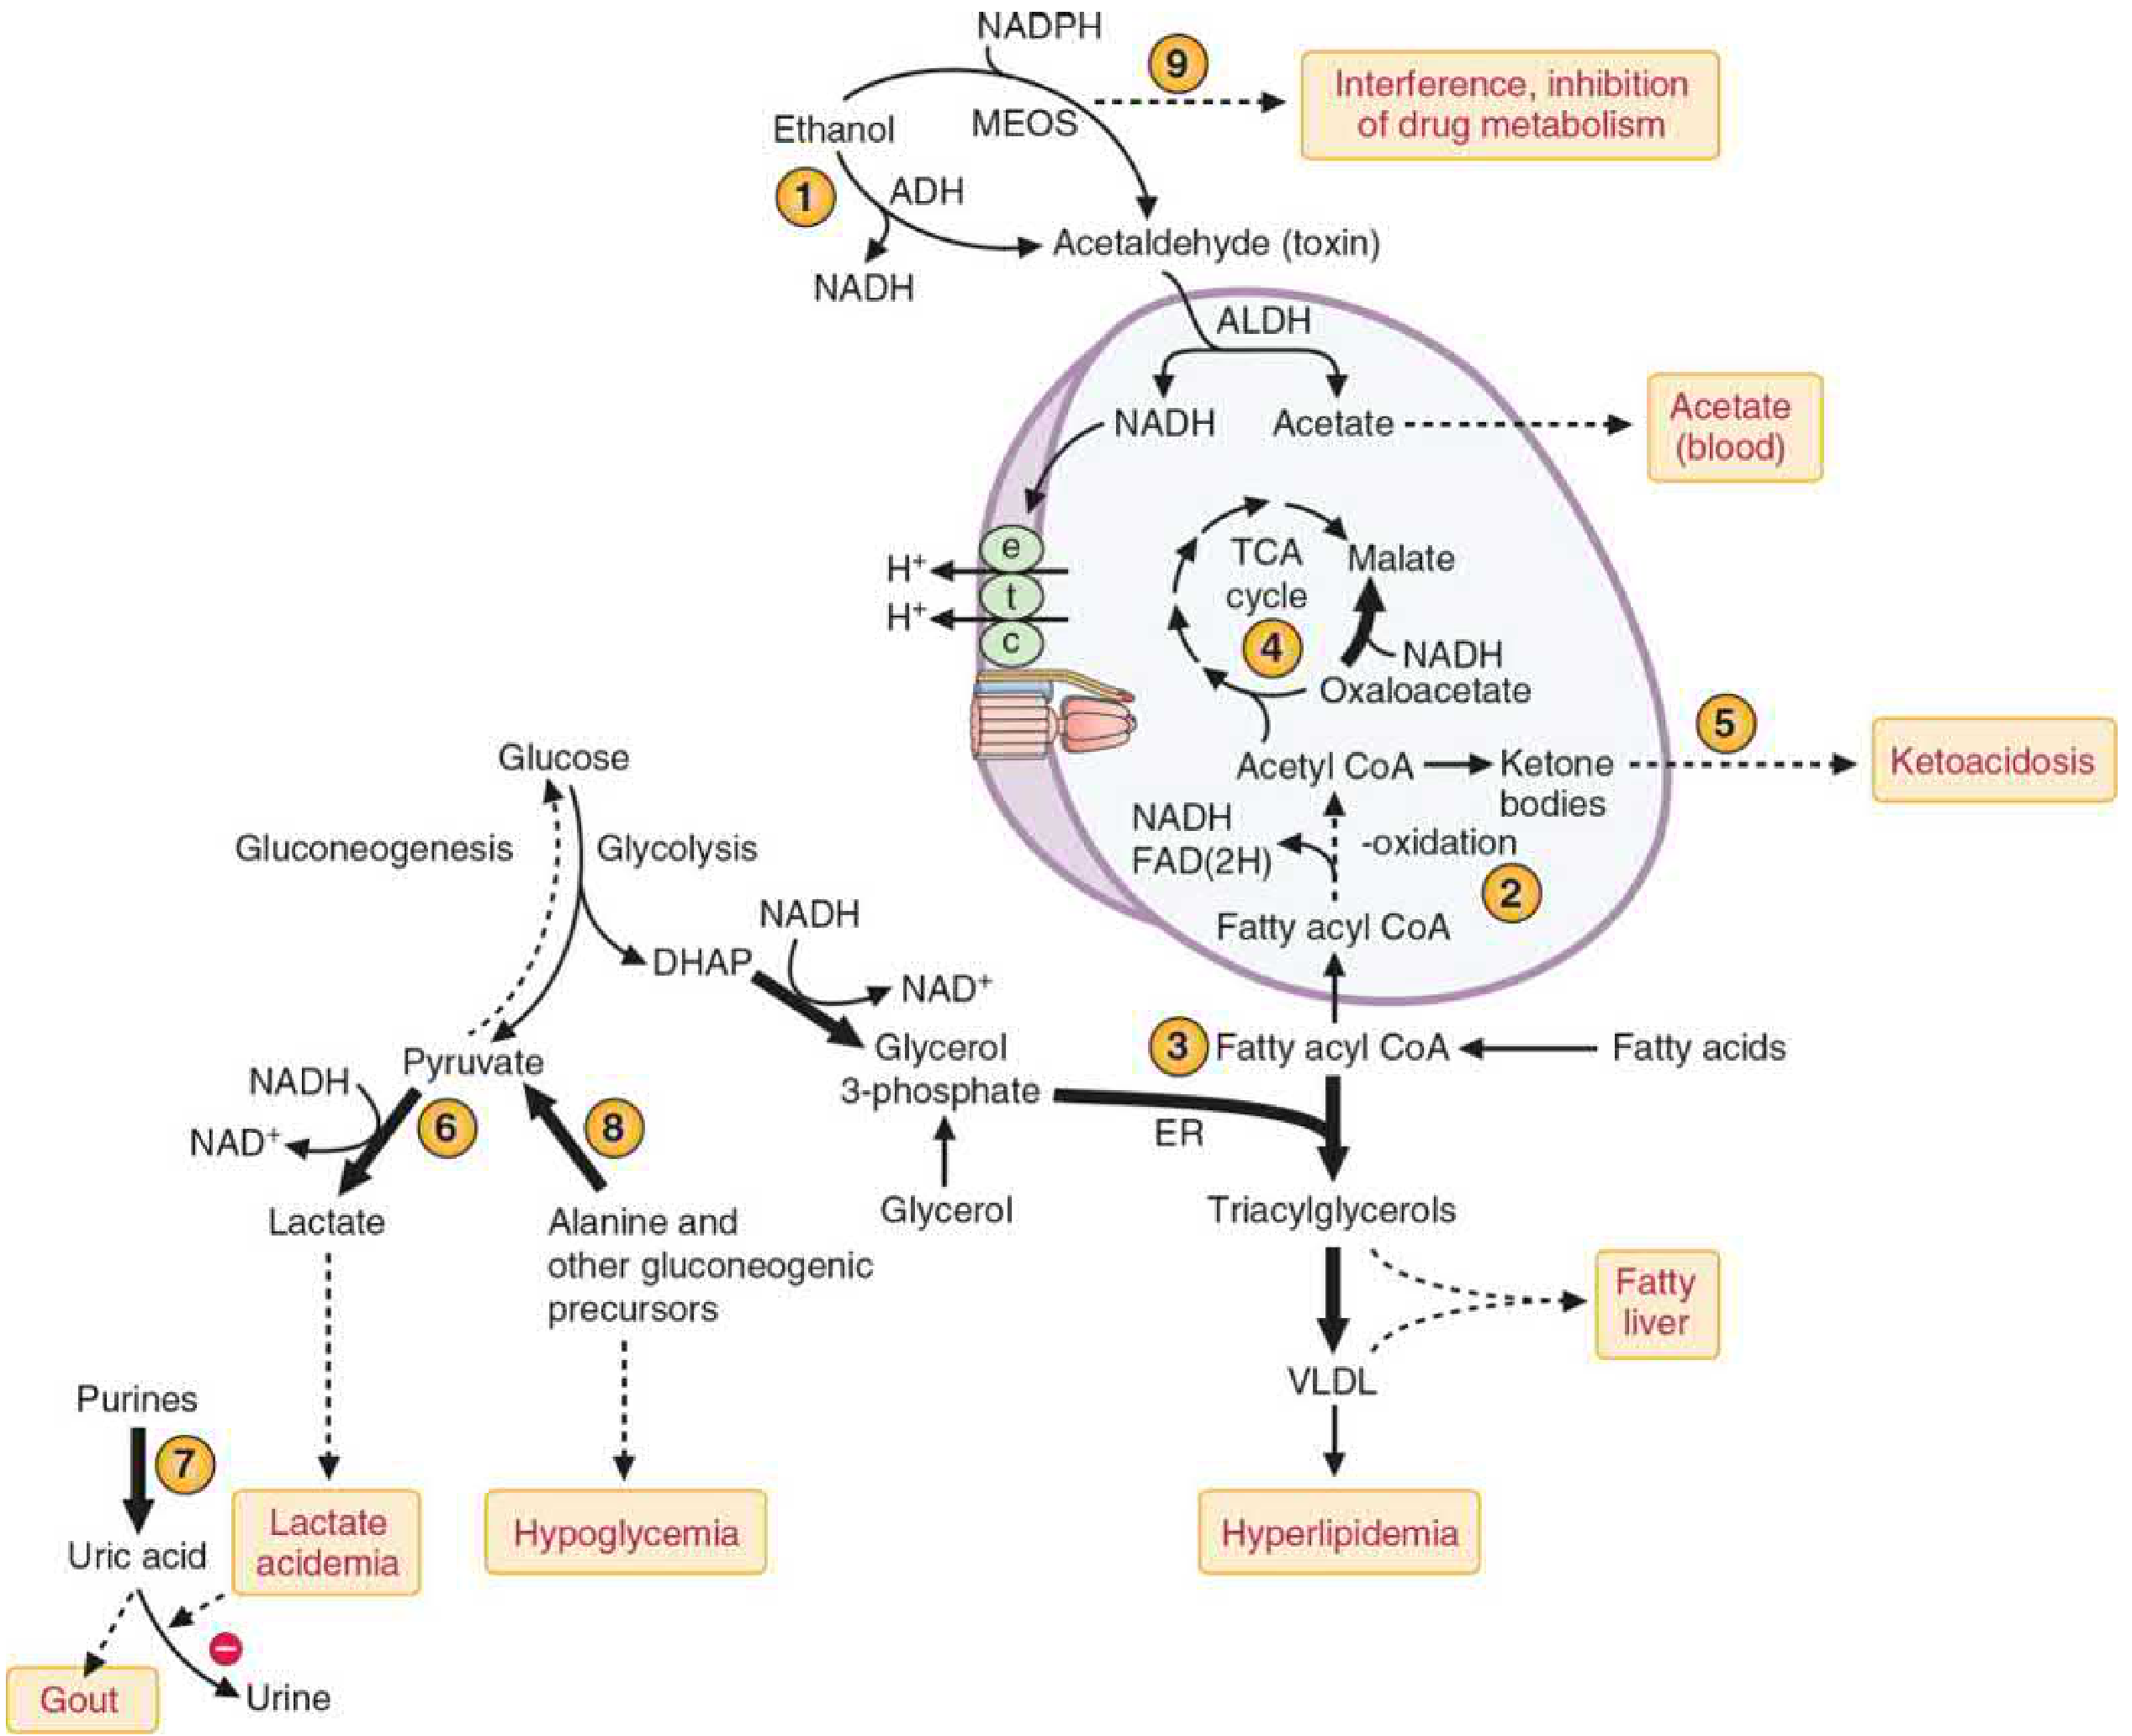
Figure 33.6 - Acute effects of ethanol metabolism on liver metabolism. Numbers correspond to consequences described below (Basic Medical Biochemistry, 6th ed.)
4. Metabolic Consequences of the High NADH/NAD⁺ Ratio
(1) Inhibition of Beta-Oxidation → Fatty Liver
- High NADH inhibits beta-oxidation (the dehydrogenation steps of beta-oxidation require NAD⁺ and FAD, both of which are reduced)
- Fatty acids accumulate in the liver
- Combined with increased glycerol-3-phosphate availability (DHAP → glycerol-3-P favored by high NADH), TAG synthesis increases
- TAG accumulates → hepatic steatosis (fatty liver) - the earliest and most common liver change in alcohol use
- Excess TAG also secreted as VLDL → hypertriglyceridemia
(2) Inhibition of TCA Cycle → Ketogenesis
- High NADH shifts OAA → malate (malate dehydrogenase runs in reverse)
- OAA unavailable to accept acetyl-CoA → TCA cycle blocked
- Acetyl-CoA accumulates → ketogenesis → alcoholic ketoacidosis
- Seen especially in people who drink heavily and eat poorly (combined starvation + alcohol)
(3) Inhibition of Gluconeogenesis → Hypoglycemia
- Gluconeogenesis from lactate requires NAD⁺ (lactate → pyruvate by LDH) - but NAD⁺ is depleted
- High NADH also diverts OAA away from gluconeogenesis (OAA → malate)
- Both alanine and other gluconeogenic amino acids cannot be used efficiently
- Result: Hypoglycemia - particularly dangerous in fasting individuals who drink (e.g., a diabetic patient who skips meals and drinks alcohol)
(4) Lactic Acidosis
- High NADH pushes pyruvate → lactate (by lactate dehydrogenase)
- Lactate accumulates → lactic acidemia / lactic acidosis
- Combined with ketoacidosis, a severe anion-gap metabolic acidosis can result
(5) Hyperuricemia and Gout
- Lactate competes with uric acid for renal tubular secretion
- Uric acid excretion decreases → hyperuricemia → gout precipitation
- Explains why alcohol is a common trigger for gout attacks
(6) Impaired Drug Metabolism
- CYP2E1 induction by chronic alcohol increases metabolism of many drugs (tolerance - need more drug for same effect)
- But when alcohol is present acutely, it competes with and inhibits CYP2E1-mediated drug metabolism
- Example: acetaminophen (paracetamol) - normally a safe drug, but in chronic alcohol users, induced CYP2E1 generates much more of the toxic NAPQI metabolite → risk of hepatotoxicity at normal doses
5. Toxic Products of Ethanol Metabolism
Acetaldehyde Toxicity
Acetaldehyde (CH₃CHO) is the primary toxic metabolite of ethanol. It is highly reactive and causes damage by:
- Protein adduct formation - covalently binds to amino groups on proteins, altering their function
- DNA adducts - mutagenic; contributes to hepatocarcinogenesis
- Mitochondrial damage - disrupts electron transport chain; leads to impaired beta-oxidation and oxidative phosphorylation
- Interferes with retinoic acid synthesis (ALDH competes with retinaldehyde oxidation) → contributes to fetal alcohol syndrome
Free Radical Formation (Oxidative Stress)
- CYP2E1 (MEOS) generates the hydroxyethyl radical (CH₃CH•OH) and other ROS
- Increased with CYP2E1 induction (chronic drinkers)
- Peroxidizes membrane phospholipids → mitochondrial membrane damage, cell necrosis
- Induces other P450s → activates hepatocarcinogens
6. Energy Yield of Ethanol
Ethanol provides ~7 kcal/g (between fat at 9 kcal/g and carbohydrate/protein at 4 kcal/g).
| Pathway | ATP Yield per Ethanol |
|---|---|
| ADH + ALDH route (via NADH → ETC) | ~13 ATP maximum |
| MEOS route (CYP2E1) | ~8 ATP (less, because NADPH is consumed, not produced) |
However, caloric benefit is limited in chronic drinkers because:
- Induction of MEOS shifts metabolism to the less efficient pathway
- Alcohol calories are "nutritionally empty" - no vitamins, essential amino acids, or micronutrients
- Chronic intake damages the liver, impairing metabolic utilization of all nutrients
7. Pharmacogenomics - Individual Variations
The rate and consequences of alcohol metabolism vary greatly between individuals due to genetic polymorphisms:
| Gene | Variant | Effect |
|---|---|---|
| ADH1B (fast ADH) | Common in East Asians | Rapid ethanol → acetaldehyde; high acetaldehyde levels |
| ALDH2*2 (inactive ALDH) | ~50% of East Asians | Cannot clear acetaldehyde → severe flushing, nausea, tachycardia ("Asian flush") - protective against alcohol use disorder |
| CYP2E1 variants | Up to 20-fold variation | High inducibility → higher free radical generation → greater hepatotoxicity risk |
This is the basis for disulfiram (Antabuse) therapy: it inhibits ALDH → acetaldehyde accumulates → aversive flushing reaction → deters drinking
8. Spectrum of Alcohol-Induced Liver Disease
These three stages can occur alone or in combination:
Acute ethanol → HIGH NADH/NAD⁺ ratio
↓
[Reversible]
Fatty Liver (Hepatic Steatosis)
- Accumulation of TAG in hepatocytes
- Asymptomatic; enlarged liver
- Fully reversible with abstinence
↓ (continued drinking + acetaldehyde + ROS)
[Potentially reversible]
Alcoholic Hepatitis
- Inflammation and hepatocyte necrosis
- Elevated AST, ALT (AST:ALT ratio >2 is characteristic of alcohol)
- Fever, jaundice, tender hepatomegaly
↓ (irreversible)
Cirrhosis
- Fibrosis and scarring
- Loss of liver architecture and blood flow
- Consequences: portal hypertension, ascites, varices,
hepatic encephalopathy (↑ ammonia), coagulopathy,
jaundice (↑ bilirubin), hypoalbuminemia → edema
9. Summary - The Big Picture
ETHANOL (CH₃CH₂OH)
↓
[Liver - 2 routes]
↓
ADH (80-90%) MEOS/CYP2E1 (10-20%)
NAD⁺ → NADH NADPH + O₂ consumed
ROS generated (liver damage)
↓
ACETALDEHYDE ←── TOXIC: adducts, DNA damage, mitochondrial injury
↓
ALDH (mitochondria)
NAD⁺ → NADH
↓
ACETATE → blood → muscle → Acetyl-CoA → TCA → CO₂ + ATP
CONSEQUENCE OF NADH EXCESS:
→ Beta-oxidation OFF → Fatty liver
→ TCA cycle OFF → Ketogenesis → Ketoacidosis
→ Gluconeogenesis OFF → Hypoglycemia
→ Pyruvate → Lactate → Lactic acidosis
→ Urate excretion blocked → Gout
→ Drug interactions via CYP2E1
Sources: Basic Medical Biochemistry: A Clinical Approach, 6th ed. (Chapter 33, primary source); supplemented by Goodman & Gilman's The Pharmacological Basis of Therapeutics
more on meos
The MEOS (Microsomal Ethanol-Oxidizing System) is the cytochrome P450-based alternative pathway for ethanol oxidation, centered on CYP2E1. It becomes increasingly important at high ethanol concentrations and after chronic drinking due to enzyme induction.
Searching sources...
Finding Sources
Finding Sources
Reading File
Reading File
Reading File
Finding Sources
Reading File
Finding Sources
Loading Image
Finding Sources
Reading File
Reading File
I now have comprehensive, textbook-sourced content on MEOS. Here is the detailed explanation:
MEOS (Microsomal Ethanol-Oxidizing System) - In Depth
1. What is MEOS?
MEOS is the second major pathway for ethanol oxidation in the liver. It is located in the smooth endoplasmic reticulum (SER) of hepatocytes. The name "microsomal" comes from the fact that when liver cells are disrupted and centrifuged, the ER fragments into small vesicles called microsomes - which is where these enzymes were originally isolated by biochemists.
MEOS is not a single enzyme but the combined ethanol-oxidizing activity of all hepatic cytochrome P450 (CYP) enzymes, of which CYP2E1 has the highest activity toward ethanol. Other P450s also contributing include CYP1A2 and CYP3A4.
2. The MEOS Reaction
Ethanol + NADPH + H⁺ + O₂ → Acetaldehyde + NADP⁺ + 2H₂O
Compare this to ADH:
| Feature | ADH Pathway | MEOS (CYP2E1) |
|---|---|---|
| Location | Cytosol | Smooth ER (microsomes) |
| Coenzyme used | NAD⁺ (reduced to NADH) | NADPH (oxidized to NADP⁺) |
| Oxygen used? | No | Yes (O₂ consumed) |
| Product | Acetaldehyde + NADH | Acetaldehyde + NADP⁺ + H₂O |
| Km for ethanol | Very low: 0.013-4 mM | High: ~11 mM (51 mg/dL) |
| Contribution (moderate drinker) | ~80-90% | ~10-20% |
| Contribution (heavy/chronic drinker) | Less (relatively) | Much more (enzyme induced) |
| Free radicals generated? | Minimal | Yes - significant |
| Energy yield | +NADH (energy gain) | -NADPH (energy cost) |
3. Structure of the CYP2E1 Enzyme System
The MEOS has two protein components embedded in the ER membrane:
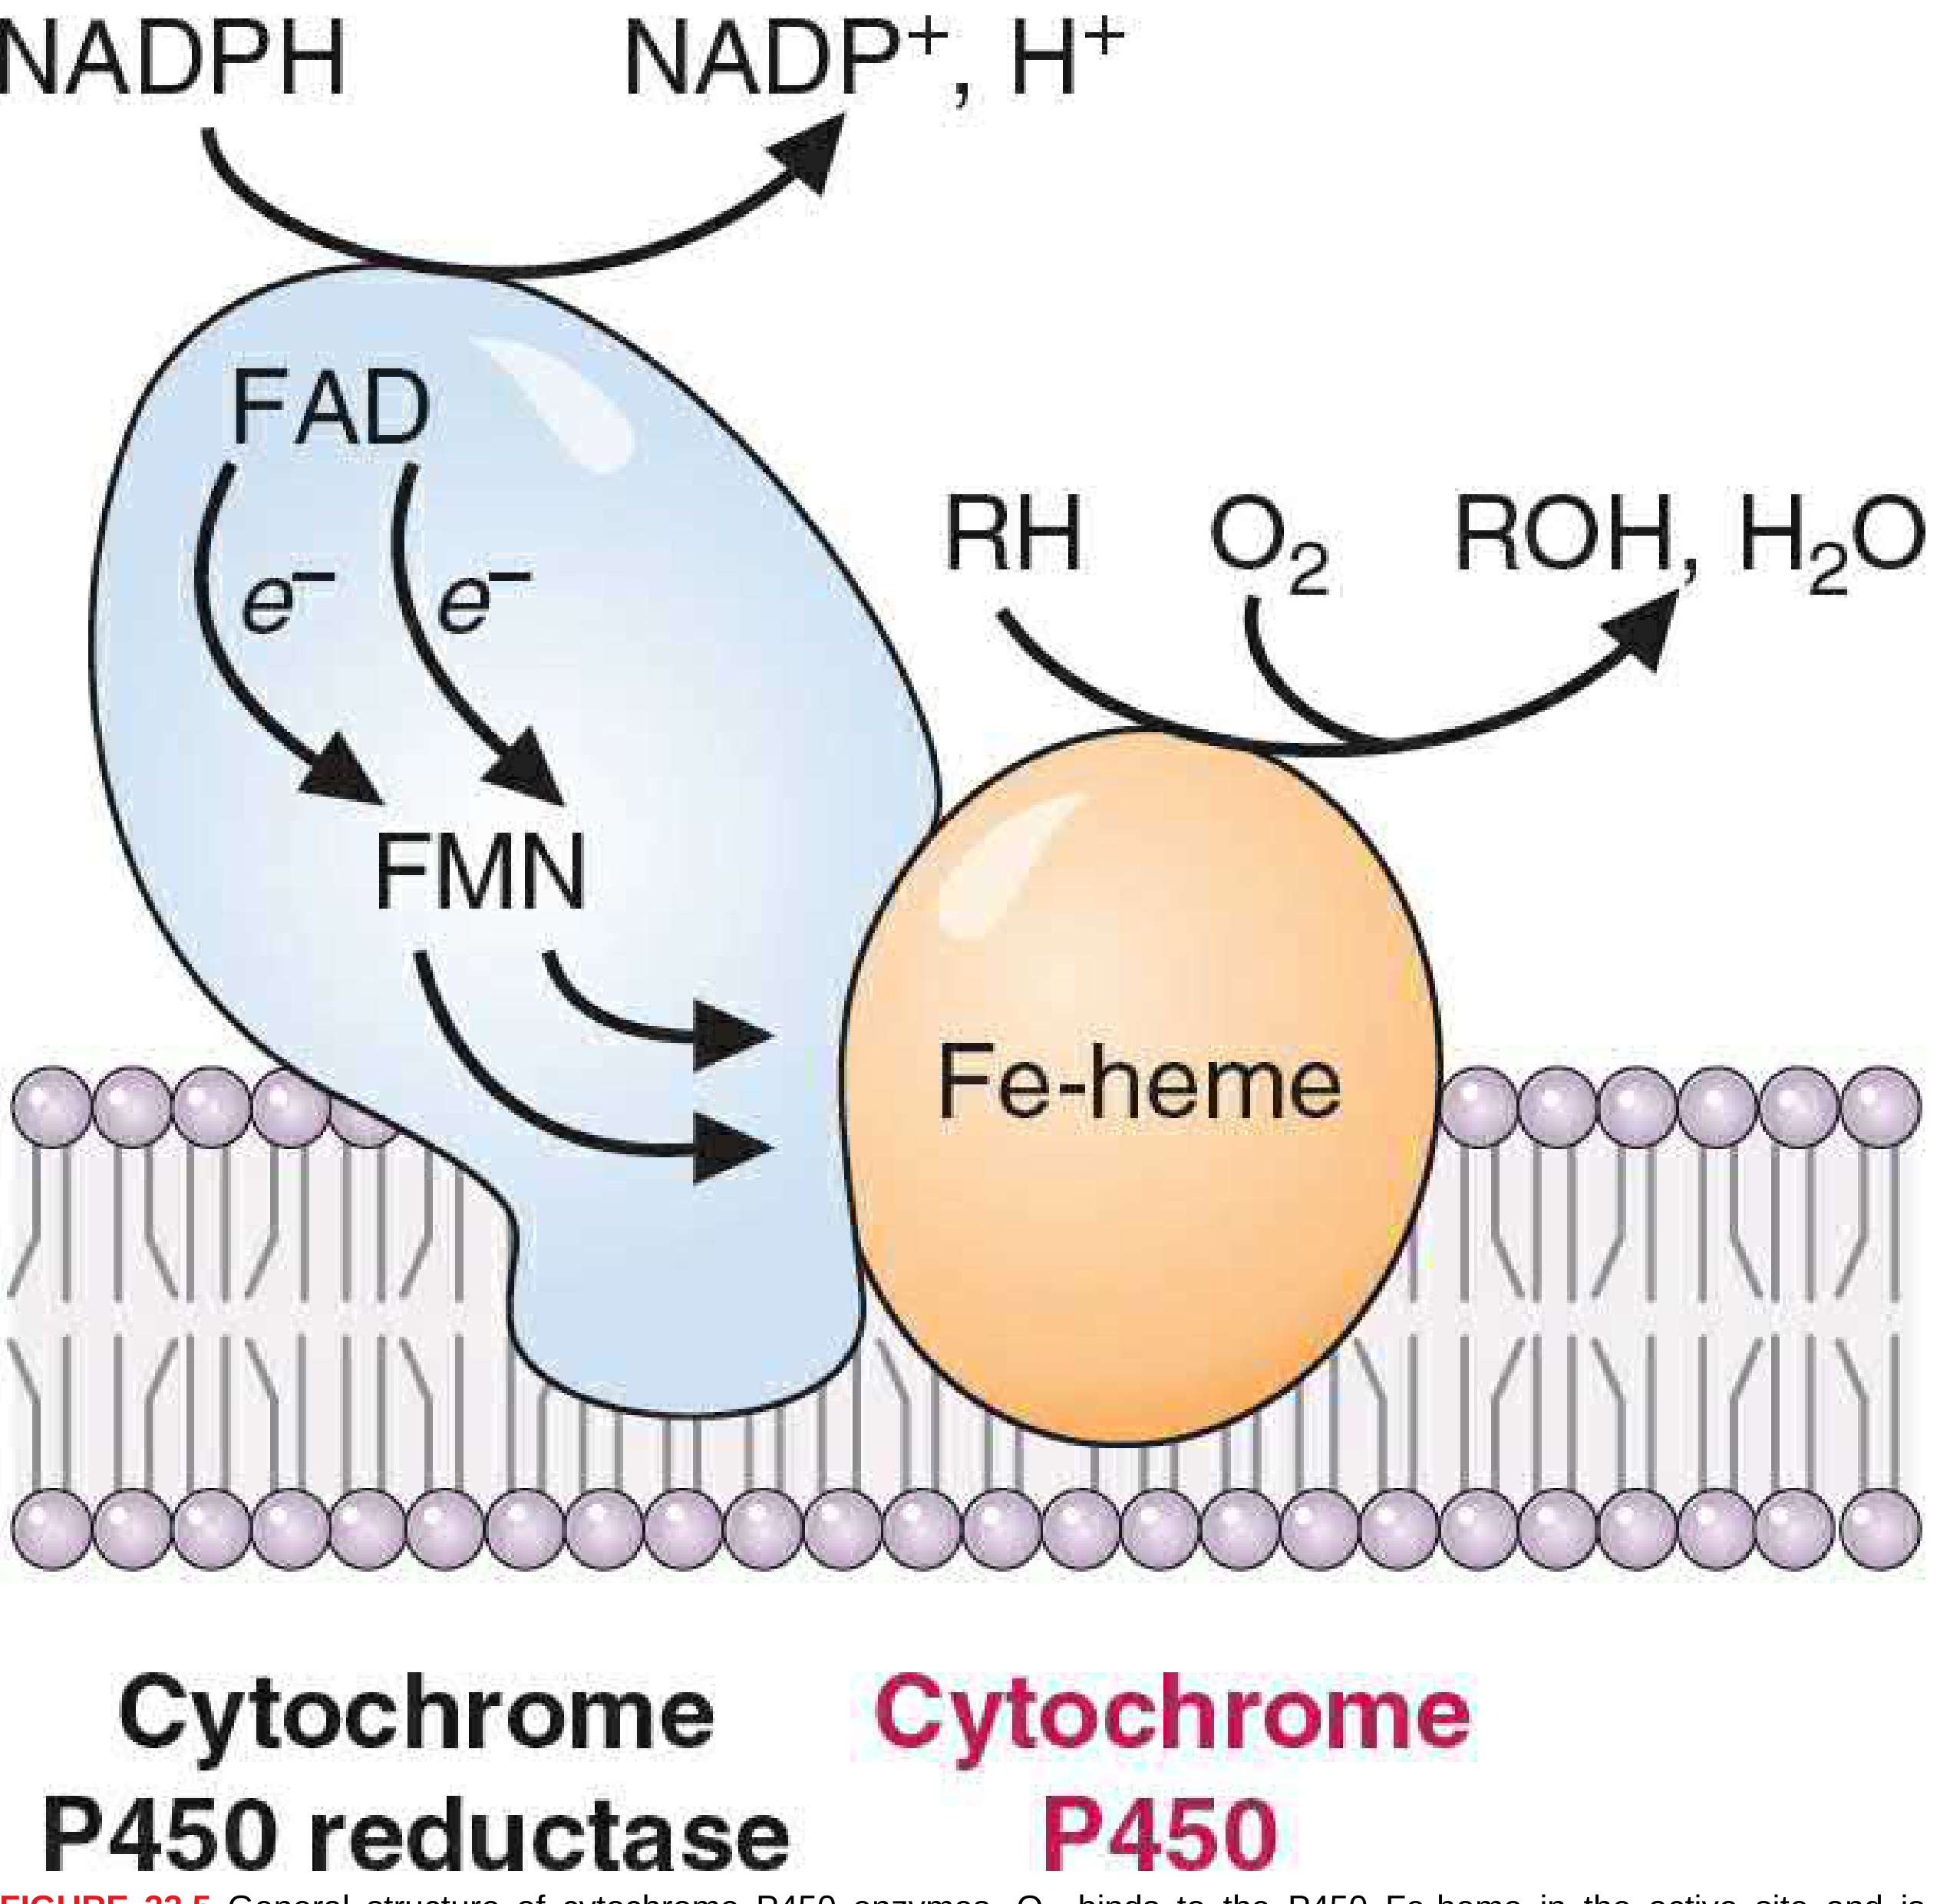
Figure 33.5 - General structure of cytochrome P450 enzymes (Basic Medical Biochemistry, 6th ed.)
Component 1: Cytochrome P450 reductase (blue)
- Contains FAD + FMN (or Fe-S centers)
- Accepts electrons from NADPH and passes them as single electrons (e⁻) to the P450
- Acts as the electron-donating reductase system
Component 2: Cytochrome P450 (orange, here CYP2E1)
- Contains an Fe-heme in the active site
- Has binding sites for both O₂ and the substrate (ethanol)
- Accepts electrons from the reductase, activates O₂
- Transfers one oxygen atom to the substrate (ethanol → acetaldehyde), the other oxygen is reduced to H₂O
The CYP naming system explained:
- CYP = Cytochrome P450
- 2 = gene family (>40% amino acid sequence identity)
- E = subfamily (>55% sequence identity)
- 1 = individual isoenzyme number
There are >100 different P450 isoenzymes in mammals across at least 10 gene families.
4. Why the High Km of CYP2E1 Matters
| Scenario | Blood ethanol (approx.) | Primary enzyme used |
|---|---|---|
| 1 drink | ~10-20 mg/dL (2-4 mM) | ADH (low Km; saturated at low ethanol) |
| Legally intoxicated (0.08%) | ~18 mM (~80 mg/dL) | ADH + some MEOS |
| Heavy binge drinking | 50-100+ mM | MEOS becomes major contributor |
| Chronic drinker (induced CYP2E1) | Any level | Significantly more MEOS |
Because CYP2E1's Km is ~11 mM, it only becomes a major contributor when ethanol concentrations are elevated. This is why MEOS matters clinically - precisely the situations (heavy drinking) where it is most active are also when its harmful side effects (free radicals, acetaldehyde overload) cause the most damage.
5. Induction of MEOS by Chronic Ethanol
This is the most clinically significant feature of MEOS.
Chronic ethanol consumption:
- Increases hepatic CYP2E1 levels by 5-10 fold
- Also causes 2-4 fold induction of other P450s (CYP2B, CYP3A, etc.)
- The entire smooth ER proliferates - more ER, more microsomal enzymes generally
Mechanism of CYP2E1 induction:
- Transcriptional: increased CYP2E1 mRNA (gene induction + mRNA stabilization)
- Post-translational: the protein is stabilized against degradation (increased protein half-life) - this is the predominant mechanism
- Ethanol acts as its own inducer by binding to intracellular receptor proteins
Consequences of induction:
- Faster ethanol clearance → metabolic tolerance (chronic drinkers need more alcohol to feel the same effect)
- More acetaldehyde produced faster than ALDH can handle → acetaldehyde overflow into blood → damage to other tissues
- Greatly increased free radical generation → oxidative stress → hepatocyte injury
- Cross-induction of other P450s → altered metabolism of many drugs
6. Free Radical Generation - The Core of MEOS Toxicity
This is what makes MEOS fundamentally more dangerous than the ADH pathway.
The FAD/FMN in the reductase and the Fe-heme in CYP2E1 transfer single electrons. This mechanism inherently generates free radicals as by-products.
Radicals produced:
| Radical | Source | Damage caused |
|---|---|---|
| Hydroxyethyl radical (CH₃CH•OH) | Directly from ethanol oxidation by CYP2E1 | Protein adducts, lipid peroxidation |
| Superoxide (O₂•⁻) | Electron leak from P450 system | Reacts with H₂O₂ → hydroxyl radical |
| Hydroxyl radical (•OH) | Fenton reaction (Fe²⁺ + H₂O₂) | Most reactive ROS; oxidizes everything |
| H₂O₂ | From superoxide by SOD | Substrate for Fenton reaction |
What these radicals damage:
- Membrane phospholipids - lipid peroxidation, especially in the inner mitochondrial membrane → disrupts electron transport → uncouples ATP synthesis → more oxidative stress (a vicious cycle)
- Proteins - oxidation and adduct formation → loss of enzyme function
- DNA - mutations → hepatocarcinogenesis (CYP2E1 induction by alcohol is linked to increased liver cancer risk)
- Mitochondria - membrane damage leads to impaired beta-oxidation and oxidative phosphorylation
7. Drug Interactions via Induced MEOS - Critical Clinical Point
Because CYP enzymes have overlapping substrate specificity, induction of CYP2E1 and other P450s by chronic alcohol use dramatically alters the metabolism of many drugs. There are two clinically opposite scenarios:
Scenario A: Chronic Alcohol + Drug (no alcohol currently)
CYP2E1/P450s are induced → faster drug metabolism → lower drug levels → reduced drug efficacy
Scenario B: Acute Alcohol + Drug (drinking now)
Ethanol competes with and inhibits the P450 system → slower drug metabolism → higher drug levels → drug toxicity
| Drug | Interaction with Chronic Alcohol | Mechanism |
|---|---|---|
| Acetaminophen (paracetamol) | Greatly increased hepatotoxicity | CYP2E1 induced → much more NAPQI formed |
| Phenobarbital / benzodiazepines | Increased clearance (chronic); additive CNS depression (acute) | P450 induction; CNS synergy |
| Warfarin | Increased clearance (chronic); reduced clearance (acute) | CYP2C9 affected |
| Isoniazid (INH) | Increased hepatotoxicity | CYP2E1 induction; adduct formation |
| Metronidazole, cefotetan | Disulfiram-like reaction | Inhibit ALDH → acetaldehyde accumulates |
| CCl₄, halothane, other hepatotoxins | Increased toxicity | CYP2E1 converts these to toxic reactive metabolites |
8. The Acetaminophen-Alcohol Interaction in Detail
This is the most clinically important MEOS drug interaction and deserves special attention:
ACETAMINOPHEN NORMALLY (>90%):
Acetaminophen → (glucuronidation/sulfation) → harmless conjugates → excreted
ACETAMINOPHEN SMALL FRACTION (5-10%):
Acetaminophen → (CYP2E1) → NAPQI (toxic!)
↓
+ Glutathione → mercapturic acid → excreted safely (detoxified)
IN CHRONIC ALCOHOL USER (CYP2E1 induced 5-10 fold):
Much more acetaminophen → CYP2E1 pathway → MUCH MORE NAPQI
+ Alcohol also depletes glutathione stores
= Glutathione overwhelmed
= NAPQI binds hepatocyte proteins covalently → HEPATOCYTE NECROSIS
Key nuance: Acute ethanol + acetaminophen may actually be protective because ethanol competitively inhibits CYP2E1 (competing for the same active site), reducing NAPQI formation. But chronic ethanol use is dangerous because induced CYP2E1 generates far more NAPQI from even normal acetaminophen doses.
9. MEOS and the Fetal Alcohol Spectrum
CYP2E1 is present in the developing fetal liver and placenta. Maternal ethanol consumption exposes the fetus to:
- Direct ethanol and acetaldehyde
- Reactive oxygen species from fetal CYP2E1 activity
- Interference with retinoic acid synthesis (CYP competes with retinaldehyde oxidation by ALDH)
Retinoic acid is essential for gene transcription during embryogenesis (via RAR/RXR nuclear receptors). Its deficiency leads to the characteristic abnormalities of fetal alcohol spectrum disorder (FASD).
10. MEOS Summary - ADH vs. MEOS at a Glance
ADH PATHWAY MEOS (CYP2E1)
Location: Cytosol Smooth ER
Coenzyme: NAD⁺ → NADH NADPH + O₂
Km (ethanol): Very low (high affinity) High (low affinity)
Dominates when: Normal drinking Heavy/chronic drinking
Inducible?: No Yes (5-10x by chronic ethanol)
Free radicals?: Minimal Yes - major source
Energy effect: Generates NADH (energy) Consumes NADPH (energy cost)
Clinical concern: Fatty liver, hypoglycemia Oxidative damage, drug interactions
via NADH excess hepatocarcinogenesis, NAPQI toxicity
The key reason MEOS matters clinically is the combination of: inducibility + free radical generation + drug interaction potential. The more alcohol someone drinks chronically, the more CYP2E1 is induced, the more damage occurs per unit of alcohol metabolized - a worsening cycle that explains the progressive nature of alcoholic liver disease.
Sources: Basic Medical Biochemistry: A Clinical Approach, 6th ed. (Chapter 33); Katzung's Basic and Clinical Pharmacology, 16th ed. (Chapter 23); Goodman & Gilman's Pharmacological Basis of Therapeutics; Harrison's Principles of Internal Medicine, 22nd ed.
different types of cellular accumulations its causes and consequences
Cellular accumulations occur when cells accumulate abnormal amounts of substances - either normal endogenous molecules (water, lipids, proteins, glycogen) or exogenous materials (carbon, silica). The main mechanisms are overproduction, impaired removal, defective metabolism, or inability to degrade/export the substance.
Searching sources...
Finding Sources
Finding Sources
Finding Sources
Finding Sources
Finding Sources
Finding Sources
Finding Sources
Finding Sources
Found Robbins Pathology - the definitive source. Let me read it.
Reading File
Reading File
Reading File
Reading File
Reading File
Reading File
Loading Image
Reading File
Loading Image
Reading File
Loading Image
I now have comprehensive, image-rich content from Robbins Pathology. Here is the complete guide:
Intracellular (Cellular) Accumulations - Complete Pathology Guide
Overview
One of the fundamental manifestations of metabolic derangements is the intracellular accumulation of substances that may be harmless or cause further injury. These substances can accumulate in the:
- Cytoplasm
- Organelles (typically lysosomes)
- Nucleus
They may be normal endogenous substances produced in excess, abnormal endogenous substances that cannot be processed, or exogenous materials that the cell cannot degrade.
The 4 Fundamental Mechanisms
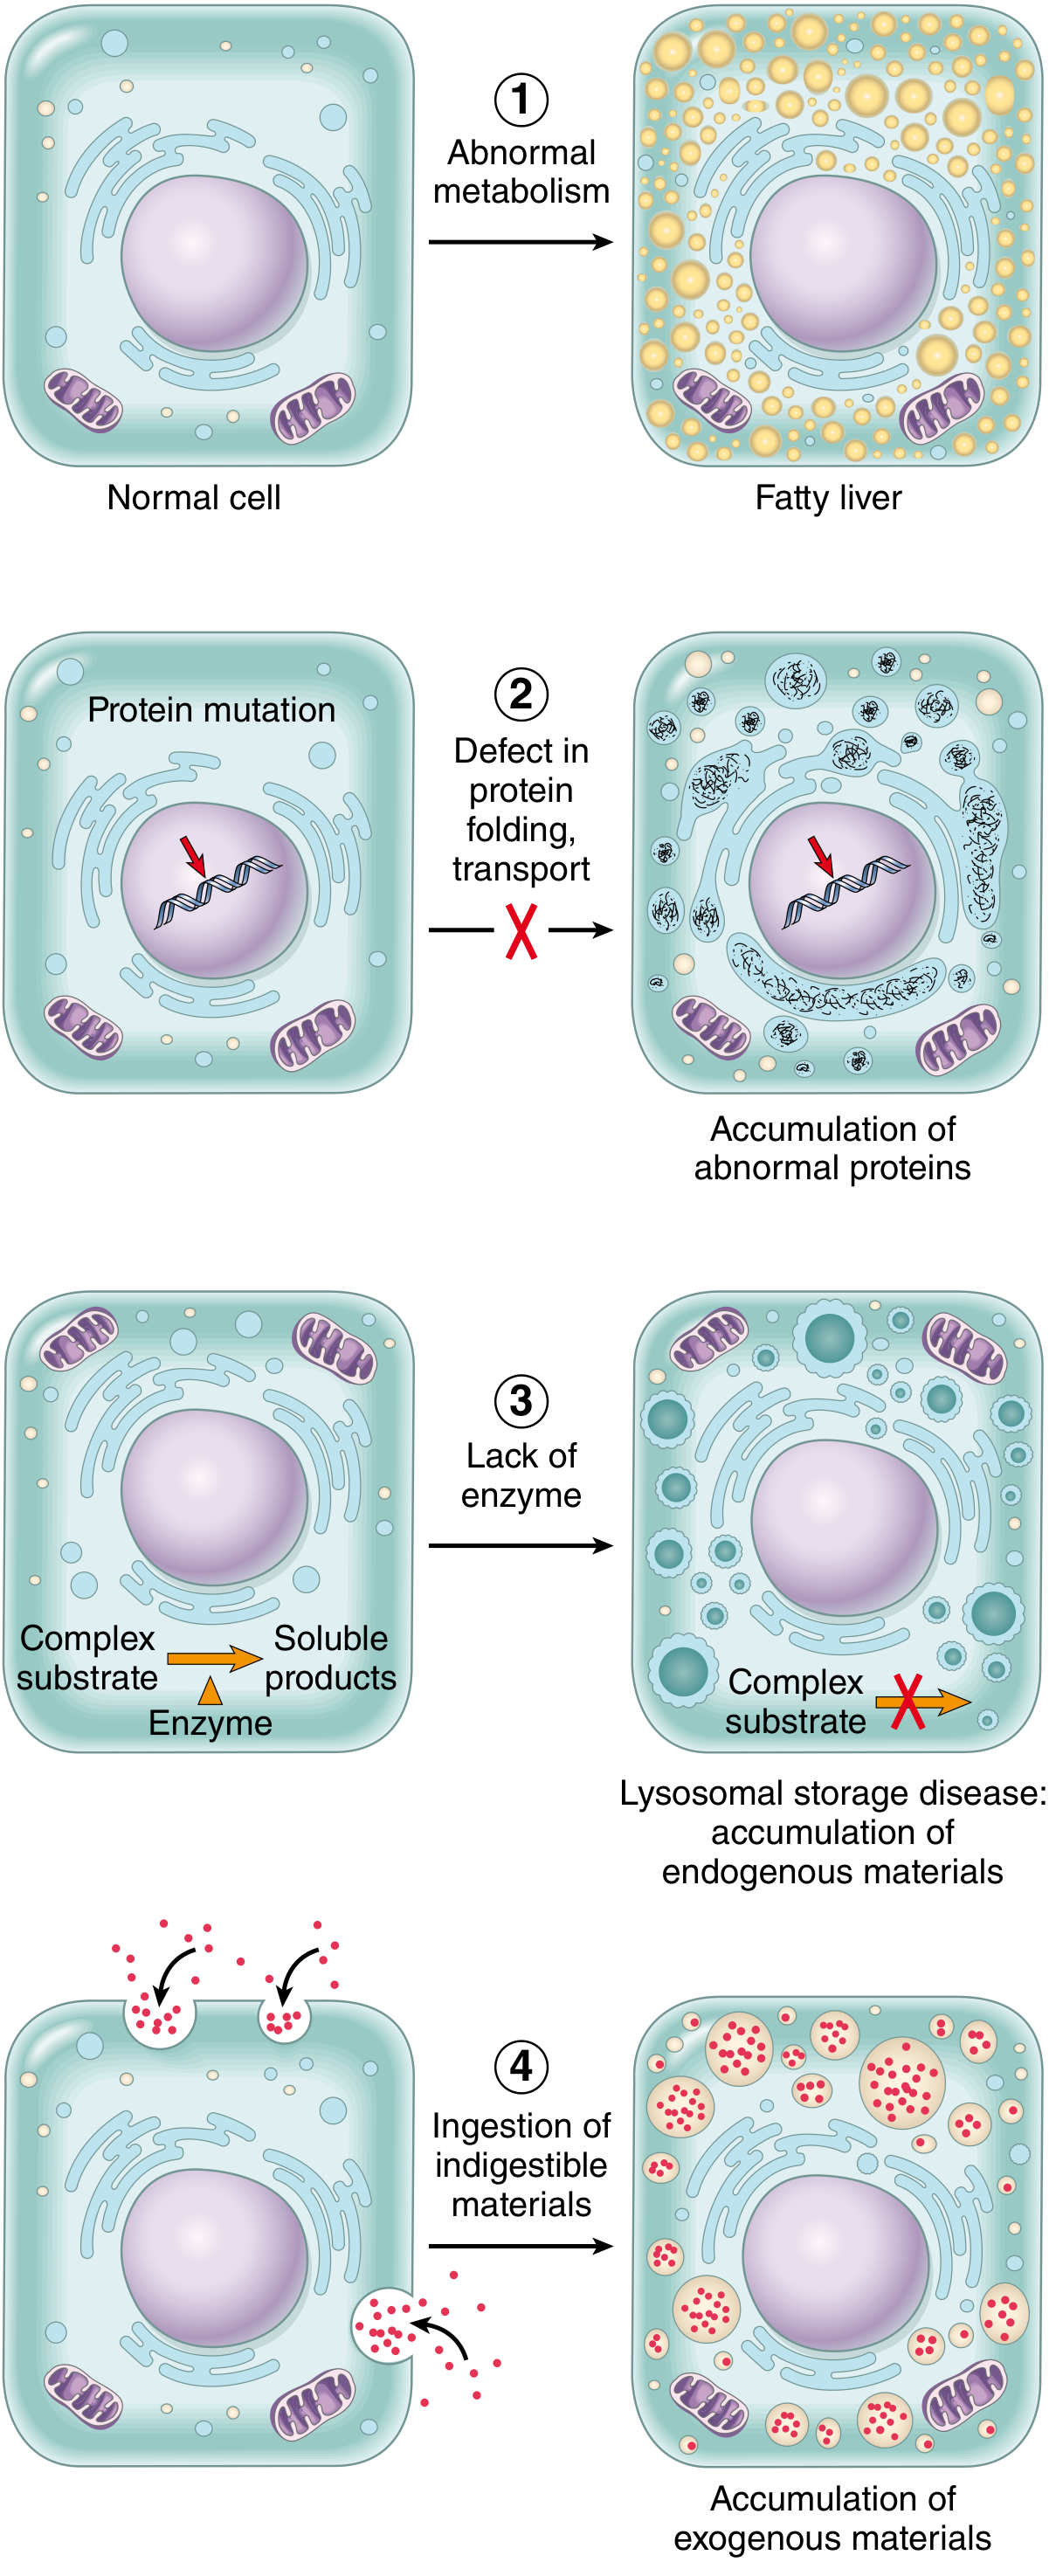
Fig. 2.29 - Mechanisms of intracellular accumulations (Robbins, Cotran & Kumar Pathologic Basis of Disease)
| Mechanism | Example |
|---|---|
| 1. Abnormal metabolism - inadequate removal of normal substance | Fatty change (steatosis) in liver |
| 2. Defect in folding/transport/secretion - genetic or acquired protein defect | α1-antitrypsin accumulation in hepatocytes |
| 3. Failure to degrade metabolite - inherited lysosomal enzyme deficiency | Lysosomal storage diseases (Gaucher, Niemann-Pick, etc.) |
| 4. Exogenous indigestible material - no enzyme machinery to degrade | Carbon/coal dust accumulation (anthracosis) |
Key point: If the overload can be stopped or reversed, accumulation is often reversible. In inherited storage diseases, accumulation is progressive and may lead to cell death and patient death.
TYPE 1: Lipid Accumulations
All major classes of lipids can accumulate: triglycerides, cholesterol/cholesterol esters, and phospholipids.
1A. Steatosis (Fatty Change) - Triglyceride Accumulation
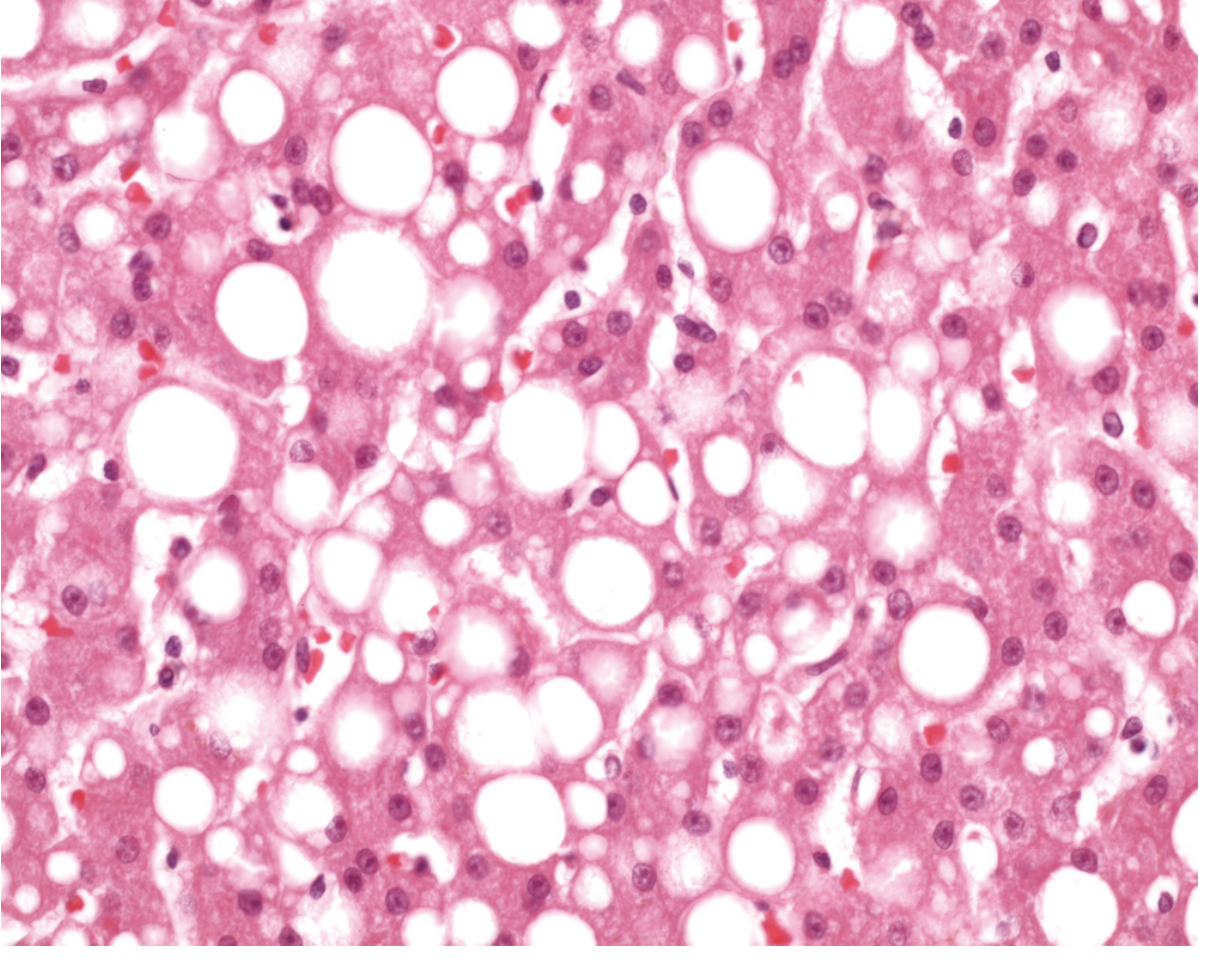
Fig. 2.30 - Fatty liver. Nuclei are squeezed to the rim of cytoplasm by large fat vacuoles (Robbins Pathology)
Definition: Abnormal accumulation of triglycerides within parenchymal cells, most commonly hepatocytes.
Why the liver? The liver is the major organ of fat metabolism - it both receives dietary lipids (as chylomicron remnants) and synthesizes VLDL for lipid export. Any disruption to this balance causes lipid to accumulate.
Causes of hepatic steatosis:
| Cause | Mechanism |
|---|---|
| Alcohol (most common in high-income nations) | High NADH → inhibits beta-oxidation + increases TAG synthesis + impairs VLDL export |
| Non-alcoholic fatty liver disease (NAFLD) | Insulin resistance → increased lipolysis + de novo lipogenesis |
| Obesity / type 2 diabetes | Excess FFA delivery to liver; insulin resistance |
| Protein malnutrition | Decreased apolipoprotein synthesis → impaired VLDL export → TAG accumulates |
| Toxins (CCl₄, tetracycline) | Damage ER → impair lipoprotein assembly and export |
| Anoxia/ischemia | Impaired fatty acid oxidation (needs O₂) |
Histology:
- Small vacuoles around nucleus (microvesicular) - acute injury, e.g., tetracycline toxicity, Reye syndrome, acute fatty liver of pregnancy
- Large single vacuole displacing nucleus to periphery (macrovesicular) - chronic, e.g., alcohol, NAFLD
Consequences:
- Initially: reversible, asymptomatic, hepatomegaly
- If persists: → inflammatory cytokines → steatohepatitis → fibrosis → cirrhosis
- NAFLD is now the most common cause of cryptogenic cirrhosis worldwide
Steatosis also occurs in:
- Heart (hypoxia, diphtheria toxin)
- Kidney
- Skeletal muscle
1B. Cholesterol and Cholesterol Ester Accumulation
Cholesterol metabolism is normally tightly regulated. Pathologic accumulation manifests as intracellular vacuoles (foam cells).
Diseases:
| Condition | Site of Accumulation | Cause | Consequence |
|---|---|---|---|
| Atherosclerosis | Smooth muscle cells + macrophages in arterial intima | Excess LDL uptake (especially oxidized LDL) via scavenger receptors | Foam cells → atheroma → plaque → MI, stroke |
| Xanthomas | Macrophages in skin/tendons | Familial hypercholesterolemia, hyperlipidemias | Tendon xanthomas, xanthelasma; cosmetic + diagnostic |
| Cholesterolosis | Macrophages in gallbladder lamina propria | Unknown | Strawberry gallbladder; usually asymptomatic |
| Niemann-Pick disease, Type C | Multiple organs | Mutation in NPC1/NPC2 cholesterol trafficking protein | Progressive neurodegeneration, hepatosplenomegaly |
Foam cells - macrophages stuffed with lipid vacuoles of cholesterol/CE. In atherosclerosis, rupture of foam cells releases cholesterol crystals into the extracellular space, where they:
- Form long needle-shaped clefts in tissue sections
- Activate the NLRP3 inflammasome in macrophages → IL-1β release → local inflammation → plaque progression
1C. Phospholipid Accumulation
- Component of myelin figures found in necrotic cells
- Accumulate in lysosomal storage diseases (see below)
TYPE 2: Protein Accumulations
Intracellular protein accumulations appear as rounded eosinophilic droplets, vacuoles, or aggregates in the cytoplasm. By electron microscopy: amorphous, fibrillar, or crystalline.
2A. Reabsorption Droplets (Hyaline Droplets in Renal Tubules)
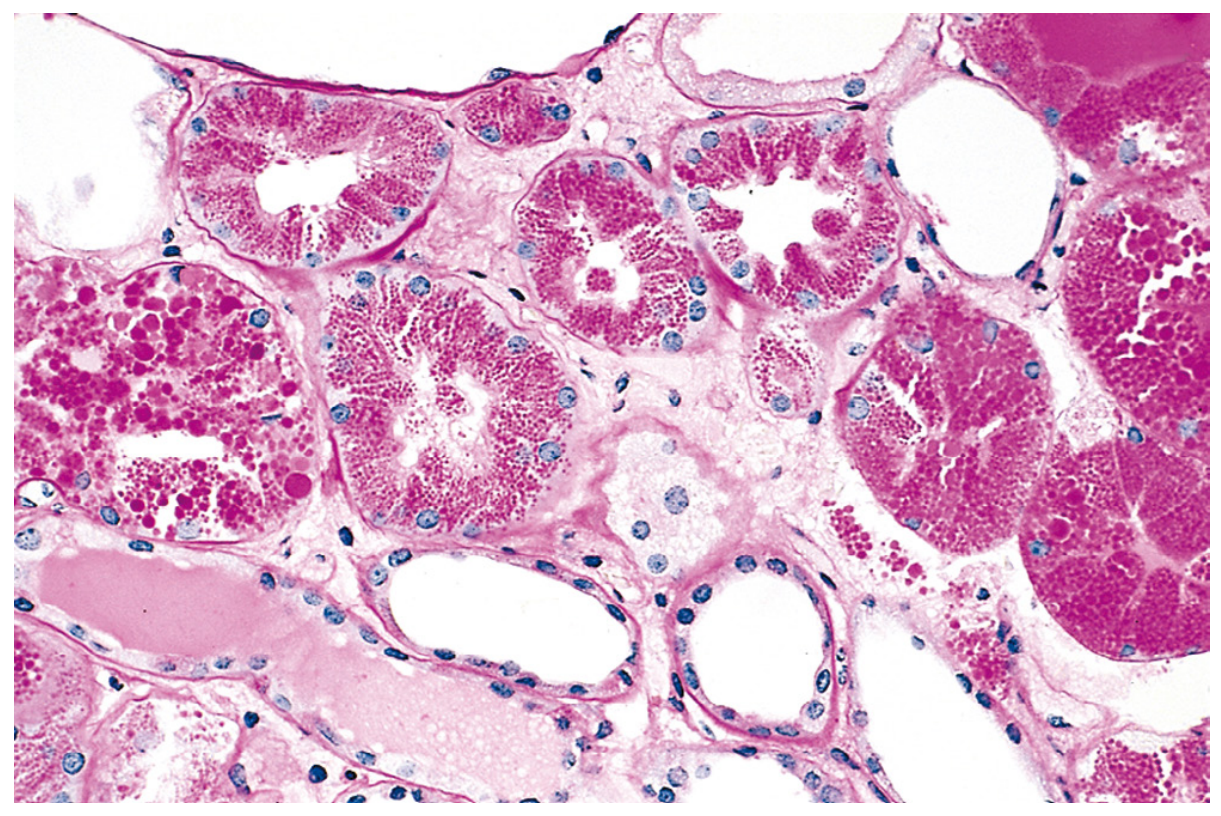
Fig. 2.32 - Protein reabsorption droplets in renal tubular epithelium (Robbins Pathology)
- Cause: Heavy proteinuria (nephrotic syndrome) → excess protein filtered across glomerulus → increased pinocytosis in proximal tubule → protein-filled pink hyaline droplets in cytoplasm
- Consequence: Reversible - if proteinuria resolves, droplets disappear
- Significance: Marker of ongoing glomerular damage
2B. Russell Bodies (Plasma Cells)
- Cause: Plasma cells engaged in excessive immunoglobulin synthesis → distended ER packed with immunoglobulins → large, homogeneous eosinophilic inclusions called Russell bodies
- Seen in: Chronic inflammation, multiple myeloma, plasmacytomas
- Consequence: Functional - plasma cell still active; not directly harmful
2C. α1-Antitrypsin Deficiency - Defective Protein Transport
- Cause: Mutations in α1-antitrypsin (AAT) gene slow protein folding → partially folded intermediates aggregate in ER of hepatocytes → PAS-positive diastase-resistant globules in hepatocyte cytoplasm
- Dual pathology:
- Loss of function in the lung: AAT normally inhibits neutrophil elastase. Deficiency → unchecked elastase activity → destruction of alveolar walls → emphysema (panacinar type)
- ER stress from misfolded protein accumulation → unfolded protein response → hepatocyte apoptosis → hepatitis and cirrhosis
- Consequence: Panlobular emphysema (especially lower lobes), liver cirrhosis, hepatocellular carcinoma
2D. Cytoskeletal Protein Accumulations
| Accumulation | Protein | Disease | Significance |
|---|---|---|---|
| Alcoholic hyaline (Mallory-Denk bodies) | Keratin intermediate filaments (K8, K18) | Alcoholic liver disease; NASH | Marker of severe hepatocyte injury; activates inflammation |
| Neurofibrillary tangles | Hyperphosphorylated tau + neurofilaments | Alzheimer disease | Disrupts axonal transport; neuronal death |
| Lewy bodies | α-Synuclein (intermediate filament-like) | Parkinson disease | Dopaminergic neuron loss in substantia nigra |
| Rosenthal fibers | GFAP (glial fibrillary acidic protein) | Alexander disease; astrocytomas | Marker of reactive astrocytes |
2E. Misfolded/Aggregated Proteins (Proteinopathies)
- Abnormal proteins that cannot be cleared by the ubiquitin-proteasome system accumulate and form toxic aggregates
- Both intracellular and extracellular deposition possible
- Examples: Amyloidosis (extracellular), Prion diseases, Huntington disease (intranuclear huntingtin inclusions)
- Mechanism of injury: Direct physical disruption + ER stress + activation of apoptosis
2F. Hyaline Change
A descriptive term for any homogeneous, glassy, pink (eosinophilic) appearance on H&E staining - not a specific material.
| Type | Location | Cause |
|---|---|---|
| Intracellular hyaline | Hepatocytes, plasma cells, renal tubules | Alcoholic hyaline, Russell bodies, protein droplets |
| Extracellular / vascular hyaline | Arteriolar walls (kidney, spleen) | Hypertension, diabetes mellitus - plasma protein extravasation + basement membrane deposition |
TYPE 3: Glycogen Accumulations
- Glycogen in normal cells dissolves in aqueous fixatives → appears as clear vacuoles in H&E; identified by PAS stain (rose-violet) or Best carmine stain; confirmed by diastase digestion (removes glycogen → stain disappears)
Causes:
| Condition | Mechanism | Site |
|---|---|---|
| Diabetes mellitus | Hyperglycemia drives excess glycogen synthesis | Renal tubular epithelium, hepatocytes, cardiac myocytes, β cells of pancreas |
| Glycogen storage diseases (glycogenoses) | Enzyme defects in glycogen synthesis or breakdown | Liver, muscle, heart (type-specific) |
Major glycogen storage diseases:
| Type | Enzyme Deficient | Organ Affected | Key Features |
|---|---|---|---|
| Type I (von Gierke) | Glucose-6-phosphatase | Liver, kidney | Severe hypoglycemia, hepatomegaly |
| Type II (Pompe) | Lysosomal alpha-glucosidase (acid maltase) | Heart, muscle | Hypertrophic cardiomyopathy in infants; myopathy in adults |
| Type V (McArdle) | Muscle phosphorylase | Skeletal muscle | Exercise intolerance, myoglobinuria |
Consequence: Progressive glycogen accumulation → cell swelling → cell death; cardiomyopathy, hypoglycemia, muscle failure depending on type.
TYPE 4: Pigment Accumulations
Pigments are colored substances - may be normal or abnormal, endogenous or exogenous.
4A. Exogenous Pigments
| Pigment | Source | Site | Consequence |
|---|---|---|---|
| Carbon (coal dust) | Inhaled air pollutant | Alveolar macrophages → tracheobronchial lymph nodes | Anthracosis (blackening of lung/nodes); Coal worker's pneumoconiosis → fibrosis, emphysema |
| Tattoo pigment | Injected into dermis | Dermal macrophages | Lifelong retention; no inflammatory response |
| Silica | Inhaled industrial particles | Pulmonary macrophages | Silicosis - fibrotic nodules in lung; risk of TB reactivation |
| Asbestos | Inhaled fibers | Lung parenchyma | Asbestosis - pulmonary fibrosis; pleural plaques; mesothelioma |
4B. Endogenous Pigments
Lipofuscin ("Wear-and-Tear Pigment")
- Nature: Polymers of oxidized lipids and phospholipids complexed with protein - product of lipid peroxidation of polyunsaturated membrane lipids
- Appearance: Yellow-brown, finely granular, perinuclear, intralysosomal
- Significance: Telltale marker of free radical injury and oxidative stress; NOT directly injurious to the cell
- Seen in: Aging hepatocytes and cardiac myocytes; severe malnutrition; cancer cachexia
- Diseases association: Brown atrophy of heart/liver (seen in cachexia)
Melanin
- Nature: Endogenous brown-black pigment; produced by melanocytes from tyrosine (via tyrosinase)
- Normal location: Skin, hair follicles, iris, substantia nigra, locus coeruleus
- Pathologic accumulations:
- Melanoma - malignant melanocytes produce excess melanin
- Addison disease - excess ACTH/MSH → increased skin melanin → hyperpigmentation
- Freckles, melanocytic nevi
- Loss: Vitiligo (autoimmune melanocyte destruction), Albinism (tyrosinase deficiency)
Hemosiderin
- Nature: Golden-yellow to brown granular/crystalline pigment; aggregated ferritin micelles (iron storage form)
- Normal: Small amounts in bone marrow macrophages, spleen, liver (recycling senescent RBCs)
- Pathologic - local excess:
- Bruise/hemorrhage: Extravasated RBCs → phagocytosed by macrophages → hemoglobin → heme → biliverdin (green) → bilirubin (yellow-green) → hemosiderin (brown/golden). This explains the color changes of a healing bruise (red → green → yellow → resolved)
- Pathologic - systemic excess (hemosiderosis):
| Cause | Mechanism |
|---|---|
| Hereditary hemochromatosis | HFE gene mutation → excess dietary iron absorption |
| Hemolytic anemias | Excess RBC destruction → iron release |
| Multiple blood transfusions | Each unit = exogenous iron load |
- Consequences of iron overload:
- Liver: Cirrhosis
- Pancreas: "Bronze diabetes" (diabetes mellitus)
- Heart: Cardiomyopathy
- Skin: Bronze discoloration
- Joints: Arthropathy
- Pituitary/gonads: Hypogonadism
Bilirubin
- Product of heme catabolism
- Normally conjugated in liver and excreted in bile
- Accumulates in jaundice (icterus) - causes yellow discoloration of skin, sclerae, mucous membranes
- Types: Pre-hepatic (hemolysis), hepatic (hepatocellular disease), post-hepatic (biliary obstruction)
TYPE 5: Pathologic Calcification (Bonus - Related Accumulation)
Abnormal deposition of calcium salts in tissues. Two types:
| Dystrophic Calcification | Metastatic Calcification | |
|---|---|---|
| Serum calcium | Normal | Elevated (hypercalcemia) |
| Tissue state | Dead/dying tissue | Normal tissue |
| Mechanism | Phosphatases released from dying cells → Pi released → binds Ca²⁺ | Hypercalcemia overwhelms normal buffering |
| Causes | Necrosis, atherosclerotic plaques, TB lesions, thrombi, aging valves | Hyperparathyroidism, vitamin D toxicity, bone metastases, sarcoidosis, milk-alkali syndrome |
| Sites | Within the lesion (e.g., calcified atheroma, calcified TB nodule) | Kidneys (nephrocalcinosis), lungs, gastric mucosa, systemic arteries |
| Consequences | Marker of prior injury; aortic stenosis from valve calcification | Organ dysfunction (nephrocalcinosis → renal failure) |
Summary Table - All Cellular Accumulations
| Substance | Type | Key Cause | Key Disease | Consequence |
|---|---|---|---|---|
| Triglycerides | Lipid | Alcohol, NAFLD, protein malnutrition | Fatty liver (steatosis) | Cirrhosis if persists |
| Cholesterol | Lipid | Ox-LDL in macrophages | Atherosclerosis, xanthomas | Foam cells, plaque, MI/stroke |
| Triglycerides (protein-related) | Lipid/protein | Defective VLDL export | Hepatic steatosis | Hepatomegaly |
| α1-Antitrypsin | Protein | Misfolding/ER retention | α1-AT deficiency | Emphysema + cirrhosis |
| Immunoglobulins | Protein | Excess Ig synthesis | Multiple myeloma | Russell bodies; functional impact |
| Keratin filaments | Cytoskeletal protein | Alcohol | Alcoholic hepatitis (Mallory bodies) | Hepatocyte injury, inflammation |
| Tau / neurofilaments | Cytoskeletal protein | Hyperphosphorylation | Alzheimer disease | Neuronal death |
| Glycogen | Carbohydrate | Enzyme deficiency, DM | Glycogenoses, DM | Cardiomyopathy, hypoglycemia |
| Carbon/coal dust | Exogenous pigment | Inhalation | Anthracosis, CWP | Lung fibrosis, emphysema |
| Lipofuscin | Endogenous pigment | ROS/lipid peroxidation | Aging, cachexia | Marker of oxidative stress |
| Melanin | Endogenous pigment | Excess production | Melanoma, Addison | Hyperpigmentation/malignancy |
| Hemosiderin | Endogenous pigment | Iron overload | Hemochromatosis | Cirrhosis, DM, cardiomyopathy |
| Calcium salts | Mineral | Necrosis (dystrophic); hypercalcemia (metastatic) | Atherosclerosis, TB, hyperPTH | Valve stenosis, nephrocalcinosis |
Source: Robbins, Cotran & Kumar - Pathologic Basis of Disease (Chapter 2, primary source throughout)
This is a shared conversation. Sign in to Orris to start your own chat.