
"cardiac cycle" AND physiology
cardiac cycle valve opening closure Wiggers diagram conduction system timing physiology
- Just the answers for questions 1-6
- Answers with brief explanations
- Step-by-step help drawing the volume, pressure, ECG, and conduction-system diagrams
?
Solve all six worksheet questions
"cardiac cycle" AND physiology
NCBI cardiac cycle Wiggers diagram valve closure opening ECG conduction system timing
1. Multiple-choice answers
A. Isovolumetric ventricular contraction
B. What happens to atrial blood volume while ventricles contract?
2. Left ventricular volume curve
- Atrial systole, about 0-120 ms: volume rises slightly, from about 125 mL to 135 mL. This is the atrial "kick."
- Isovolumetric ventricular contraction, about 120-150 ms: draw a flat line at 135 mL.
- Ventricular ejection, about 150-400 ms: draw a downward sloping curve from 135 mL to 65 mL.
- Isovolumetric relaxation, just after 400 ms: draw a flat line at 65 mL.
- Early ventricular diastole: draw a steep upward curve as rapid ventricular filling occurs.
- Late ventricular diastole: continue with a gentle upward slope as passive filling continues.
- At the next atrial systole, near 800 ms, add another small rise to reach 135 mL again.
3. Left ventricular pressure curve
- Atrial systole, 0-120 ms: LV pressure is low, around 5-10 mm Hg, with a small rise caused by atrial contraction.
- Isovolumetric ventricular contraction, around 120-150 ms: draw a very steep rise from about 10 mm Hg to 85-90 mm Hg. The curve crosses above left atrial pressure first, then reaches aortic pressure.
- Ventricular ejection, around 150-400 ms: LV pressure remains just above aortic pressure. It rises to a peak near 120 mm Hg, then gradually falls toward 100 mm Hg.
- Isovolumetric relaxation, just after 400 ms: draw a very steep fall from about 100 mm Hg down to 5-10 mm Hg.
- Ventricular diastole: LV pressure stays low, below left atrial pressure, with a slight rise late in diastole during atrial systole.
- Above left atrial pressure to close the mitral valve
- Above aortic pressure to open the aortic valve
- Below aortic pressure after ejection, allowing aortic valve closure
- Below left atrial pressure to open the mitral valve
4. Labels for points 1-4 and heart sounds
| Number on graph | Event | Valve action |
|---|---|---|
| 1 | Start of isovolumetric ventricular contraction | Mitral valve closes because LV pressure becomes greater than left atrial pressure |
| 2 | Start of ventricular ejection | Aortic valve opens because LV pressure becomes greater than aortic pressure |
| 3 | Start of isovolumetric relaxation | Aortic valve closes because aortic pressure becomes greater than LV pressure. This creates the dicrotic notch. |
| 4 | Start of ventricular filling | Mitral valve opens because left atrial pressure becomes greater than LV pressure |
Heart sounds
- S1: at point 1, caused mainly by closure of the mitral and tricuspid valves.
- S2: at point 3, caused mainly by closure of the aortic and pulmonary valves.
5. ECG to draw above the pressure graph
- P wave: a small upward rounded wave at the beginning of atrial systole, just before atrial contraction. It represents atrial depolarization.
- QRS complex: a sharp, tall complex immediately before the beginning of ventricular systole and the steep LV-pressure rise. It represents ventricular depolarization.
- T wave: a broader rounded upward wave near the end of ventricular systole, shortly before or around aortic-valve closure and S2. It represents ventricular repolarization.
            Q R S                         T
 P         /\|/\                        /\
/ \_______/     \_____________________/  \____
- P wave: around the start of atrial systole, approximately 0-50 ms
- QRS complex: just before ventricular systole, approximately 100-150 ms
- T wave: late ventricular systole, approximately 300-400 ms
- Begin the next P wave near 800 ms.
6. Conducting system of the heart with approximate impulse timing
SA node
  ↓
Atrial pathways / atrial myocardium
  ↓
AV node
  ↓
Bundle of His (AV bundle)
  ↓
Right and left bundle branches
  ↓
Purkinje fibers
  ↓
Ventricular myocardium, from apex upward
What to label on your heart diagram
| Structure | Location to draw | Approximate timing from SA-node firing |
|---|---|---|
| SA node | Upper right atrium, near superior vena cava | 0 ms |
| Atrial myocardium / internodal pathways | Across both atria toward AV node | 0-50 ms |
| AV node | Lower interatrial septum, near tricuspid valve | about 50-120 ms. This is the major delay. |
| Bundle of His | From AV node into upper interventricular septum | about 120-140 ms |
| Right and left bundle branches | Down either side of interventricular septum toward apex | about 140-170 ms |
| Purkinje fibers | Spread through ventricular walls from apex upward | about 170-220 ms |
| Ventricular myocardium fully activated | Both ventricles, beginning near apex | about 220 ms |
Can u give solved diagrams pls
A clean, accurate, student-friendly set of solved physiology worksheet diagrams on a white background. Include three labeled panels. Panel 1: a Wiggers-style cardiac cycle graph from 0 to 800 milliseconds with left ventricular volume curve in blue, rising from about 120 mL to 135 mL during atrial systole, flat at 135 mL during isovolumetric contraction, descending to 65 mL during ventricular ejection, flat during isovolumetric relaxation, rapidly rising then slowly rising during ventricular filling; label end-diastolic volume 135 mL and end-systolic volume 65 mL. Panel 2: Wiggers pressure graph with aorta, left ventricle and left atrium, label valve events 1 mitral valve closes / S1, 2 aortic valve opens, 3 aortic valve closes / S2 and dicrotic notch, 4 mitral valve opens. Include a normal ECG above it with P wave before atrial systole, QRS just before ventricular systole, and T wave at end of ventricular systole. Panel 3: a simple anatomical heart conduction-system diagram, clearly label SA node 0 ms, atrial pathways 0-50 ms, AV node 50-120 ms with AV nodal delay, bundle of His 120-140 ms, right and left bundle branches 140-170 ms, Purkinje fibers 170-220 ms, arrows showing activation from apex upward. Use correct spellings and uncluttered textbook-like labels.
Wiggers diagram left ventricular volume cardiac conduction system timing AV node physiology
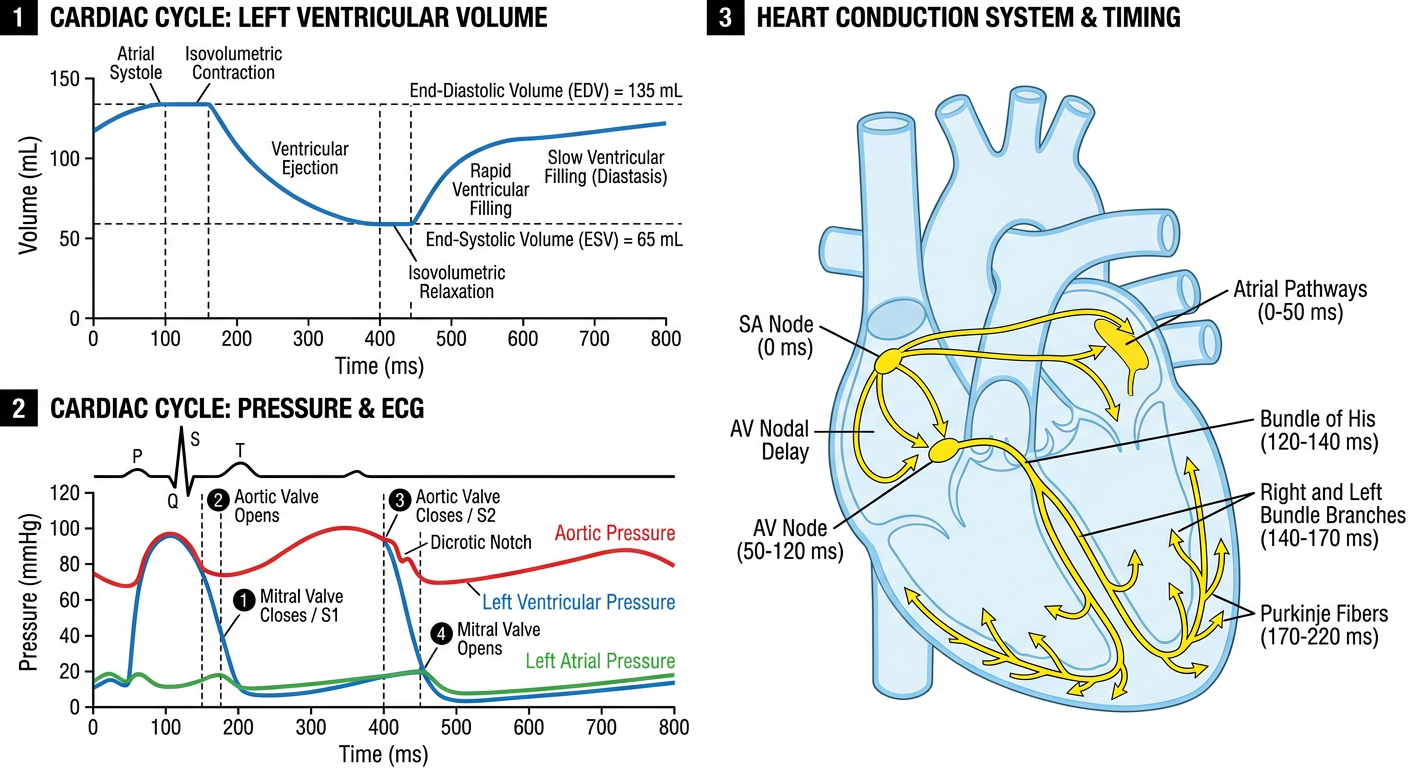
Key labels to copy exactly
- Mitral valve closes - S1
- Aortic valve opens
- Aortic valve closes - S2 and the dicrotic notch
- Mitral valve opens
- P wave: immediately before atrial systole
- QRS complex: immediately before the sharp rise in LV pressure and ventricular systole
- T wave: near the end of ventricular systole, before S2
- Peak volume: 135 mL at end-diastole
- Flat at 135 mL during isovolumetric contraction
- Falls to 65 mL during ventricular ejection
- Flat at 65 mL during isovolumetric relaxation
- Rises rapidly in early ventricular diastole, then more gradually
- Small final rise during atrial systole