ECG read in simple language
Reading File
Finding Sources
Finding Sources
Finding Sources
Finding Sources
Reading File
Finding Sources
Reading File
Reading File
Reading File
Reading File
Loading Image
Loading Image
I now have rich content from multiple authoritative sources. Let me compile the full, simple-language ECG guide.
How to Read an ECG - In Plain Language
What Is an ECG?
An ECG (electrocardiogram) is a recording of the electrical activity of your heart, picked up by electrodes placed on the skin. Every time the heart beats, a tiny electrical wave travels through it - the ECG captures that wave and draws it on paper (or a screen). It does not measure pumping force directly; it measures the electrical signals that trigger each heartbeat.
- Paper speed: 25 mm/second
- Small box = 1 mm = 0.04 seconds
- Large box = 5 mm = 0.20 seconds
- Height (amplitude): 10 mm = 1 mV
(Harriet Lane Handbook)
Step 1 - Understand the Electrical Journey of One Heartbeat
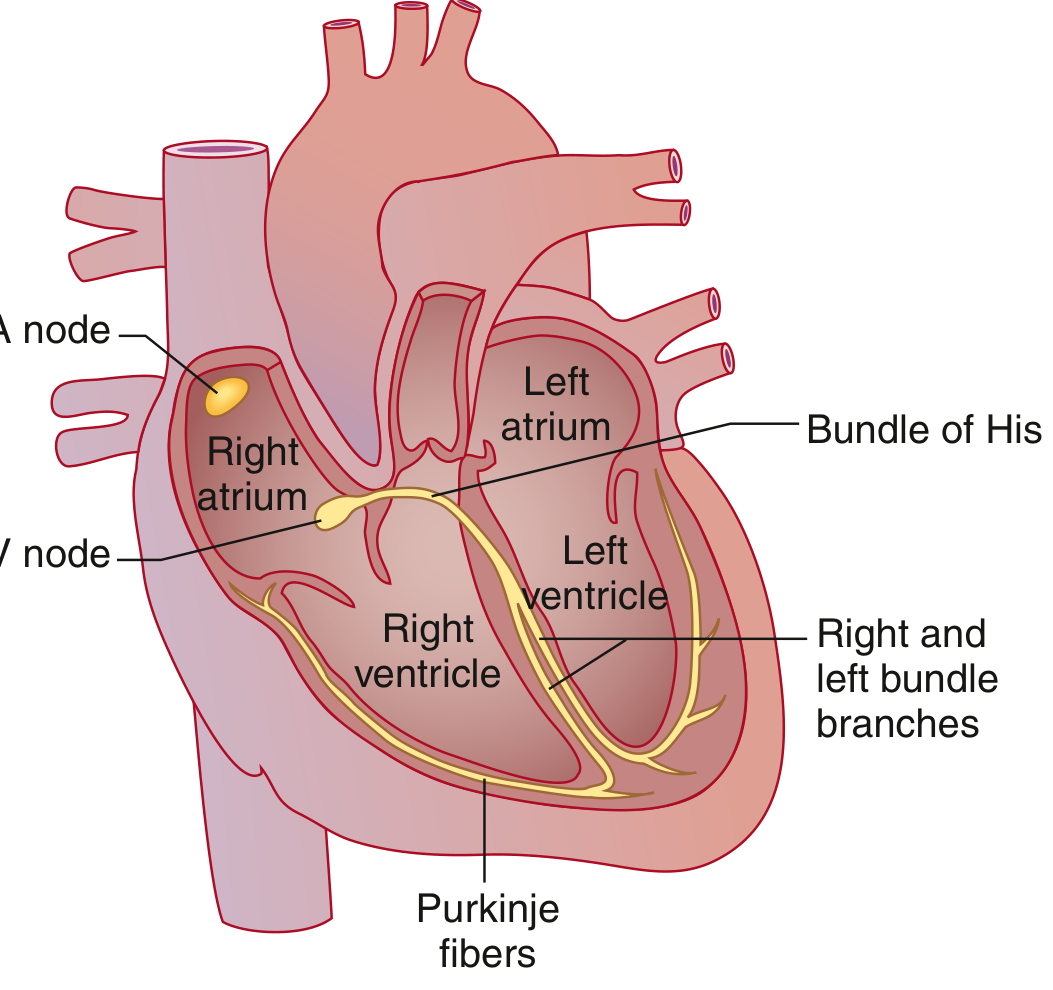
Every heartbeat follows this exact path:
- SA node (sinoatrial node) - the natural pacemaker, sits in the right atrium. It fires first.
- Electricity spreads across both atria → atria squeeze (atrial contraction).
- Signal arrives at the AV node (between atria and ventricles) → it deliberately slows down (a safety pause).
- Signal travels down the Bundle of His → splits into right and left bundle branches → fans out into Purkinje fibers.
- Both ventricles contract together, pumping blood to the lungs and body.
- The ventricles recover (repolarize) and get ready for the next beat.
(Goldman-Cecil Medicine; Miller's Anesthesia)
Step 2 - The Waves on an ECG and What They Mean
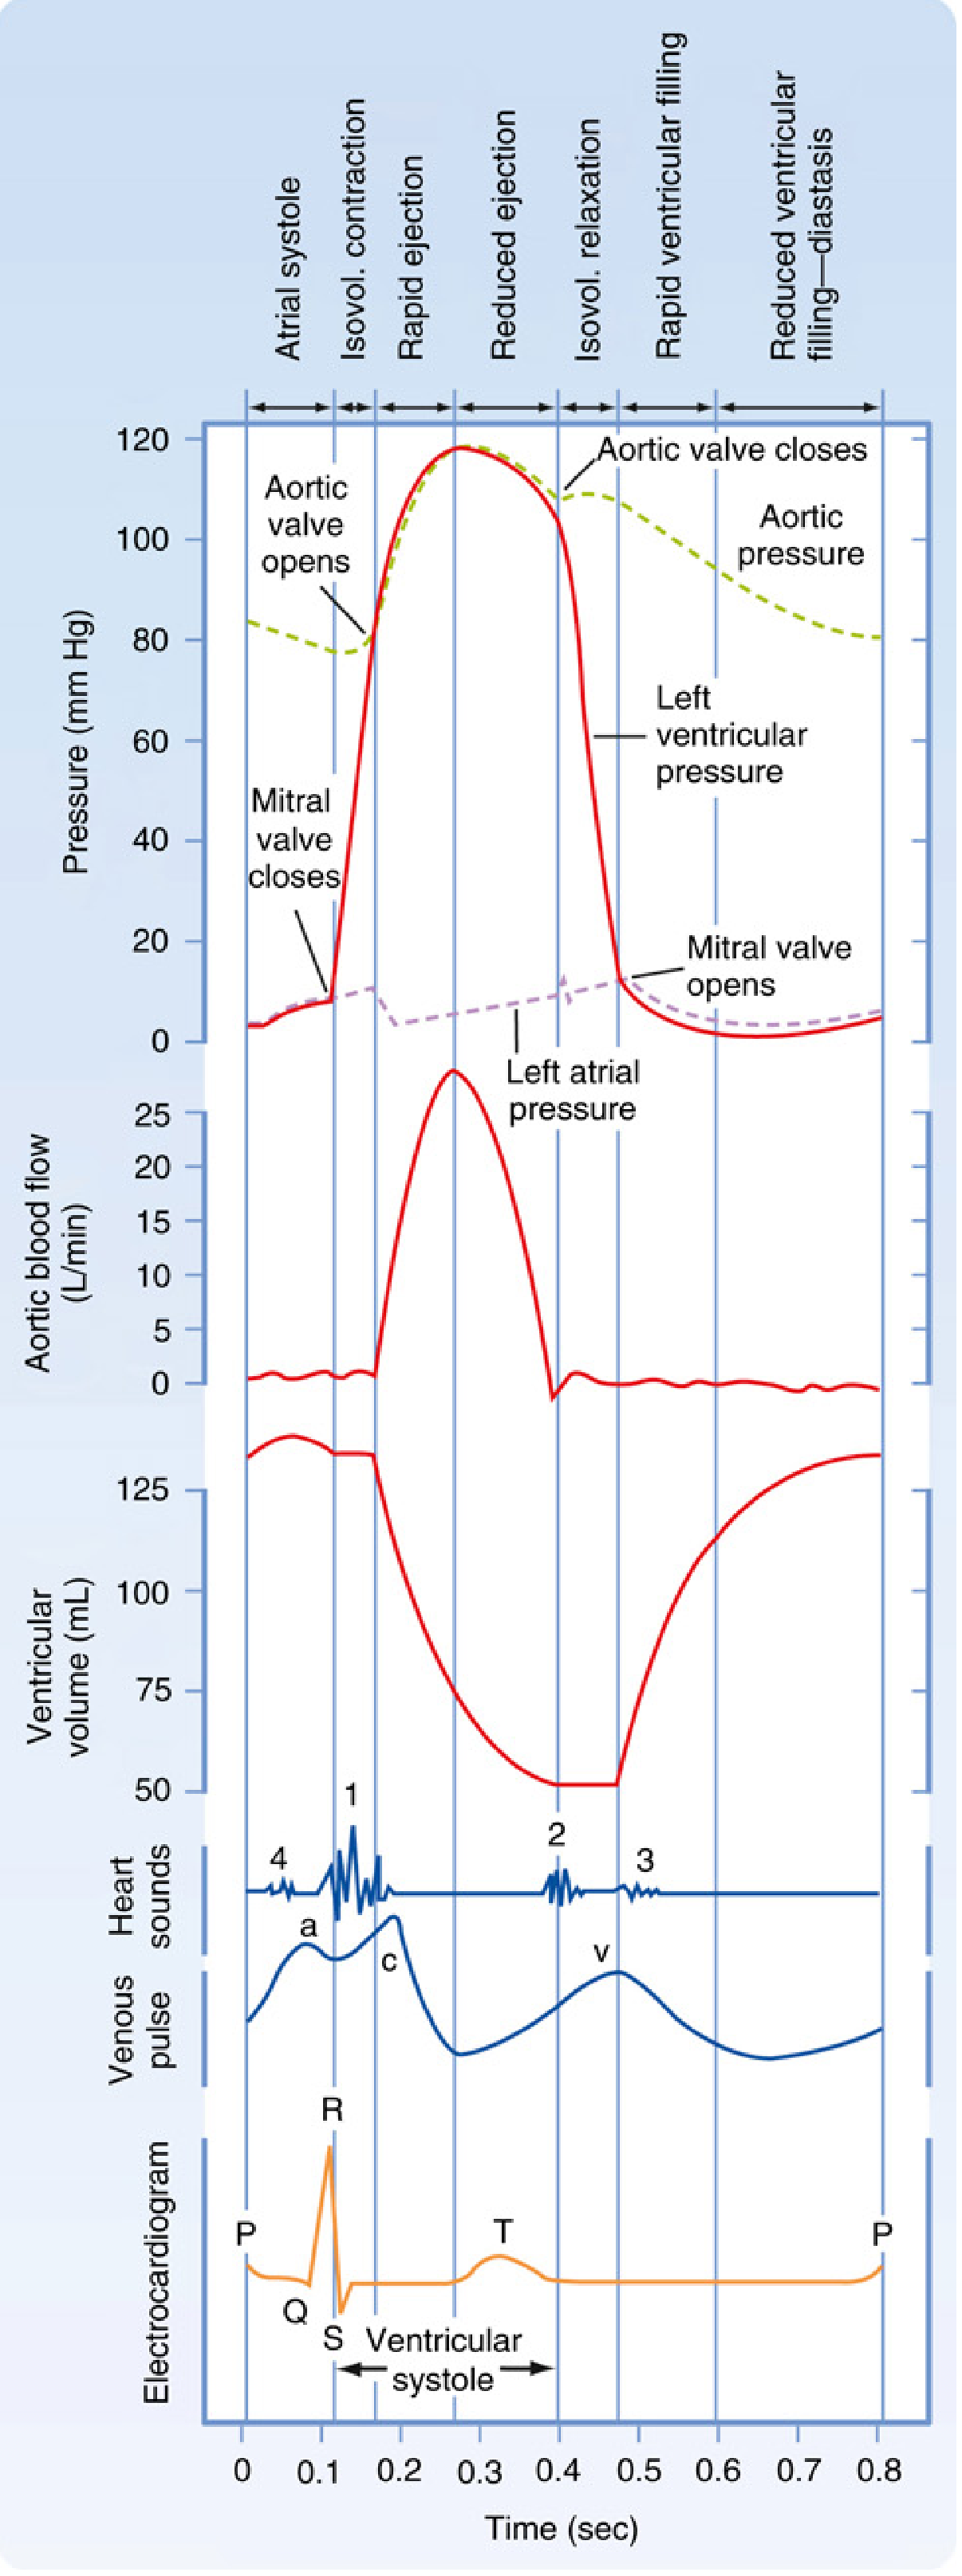
Each heartbeat draws this pattern on paper:
| Wave / Segment | What It Represents | Normal Duration |
|---|---|---|
| P wave | Atria depolarize (fire) → atria contract | < 0.12 sec (3 small boxes) |
| PR interval | Time from atria firing to ventricles firing (AV node delay) | 0.12 - 0.20 sec (3-5 large boxes) |
| QRS complex | Ventricles depolarize → ventricles contract | < 0.12 sec (3 small boxes) |
| ST segment | Pause between ventricular contraction and recovery | Flat = normal (on the baseline) |
| T wave | Ventricles repolarize (recover/reset) | Smooth, upright hump |
| QT interval | Total ventricular electrical activity (fire + recover) | < 0.44 sec (QTc) |
| U wave | Late ventricular repolarization (not always seen) | Small bump after T |
Simple memory trick: "P fires atria. QRS fires ventricles. T resets ventricles."
(Guyton & Hall Textbook of Medical Physiology; Goldman-Cecil Medicine)
Step 3 - The Systematic 6-Step Reading Approach
When you pick up an ECG, always go through these steps in order. Never skip around.
1. Rate - How Fast Is the Heart Beating?
Quick method: Count the large boxes between two consecutive R waves (the tallest peak), then divide 300 by that number.
| Boxes between R waves | Heart Rate |
|---|---|
| 1 box | 300 bpm |
| 2 boxes | 150 bpm |
| 3 boxes | 100 bpm |
| 4 boxes | 75 bpm |
| 5 boxes | 60 bpm |
| 6 boxes | 50 bpm |
- Normal: 60-100 bpm
- Bradycardia: < 60 bpm (too slow)
- Tachycardia: > 100 bpm (too fast)
(Harriet Lane Handbook)
2. Rhythm - Is the Beat Regular?
- Are the R-R intervals (distance between peaks) equal throughout?
- Is every QRS preceded by a P wave?
- Is every P wave followed by a QRS?
- Sinus rhythm = P wave before every QRS, P upright in leads I and aVF. This is normal.
- Irregular rhythm with no visible P waves = think atrial fibrillation.
3. Axis - Which Direction Is the Electrical Wave Going?
The QRS axis tells you whether the heart's electrical wave travels in the correct direction through the ventricles.
- Look at leads I and aVF.
- Both positive (pointing up) = normal axis (~0° to +90°)
- Lead I positive, aVF negative = left axis deviation (can mean left bundle branch block, LVH)
- Lead I negative, aVF positive = right axis deviation (can mean RVH, pulmonary embolism)
4. Intervals - Are the Timing Gaps Normal?
| Interval | What to Check | Abnormal Finding |
|---|---|---|
| PR interval | 0.12-0.20 sec | Long = heart block; Short = WPW syndrome |
| QRS duration | < 0.12 sec | Wide = bundle branch block or ventricular origin |
| QTc | ≤ 0.44 sec | Long QT = risk of fatal arrhythmia (Torsades) |
(Harriet Lane Handbook)
5. P Wave - Is Atrial Activity Normal?
- Should be small, rounded, and upright in most leads.
- Normal height < 3 mm, duration < 0.09 sec.
- Tall, peaked P in lead II = right atrial enlargement ("P pulmonale").
- Broad, notched P in lead II = left atrial enlargement ("P mitrale").
- No P waves at all = atrial fibrillation or junctional rhythm.
6. QRS and ST-T Changes - Is the Heart Muscle in Trouble?
This is where you look for the big emergencies:
| Finding | Think of |
|---|---|
| ST elevation (above baseline) | Heart attack (STEMI) - call for help immediately |
| ST depression | Ischemia (poor blood flow), NSTEMI |
| Inverted T waves | Ischemia, ventricular strain |
| Wide QRS (> 0.12 sec) | Bundle branch block, ventricular tachycardia |
| Tall R in V1, deep S in V6 | Right ventricular hypertrophy |
| Tall R in V5/V6, deep S in V1 | Left ventricular hypertrophy |
| Peaked tall T waves | Hyperkalemia (high potassium - dangerous) |
| Tiny voltages everywhere | Pericardial effusion, obesity, hypothyroidism |
Step 4 - Common Rhythms Made Simple
| Rhythm | What You See | Key Feature |
|---|---|---|
| Normal sinus rhythm | Regular, P before every QRS, rate 60-100 | All steps look normal |
| Sinus tachycardia | Same but rate > 100 | Fast but organized |
| Sinus bradycardia | Same but rate < 60 | Slow but organized |
| Atrial fibrillation | No P waves, irregular R-R | Irregularly irregular |
| Atrial flutter | "Sawtooth" baseline, rate ~150 | Regular, no true P waves |
| 1st degree heart block | PR interval > 0.20 sec | Prolonged PR, otherwise normal |
| 2nd degree block (Mobitz I) | PR gets longer and longer, then QRS drops | "Wenckebach" pattern |
| 3rd degree (complete) block | P waves and QRS completely unrelated | P and QRS march independently |
| Ventricular tachycardia (VT) | Wide QRS, fast rate > 100, no P waves | Emergency |
| Ventricular fibrillation (VF) | Chaotic, no recognizable waves | Cardiac arrest |
Quick Summary Checklist
When reading any ECG, ask these 6 questions in order:
- Rate - Fast, slow, or normal?
- Rhythm - Regular? P before every QRS?
- Axis - Lead I and aVF both positive?
- Intervals - PR, QRS, and QTc within normal limits?
- P wave - Normal shape and size?
- QRS / ST-T - Any widening, ST changes, or T wave abnormalities?
If all six are normal, the ECG is normal. If any one step is abnormal, that's your finding.
Sources: Guyton & Hall Textbook of Medical Physiology; Goldman-Cecil Medicine; Miller's Anesthesia (10th ed.); Harriet Lane Handbook (23rd ed.)
Create a quick-reference PDF guide of ECG abnormalities for bedside use
Reading File
Reading File
Running Command
ls -la /home/daytona/workspace/ 2>/dev/null || echo "workspace not found"
Running Command
mkdir -p /home/daytona/workspace/ecg-guide && python3 -c "import reportlab; print('reportlab OK')"
Writing File
~/ecg-guide/generate_ecg_guide.py
"""
ECG Quick-Reference Bedside Guide - PDF Generator
Uses reportlab to create a clean, color-coded, print-ready PDF.
"""

from reportlab.lib.pagesizes import A4
from reportlab.lib import colors
from reportlab.lib.units import mm, cm
from reportlab.lib.styles import getSampleStyleSheet, ParagraphStyle
from reportlab.lib.enums import TA_CENTER, TA_LEFT, TA_RIGHT
from reportlab.platypus import (
    SimpleDocTemplate, Paragraph, Spacer, Table, TableStyle,
    HRFlowable, PageBreak, KeepTogether
)
from reportlab.platypus.flowables import Flowable
from reportlab.graphics.shapes import Drawing, Rect, String, Line, Polygon
from reportlab.graphics import renderPDF
from reportlab.graphics.shapes import Drawing, Path
import os

OUTPUT = "/home/daytona/workspace/ecg-guide/ECG_Quick_Reference.pdf"

# ── Colour palette ──────────────────────────────────────────────────────────
RED        = colors.HexColor("#C0392B")
ORANGE     = colors.HexColor("#E67E22")
YELLOW_BG  = colors.HexColor("#FFF9E6")
GREEN      = colors.HexColor("#1E8449")
GREEN_LIGHT= colors.HexColor("#EAF5EA")
BLUE       = colors.HexColor("#1A5276")
BLUE_LIGHT = colors.HexColor("#EBF5FB")
PURPLE     = colors.HexColor("#6C3483")
PURPLE_LIGHT=colors.HexColor("#F5EEF8")
GREY_DARK  = colors.HexColor("#2C3E50")
GREY_MED   = colors.HexColor("#566573")
GREY_LIGHT = colors.HexColor("#F2F3F4")
WHITE      = colors.white
RED_LIGHT  = colors.HexColor("#FDEDEC")
ORANGE_LIGHT=colors.HexColor("#FEF9E7")
TEAL       = colors.HexColor("#117A65")
TEAL_LIGHT = colors.HexColor("#E8F8F5")
HEADER_BG  = colors.HexColor("#1A5276")

PAGE_W, PAGE_H = A4

# ── Styles ───────────────────────────────────────────────────────────────────
base = getSampleStyleSheet()

def S(name, parent="Normal", **kw):
    """Create a named paragraph style."""
    return ParagraphStyle(name, parent=base[parent], **kw)

TITLE_STYLE = S("Title2", "Normal",
    fontSize=22, textColor=WHITE, alignment=TA_CENTER,
    fontName="Helvetica-Bold", spaceAfter=2, leading=26)

SUBTITLE_STYLE = S("Subtitle2", "Normal",
    fontSize=10, textColor=colors.HexColor("#AED6F1"),
    alignment=TA_CENTER, fontName="Helvetica", spaceAfter=4)

SECTION_HEADER = S("SH", "Normal",
    fontSize=11, textColor=WHITE, fontName="Helvetica-Bold",
    alignment=TA_LEFT, leading=14, spaceAfter=4, spaceBefore=6)

CELL_BOLD = S("CB", "Normal",
    fontSize=9, textColor=GREY_DARK, fontName="Helvetica-Bold", leading=12)

CELL_NORMAL = S("CN", "Normal",
    fontSize=8.5, textColor=GREY_DARK, fontName="Helvetica", leading=11)

CELL_RED = S("CR", "Normal",
    fontSize=8.5, textColor=RED, fontName="Helvetica-Bold", leading=11)

CELL_GREEN = S("CG", "Normal",
    fontSize=8.5, textColor=GREEN, fontName="Helvetica-Bold", leading=11)

CELL_BLUE = S("CBL", "Normal",
    fontSize=8.5, textColor=BLUE, fontName="Helvetica-Bold", leading=11)

CELL_ORANGE = S("CO", "Normal",
    fontSize=8.5, textColor=ORANGE, fontName="Helvetica-Bold", leading=11)

CAPTION = S("Cap", "Normal",
    fontSize=7.5, textColor=GREY_MED, fontName="Helvetica-Oblique",
    alignment=TA_CENTER, leading=10)

FOOTNOTE = S("FN", "Normal",
    fontSize=7, textColor=GREY_MED, fontName="Helvetica", leading=9)

MINI_BOLD = S("MB", "Normal",
    fontSize=8, textColor=GREY_DARK, fontName="Helvetica-Bold", leading=10)

MINI_NORMAL = S("MN", "Normal",
    fontSize=8, textColor=GREY_DARK, fontName="Helvetica", leading=10)

ALERT_RED = S("AR", "Normal",
    fontSize=9, textColor=RED, fontName="Helvetica-Bold",
    alignment=TA_CENTER, leading=12)

# ── Helper: coloured section banner ─────────────────────────────────────────
class ColorBanner(Flowable):
    def __init__(self, text, bg_color, text_color=WHITE, height=18, font_size=10):
        Flowable.__init__(self)
        self.text = text
        self.bg = bg_color
        self.tc = text_color
        self.bh = height
        self.fs = font_size
        self.width = PAGE_W - 2*cm

    def draw(self):
        c = self.canv
        c.setFillColor(self.bg)
        c.roundRect(0, 0, self.width, self.bh, 3, fill=1, stroke=0)
        c.setFillColor(self.tc)
        c.setFont("Helvetica-Bold", self.fs)
        c.drawString(6, 4, self.text)

    def wrap(self, availWidth, availHeight):
        self.width = availWidth
        return availWidth, self.bh + 3


# ── ECG waveform sketch ───────────────────────────────────────────────────────
class ECGWaveform(Flowable):
    """Draws a schematic P-QRS-T waveform with labels."""
    def __init__(self, width=160, height=55):
        Flowable.__init__(self)
        self._w = width
        self._h = height

    def wrap(self, aw, ah):
        return self._w, self._h

    def draw(self):
        c = self.canv
        w, h = self._w, self._h
        baseline = h * 0.38

        # Grid lines (light)
        c.setStrokeColor(colors.HexColor("#DDEEFF"))
        c.setLineWidth(0.4)
        for x in range(0, int(w)+1, 10):
            c.line(x, 0, x, h)
        for y in range(0, int(h)+1, 10):
            c.line(0, y, w, y)

        # Waveform path
        c.setStrokeColor(BLUE)
        c.setLineWidth(1.6)
        p = c.beginPath()

        # Isoelectric start
        p.moveTo(0, baseline)
        p.lineTo(18, baseline)

        # P wave (small bump)
        p.curveTo(20, baseline, 22, baseline + 10, 24, baseline + 10)
        p.curveTo(26, baseline + 10, 28, baseline, 30, baseline)

        # PR segment flat
        p.lineTo(40, baseline)

        # Q dip
        p.lineTo(44, baseline - 5)

        # R spike
        p.lineTo(50, baseline + 30)

        # S dip
        p.lineTo(56, baseline - 8)

        # J point / ST segment
        p.lineTo(68, baseline)

        # T wave (smooth hump)
        p.curveTo(72, baseline, 78, baseline + 14, 82, baseline + 14)
        p.curveTo(86, baseline + 14, 92, baseline, 95, baseline)

        # Isoelectric tail
        p.lineTo(w, baseline)

        c.drawPath(p, stroke=1, fill=0)

        # Labels
        c.setFont("Helvetica-Bold", 6.5)
        c.setFillColor(BLUE)
        # P
        c.drawCentredString(24, baseline + 13, "P")
        # Q
        c.drawCentredString(44, baseline - 11, "Q")
        # R
        c.drawCentredString(50, baseline + 33, "R")
        # S
        c.drawCentredString(57, baseline - 13, "S")
        # T
        c.drawCentredString(82, baseline + 17, "T")
        # Baseline arrow label
        c.setFillColor(GREY_MED)
        c.setFont("Helvetica", 6)
        c.drawString(2, baseline + 2, "isoelectric")

        # Brackets for intervals
        c.setStrokeColor(GREY_MED)
        c.setLineWidth(0.6)
        # PR interval bracket
        bry = 4
        c.line(18, bry, 40, bry)
        c.line(18, bry, 18, bry+3)
        c.line(40, bry, 40, bry+3)
        c.setFont("Helvetica", 5.5)
        c.setFillColor(GREY_MED)
        c.drawCentredString(29, bry+4, "PR 0.12-0.20s")

        # QRS bracket
        c.line(40, bry+10, 68, bry+10)
        c.line(40, bry+10, 40, bry+13)
        c.line(68, bry+10, 68, bry+13)
        c.drawCentredString(54, bry+14, "QRS <0.12s")

        # QT bracket
        c.line(40, 1, 95, 1)
        c.line(40, 1, 40, 4)
        c.line(95, 1, 95, 4)


# ── Build document ────────────────────────────────────────────────────────────
def build_pdf():
    doc = SimpleDocTemplate(
        OUTPUT,
        pagesize=A4,
        leftMargin=1*cm, rightMargin=1*cm,
        topMargin=1.2*cm, bottomMargin=1.2*cm,
        title="ECG Quick Reference - Bedside Guide",
        author="Orris Medical"
    )

    story = []

    # ── PAGE 1 ────────────────────────────────────────────────────────────────

    # ── Header banner ─────────────────────────────────────────────────────────
    header_data = [[
        Paragraph("<font color='white' size='18'><b>ECG Quick Reference</b></font><br/>"
                  "<font color='#AED6F1' size='9'>Bedside Guide to ECG Abnormalities</font>",
                  S("H", "Normal", leading=22, alignment=TA_LEFT)),
        Paragraph("<font color='white' size='8'>For clinical use at point of care<br/>"
                  "Always correlate with clinical context</font>",
                  S("H2", "Normal", leading=11, alignment=TA_RIGHT, textColor=WHITE))
    ]]
    header_tbl = Table(header_data, colWidths=[12*cm, 7*cm])
    header_tbl.setStyle(TableStyle([
        ("BACKGROUND", (0,0), (-1,-1), HEADER_BG),
        ("VALIGN", (0,0), (-1,-1), "MIDDLE"),
        ("LEFTPADDING", (0,0), (0,0), 12),
        ("RIGHTPADDING", (-1,-1), (-1,-1), 10),
        ("TOPPADDING", (0,0), (-1,-1), 10),
        ("BOTTOMPADDING", (0,0), (-1,-1), 10),
        ("ROUNDEDCORNERS", [4,4,4,4]),
    ]))
    story.append(header_tbl)
    story.append(Spacer(1, 6))

    # ── Waveform + quick lookup row ───────────────────────────────────────────
    wf_cell = [
        Paragraph("<b>Normal ECG Waveform</b>", CELL_BOLD),
        Spacer(1, 4),
        ECGWaveform(width=170, height=60),
        Spacer(1, 3),
        Paragraph("P=atrial depol. | QRS=ventricular depol. | T=ventricular repol.", CAPTION),
    ]

    intervals_data = [
        [Paragraph("<b>Normal Intervals</b>", MINI_BOLD), ""],
        [Paragraph("PR interval", MINI_NORMAL), Paragraph("<b>0.12 - 0.20 s</b>", MINI_BOLD)],
        [Paragraph("QRS duration", MINI_NORMAL), Paragraph("<b>< 0.12 s</b>", MINI_BOLD)],
        [Paragraph("QTc (Bazett)", MINI_NORMAL), Paragraph("<b>< 0.44 s (M)  < 0.46 s (F)</b>", MINI_BOLD)],
        [Paragraph("P wave height", MINI_NORMAL), Paragraph("<b>< 2.5 mm</b>", MINI_BOLD)],
        [Paragraph("P wave duration", MINI_NORMAL), Paragraph("<b>< 0.12 s</b>", MINI_BOLD)],
        [Paragraph("Normal HR", MINI_NORMAL), Paragraph("<b>60 - 100 bpm</b>", MINI_BOLD)],
    ]
    intervals_tbl = Table(intervals_data, colWidths=[3.8*cm, 4.5*cm])
    intervals_tbl.setStyle(TableStyle([
        ("SPAN", (0,0), (-1,0)),
        ("BACKGROUND", (0,0), (-1,0), BLUE_LIGHT),
        ("BACKGROUND", (0,1), (-1,-1), WHITE),
        ("ROWBACKGROUNDS", (0,1), (-1,-1), [WHITE, GREY_LIGHT]),
        ("BOX", (0,0), (-1,-1), 0.5, colors.HexColor("#BDC3C7")),
        ("INNERGRID", (0,0), (-1,-1), 0.3, colors.HexColor("#BDC3C7")),
        ("TOPPADDING", (0,0), (-1,-1), 3),
        ("BOTTOMPADDING", (0,0), (-1,-1), 3),
        ("LEFTPADDING", (0,0), (-1,-1), 5),
    ]))

    rate_data = [
        [Paragraph("<b>Rate Formula (300 Rule)</b>", MINI_BOLD), ""],
        [Paragraph("R-R = 1 box", MINI_NORMAL), Paragraph("<b>300 bpm</b>", CELL_RED)],
        [Paragraph("R-R = 2 boxes", MINI_NORMAL), Paragraph("<b>150 bpm</b>", CELL_RED)],
        [Paragraph("R-R = 3 boxes", MINI_NORMAL), Paragraph("<b>100 bpm</b>", CELL_ORANGE)],
        [Paragraph("R-R = 4 boxes", MINI_NORMAL), Paragraph("<b>75 bpm</b>", CELL_GREEN)],
        [Paragraph("R-R = 5 boxes", MINI_NORMAL), Paragraph("<b>60 bpm</b>", CELL_GREEN)],
        [Paragraph("R-R = 6 boxes", MINI_NORMAL), Paragraph("<b>50 bpm</b>", CELL_BLUE)],
    ]
    rate_tbl = Table(rate_data, colWidths=[3.8*cm, 2.6*cm])
    rate_tbl.setStyle(TableStyle([
        ("SPAN", (0,0), (-1,0)),
        ("BACKGROUND", (0,0), (-1,0), BLUE_LIGHT),
        ("ROWBACKGROUNDS", (0,1), (-1,-1), [WHITE, GREY_LIGHT]),
        ("BOX", (0,0), (-1,-1), 0.5, colors.HexColor("#BDC3C7")),
        ("INNERGRID", (0,0), (-1,-1), 0.3, colors.HexColor("#BDC3C7")),
        ("TOPPADDING", (0,0), (-1,-1), 3),
        ("BOTTOMPADDING", (0,0), (-1,-1), 3),
        ("LEFTPADDING", (0,0), (-1,-1), 5),
    ]))

    top_row = Table(
        [[wf_cell, intervals_tbl, rate_tbl]],
        colWidths=[7.2*cm, 9*cm, 2.9*cm + 3*mm]  # total ~19.1cm for A4 margins
    )
    top_row.setStyle(TableStyle([
        ("VALIGN", (0,0), (-1,-1), "TOP"),
        ("LEFTPADDING", (0,0), (-1,-1), 4),
        ("RIGHTPADDING", (0,0), (-1,-1), 4),
    ]))
    story.append(top_row)
    story.append(Spacer(1, 5))

    # ── SECTION 1: RHYTHMS ────────────────────────────────────────────────────
    story.append(ColorBanner("1  RHYTHM ABNORMALITIES", BLUE, height=16, font_size=9))
    story.append(Spacer(1, 3))

    rhythm_headers = [
        Paragraph("<b>Rhythm</b>", CELL_BOLD),
        Paragraph("<b>Rate</b>", CELL_BOLD),
        Paragraph("<b>P Waves</b>", CELL_BOLD),
        Paragraph("<b>QRS</b>", CELL_BOLD),
        Paragraph("<b>Key Feature</b>", CELL_BOLD),
        Paragraph("<b>Action</b>", CELL_BOLD),
    ]

    rhythms = [
        ["Sinus Tachycardia", ">100", "Normal, 1:1", "Narrow", "Regular; P before every QRS", "Find cause (pain, fever, hypovolaemia)"],
        ["Sinus Bradycardia", "<60", "Normal, 1:1", "Narrow", "Regular; P before every QRS", "Monitor; atropine if symptomatic"],
        ["Atrial Fibrillation", "Variable", "Absent (wavy baseline)", "Narrow (usually)", "Irregularly irregular R-R", "Rate/rhythm control; anticoagulate"],
        ["Atrial Flutter", "~150", "Sawtooth (F waves)", "Narrow", "Regular; 2:1 or 4:1 block", "Rate control; cardioversion"],
        ["SVT", "150-250", "Hidden in QRS/T", "Narrow", "Abrupt onset/offset", "Vagal manoeuvres; adenosine 6mg IV"],
        ["1st Degree AV Block", "Normal", "Normal", "Narrow", "PR > 0.20 s", "Monitor; usually benign"],
        ["2nd Degree (Mobitz I)", "Normal", "Normal", "Narrow", "PR lengthens, then QRS drops (Wenckebach)", "Monitor; cardiology if symptomatic"],
        ["2nd Degree (Mobitz II)", "Slow", "Normal", "Wide (often)", "Constant PR, sudden QRS drop", "Pacing; high risk of progression"],
        ["3rd Degree (Complete)", "30-60", "P and QRS unrelated", "Wide", "Complete dissociation", "Pacing urgently"],
        ["Ventricular Tachycardia", ">100", "Often hidden", "WIDE > 0.12s", "Monomorphic wide complex", "Amiodarone; DC cardioversion if unstable"],
        ["Ventricular Fibrillation", "N/A", "None", "Chaotic", "No organised activity - cardiac arrest", "CPR + immediate defibrillation"],
        ["Torsades de Pointes", ">200", "None visible", "WIDE, twisting", "Polymorphic VT; long QTc preceding", "Magnesium 2g IV; correct QT triggers"],
    ]

    rhythm_rows = [rhythm_headers]
    for i, r in enumerate(rhythms):
        row_style = CELL_RED if r[0] in ["Ventricular Fibrillation", "Ventricular Tachycardia", "Torsades de Pointes", "3rd Degree (Complete)"] else CELL_NORMAL
        action_style = CELL_RED if r[0] in ["Ventricular Fibrillation", "Ventricular Tachycardia", "Torsades de Pointes", "3rd Degree (Complete)"] else CELL_NORMAL
        rhythm_rows.append([Paragraph(r[0], row_style)] + [Paragraph(x, CELL_NORMAL) for x in r[1:5]] + [Paragraph(r[5], action_style)])

    rhythm_tbl = Table(rhythm_rows, colWidths=[3.4*cm, 1.6*cm, 3.5*cm, 2.2*cm, 5.0*cm, 3.4*cm])
    ts = TableStyle([
        ("BACKGROUND", (0,0), (-1,0), BLUE),
        ("TEXTCOLOR", (0,0), (-1,0), WHITE),
        ("FONTNAME", (0,0), (-1,0), "Helvetica-Bold"),
        ("FONTSIZE", (0,0), (-1,0), 8),
        ("ROWBACKGROUNDS", (0,1), (-1,-1), [WHITE, GREY_LIGHT]),
        ("BACKGROUND", (0,10), (-1,10), RED_LIGHT),   # VF
        ("BACKGROUND", (0,9), (-1,9), RED_LIGHT),    # VT
        ("BACKGROUND", (0,11), (-1,11), RED_LIGHT),  # TdP
        ("BACKGROUND", (0,8), (-1,8), ORANGE_LIGHT), # 3rd degree
        ("BOX", (0,0), (-1,-1), 0.5, colors.HexColor("#BDC3C7")),
        ("INNERGRID", (0,0), (-1,-1), 0.3, colors.HexColor("#D5D8DC")),
        ("TOPPADDING", (0,0), (-1,-1), 3),
        ("BOTTOMPADDING", (0,0), (-1,-1), 3),
        ("LEFTPADDING", (0,0), (-1,-1), 4),
        ("VALIGN", (0,0), (-1,-1), "TOP"),
    ])
    rhythm_tbl.setStyle(ts)
    story.append(rhythm_tbl)
    story.append(Spacer(1, 5))

    # ── SECTION 2: ST CHANGES (ISCHAEMIA) ─────────────────────────────────────
    story.append(ColorBanner("2  ST-SEGMENT & T-WAVE CHANGES  (ISCHAEMIA / INFARCTION)", RED, height=16, font_size=9))
    story.append(Spacer(1, 3))

    st_headers = [
        Paragraph("<b>Finding</b>", CELL_BOLD),
        Paragraph("<b>Definition</b>", CELL_BOLD),
        Paragraph("<b>Leads Involved</b>", CELL_BOLD),
        Paragraph("<b>Diagnosis / Cause</b>", CELL_BOLD),
        Paragraph("<b>Immediate Action</b>", CELL_BOLD),
    ]
    st_rows = [st_headers]
    st_data = [
        ["ST Elevation", ">1mm in limb leads; >2mm in chest leads", "Contiguous leads (territory)", "STEMI - ACS, coronary occlusion", "EMERGENCY: Activate cath lab, aspirin, heparin"],
        ["Diffuse ST Elevation", ">1mm in most leads (concave/saddle)", "All/most leads; PR depression", "Pericarditis", "NSAIDs, colchicine; echo to r/o effusion"],
        ["ST Elevation V1-V4", ">2mm V1-V2; right bundle morphology", "Right precordial leads", "Brugada syndrome", "Avoid Na-channel blockers; electrophysiology referral"],
        ["ST Depression", ">0.5mm horizontal/downsloping", "Any leads", "NSTEMI / Unstable Angina / Ischaemia", "ACS protocol; anticoagulation, troponins serial"],
        ["Reciprocal ST depression", "ST depression opposite to ST elevation", "Mirror of infarct territory", "Confirms STEMI territory", "Supports STEMI diagnosis"],
        ["T wave inversion", "Inverted T in >/=2 contiguous leads", "Anterior, lateral, or inferior", "Ischaemia, PE, LVH strain, Wellens'", "Serial ECGs; troponins; echo"],
        ["Wellens' pattern", "Biphasic (type A) or deep inverted (type B) T in V2-V3", "V2-V3", "Critical LAD stenosis (pre-infarction)", "Urgent cardiology; avoid stress test"],
        ["Hyperacute T waves", "Tall, broad, peaked T waves; early STEMI sign", "Contiguous leads", "Early/hyperacute STEMI", "Serial ECGs q15min; treat as ACS"],
        ["J wave (Osborn wave)", "Positive deflection at J point", "Inferior and lateral leads", "Hypothermia; hypercalcaemia", "Rewarm patient; check calcium"],
    ]
    for r in st_data:
        action_style = CELL_RED if "EMERGENCY" in r[4] or "Urgent" in r[4] else CELL_NORMAL
        st_rows.append([Paragraph(r[0], CELL_BOLD)] + [Paragraph(x, CELL_NORMAL) for x in r[1:4]] + [Paragraph(r[4], action_style)])

    st_tbl = Table(st_rows, colWidths=[3.4*cm, 4.2*cm, 3.6*cm, 4.2*cm, 3.7*cm])
    st_tbl.setStyle(TableStyle([
        ("BACKGROUND", (0,0), (-1,0), RED),
        ("TEXTCOLOR", (0,0), (-1,0), WHITE),
        ("FONTNAME", (0,0), (-1,0), "Helvetica-Bold"),
        ("FONTSIZE", (0,0), (-1,0), 8),
        ("ROWBACKGROUNDS", (0,1), (-1,-1), [WHITE, GREY_LIGHT]),
        ("BACKGROUND", (0,1), (-1,1), RED_LIGHT),   # STEMI row highlight
        ("BOX", (0,0), (-1,-1), 0.5, colors.HexColor("#BDC3C7")),
        ("INNERGRID", (0,0), (-1,-1), 0.3, colors.HexColor("#D5D8DC")),
        ("TOPPADDING", (0,0), (-1,-1), 3),
        ("BOTTOMPADDING", (0,0), (-1,-1), 3),
        ("LEFTPADDING", (0,0), (-1,-1), 4),
        ("VALIGN", (0,0), (-1,-1), "TOP"),
    ]))
    story.append(st_tbl)
    story.append(Spacer(1, 5))

    # ── STEMI Territory Table ─────────────────────────────────────────────────
    story.append(ColorBanner("2a  STEMI TERRITORY LOCALISATION", colors.HexColor("#922B21"), height=15, font_size=8.5))
    story.append(Spacer(1, 3))

    territory_data = [
        [Paragraph("<b>Territory</b>", CELL_BOLD), Paragraph("<b>Leads with ST elevation</b>", CELL_BOLD),
         Paragraph("<b>Artery (usually)</b>", CELL_BOLD), Paragraph("<b>Reciprocal changes in</b>", CELL_BOLD)],
        ["Inferior", "II, III, aVF", "RCA (or LCx)", "I, aVL"],
        ["Anterior", "V1-V4", "LAD", "II, III, aVF (sometimes)"],
        ["Lateral", "I, aVL, V5-V6", "LCx", "II, III, aVF"],
        ["Anterolateral", "I, aVL, V1-V6", "LAD (large) or LCx", "II, III, aVF"],
        ["Posterior*", "Tall R + ST depression V1-V3", "RCA or LCx", "None (mirror image)"],
        ["Right ventricle", "ST elevation in V3R-V4R", "Proximal RCA", "Inferior leads elevated too"],
        ["Septal", "V1-V2", "Septal perforators of LAD", "Variable"],
    ]
    ter_tbl = Table(territory_data, colWidths=[3.0*cm, 4.5*cm, 3.8*cm, 3.8*cm])
    ter_tbl.setStyle(TableStyle([
        ("BACKGROUND", (0,0), (-1,0), colors.HexColor("#922B21")),
        ("TEXTCOLOR", (0,0), (-1,0), WHITE),
        ("FONTNAME", (0,0), (-1,0), "Helvetica-Bold"),
        ("FONTSIZE", (0,0), (-1,0), 8),
        ("ROWBACKGROUNDS", (0,1), (-1,-1), [WHITE, GREY_LIGHT]),
        ("BOX", (0,0), (-1,-1), 0.5, colors.HexColor("#BDC3C7")),
        ("INNERGRID", (0,0), (-1,-1), 0.3, colors.HexColor("#D5D8DC")),
        ("FONTSIZE", (0,1), (-1,-1), 8),
        ("FONTNAME", (0,1), (-1,-1), "Helvetica"),
        ("TOPPADDING", (0,0), (-1,-1), 3),
        ("BOTTOMPADDING", (0,0), (-1,-1), 3),
        ("LEFTPADDING", (0,0), (-1,-1), 5),
    ]))
    story.append(ter_tbl)
    story.append(Paragraph("* Posterior STEMI: apply V7-V9 leads to confirm; ST elevation in posterior leads confirms.", FOOTNOTE))
    story.append(Spacer(1, 5))

    # ── PAGE BREAK ────────────────────────────────────────────────────────────
    story.append(PageBreak())

    # ── PAGE 2 MINI-HEADER ────────────────────────────────────────────────────
    story.append(Paragraph(
        "<font color='white'><b>ECG Quick Reference  |  Page 2</b></font>",
        S("PH", "Normal", fontSize=8, textColor=WHITE, alignment=TA_RIGHT,
          backColor=HEADER_BG, leading=12, spaceBefore=0, spaceAfter=4,
          leftPadding=6, rightPadding=6, topPadding=3, bottomPadding=3)
    ))
    story.append(Spacer(1, 4))

    # ── SECTION 3: CONDUCTION ABNORMALITIES ───────────────────────────────────
    story.append(ColorBanner("3  CONDUCTION ABNORMALITIES", PURPLE, height=16, font_size=9))
    story.append(Spacer(1, 3))

    cond_headers = [
        Paragraph("<b>Abnormality</b>", CELL_BOLD),
        Paragraph("<b>QRS Width</b>", CELL_BOLD),
        Paragraph("<b>Key ECG Features</b>", CELL_BOLD),
        Paragraph("<b>Clinical Significance</b>", CELL_BOLD),
    ]
    cond_data = [
        ["LBBB (Left Bundle Branch Block)", "WIDE > 0.12s", "Broad notched R in I, V5-V6 ('M' shape); deep S in V1; no septal Q in I", "New LBBB = treat as STEMI equivalent. Old LBBB: use Sgarbossa criteria"],
        ["RBBB (Right Bundle Branch Block)", "WIDE > 0.12s", "RSR' in V1 ('M' shape); broad S in I, V5-V6 ('W'); normal septal Q", "New RBBB: suspect PE or anterior MI. Isolated RBBB often benign"],
        ["Left Anterior Fascicular Block (LAFB)", "Normal", "Left axis deviation; small Q in I, aVL; small R in II, III, aVF", "May indicate structural heart disease; benign alone"],
        ["Left Posterior Fascicular Block (LPFB)", "Normal", "Right axis deviation; small R in I, aVL; small Q in II, III, aVF", "Rare; r/o RVH, PE, lateral MI first"],
        ["Bifascicular block", "WIDE", "RBBB + LAFB (left axis) or RBBB + LPFB (right axis)", "High risk of progression to complete heart block; consider pacing"],
        ["Pre-excitation (WPW)", "Normal/borderline", "Short PR < 0.12s; delta wave (slurred upstroke); wide QRS", "Accessory pathway; avoid AV nodal agents in AF/flutter; ablation"],
        ["Incomplete RBBB", "0.10-0.12s", "RSR' in V1 but QRS < 0.12s", "Often normal variant (young, athletes); evaluate in context"],
    ]
    cond_rows = [cond_headers]
    for r in cond_data:
        cond_rows.append([Paragraph(r[0], CELL_BOLD), Paragraph(r[1], CELL_NORMAL),
                          Paragraph(r[2], CELL_NORMAL), Paragraph(r[3], CELL_NORMAL)])

    cond_tbl = Table(cond_rows, colWidths=[4.5*cm, 2.5*cm, 6.5*cm, 5.6*cm])
    cond_tbl.setStyle(TableStyle([
        ("BACKGROUND", (0,0), (-1,0), PURPLE),
        ("TEXTCOLOR", (0,0), (-1,0), WHITE),
        ("FONTNAME", (0,0), (-1,0), "Helvetica-Bold"),
        ("FONTSIZE", (0,0), (-1,0), 8),
        ("ROWBACKGROUNDS", (0,1), (-1,-1), [WHITE, PURPLE_LIGHT]),
        ("BOX", (0,0), (-1,-1), 0.5, colors.HexColor("#BDC3C7")),
        ("INNERGRID", (0,0), (-1,-1), 0.3, colors.HexColor("#D5D8DC")),
        ("TOPPADDING", (0,0), (-1,-1), 3),
        ("BOTTOMPADDING", (0,0), (-1,-1), 3),
        ("LEFTPADDING", (0,0), (-1,-1), 4),
        ("VALIGN", (0,0), (-1,-1), "TOP"),
        ("FONTSIZE", (0,1), (-1,-1), 8),
    ]))
    story.append(cond_tbl)
    story.append(Spacer(1, 5))

    # ── SECTION 4: ELECTROLYTE / METABOLIC ───────────────────────────────────
    story.append(ColorBanner("4  ELECTROLYTE & METABOLIC CHANGES", TEAL, height=16, font_size=9))
    story.append(Spacer(1, 3))

    elec_headers = [
        Paragraph("<b>Condition</b>", CELL_BOLD),
        Paragraph("<b>ECG Changes (in order of severity)</b>", CELL_BOLD),
        Paragraph("<b>Key Sign / Mnemonic</b>", CELL_BOLD),
        Paragraph("<b>Action</b>", CELL_BOLD),
    ]
    elec_data = [
        ["Hyperkalaemia", "Tall peaked T waves (K+>5.5) → flat P wave, widened QRS (K+>7) → sine wave, VF (K+>9)", "Peaked T = first sign; sine wave = pre-arrest", "IV calcium gluconate, insulin/dextrose, salbutamol, kayexalate, dialysis"],
        ["Hypokalaemia", "Flat/inverted T, prominent U wave (may merge with T), ST depression, wide QRS in severe", "Prominent U wave (after T) in V2-V3", "IV/PO KCl replacement; correct Mg2+"],
        ["Hypercalcaemia", "Short QT interval, shortened ST segment, wide T wave, PR prolongation", "Short QT + short ST = hypercalcaemia", "IV fluids, furosemide, bisphosphonates; treat cause"],
        ["Hypocalcaemia", "Prolonged QT (long ST segment specifically); no change in T wave morphology", "Long QT with normal T wave shape", "IV calcium gluconate; replete Mg, Vit D"],
        ["Hypermagnesaemia", "PR prolongation, widened QRS, tall peaked T; may resemble hyperkalaemia", "Seen in preeclampsia treatment", "Stop Mg infusion; IV calcium gluconate"],
        ["Hypomagnesaemia", "Prolonged QT, flat T waves, prominent U waves; predisposes to Torsades", "Triggers Torsades de Pointes", "IV MgSO4 2g; replace K+ simultaneously"],
        ["Hypothermia", "Bradycardia, Osborn (J) waves, prolonged PR/QRS/QT, AF, VF risk", "Osborn J wave at J point = pathognomonic", "Rewarm; handle patient gently (VF risk)"],
        ["Digoxin toxicity", "Scooping of ST segment ('Salvador Dali moustache'), short QT, bradycardia, heart block", "Downsloping ST depression - therapeutic; dysrhythmia = toxic", "Check digoxin level; digibind if severe"],
    ]
    elec_rows = [elec_headers]
    for r in elec_data:
        elec_rows.append([Paragraph(r[0], CELL_BOLD)] + [Paragraph(x, CELL_NORMAL) for x in r[1:]])

    elec_tbl = Table(elec_rows, colWidths=[3.8*cm, 6.5*cm, 4.0*cm, 4.8*cm])
    elec_tbl.setStyle(TableStyle([
        ("BACKGROUND", (0,0), (-1,0), TEAL),
        ("TEXTCOLOR", (0,0), (-1,0), WHITE),
        ("FONTNAME", (0,0), (-1,0), "Helvetica-Bold"),
        ("FONTSIZE", (0,0), (-1,0), 8),
        ("ROWBACKGROUNDS", (0,1), (-1,-1), [WHITE, TEAL_LIGHT]),
        ("BOX", (0,0), (-1,-1), 0.5, colors.HexColor("#BDC3C7")),
        ("INNERGRID", (0,0), (-1,-1), 0.3, colors.HexColor("#D5D8DC")),
        ("TOPPADDING", (0,0), (-1,-1), 3),
        ("BOTTOMPADDING", (0,0), (-1,-1), 3),
        ("LEFTPADDING", (0,0), (-1,-1), 4),
        ("VALIGN", (0,0), (-1,-1), "TOP"),
        ("FONTSIZE", (0,1), (-1,-1), 8),
    ]))
    story.append(elec_tbl)
    story.append(Spacer(1, 5))

    # ── SECTION 5: HYPERTROPHY ────────────────────────────────────────────────
    story.append(ColorBanner("5  CHAMBER ENLARGEMENT & HYPERTROPHY", ORANGE, height=16, font_size=9))
    story.append(Spacer(1, 3))

    hyp_headers = [
        Paragraph("<b>Condition</b>", CELL_BOLD),
        Paragraph("<b>ECG Criteria</b>", CELL_BOLD),
        Paragraph("<b>Associated Findings</b>", CELL_BOLD),
        Paragraph("<b>Clinical Cause</b>", CELL_BOLD),
    ]
    hyp_data = [
        ["LVH (Left Ventricular Hypertrophy)",
         "Sokolow-Lyon: SV1 + RV5/V6 > 35mm\nCornell: RaVL + SV3 > 28mm (M) / 20mm (F)",
         "ST depression + T inversion in V5-V6 (strain pattern); axis deviation",
         "Hypertension, aortic stenosis, HCM"],
        ["RVH (Right Ventricular Hypertrophy)",
         "Dominant R in V1 (R > S); right axis deviation; S wave in V5-V6",
         "ST depression V1-V3; P pulmonale",
         "Pulmonary hypertension, mitral stenosis, cor pulmonale, PE"],
        ["LAE (Left Atrial Enlargement)",
         "P mitrale: broad, notched P (> 0.12s) in II; biphasic P in V1 (negative terminal component)",
         "Bifid P wave in lead II",
         "Mitral stenosis/regurgitation, LVH, heart failure"],
        ["RAE (Right Atrial Enlargement)",
         "P pulmonale: tall peaked P (> 2.5mm) in II, III, aVF",
         "Tall P wave in inferior leads",
         "COPD, pulmonary hypertension, tricuspid disease"],
    ]
    hyp_rows = [hyp_headers]
    for r in hyp_data:
        hyp_rows.append([Paragraph(r[0], CELL_BOLD)] + [Paragraph(x, CELL_NORMAL) for x in r[1:]])

    hyp_tbl = Table(hyp_rows, colWidths=[4.2*cm, 5.8*cm, 4.5*cm, 4.6*cm])
    hyp_tbl.setStyle(TableStyle([
        ("BACKGROUND", (0,0), (-1,0), ORANGE),
        ("TEXTCOLOR", (0,0), (-1,0), WHITE),
        ("FONTNAME", (0,0), (-1,0), "Helvetica-Bold"),
        ("FONTSIZE", (0,0), (-1,0), 8),
        ("ROWBACKGROUNDS", (0,1), (-1,-1), [WHITE, ORANGE_LIGHT]),
        ("BOX", (0,0), (-1,-1), 0.5, colors.HexColor("#BDC3C7")),
        ("INNERGRID", (0,0), (-1,-1), 0.3, colors.HexColor("#D5D8DC")),
        ("TOPPADDING", (0,0), (-1,-1), 3),
        ("BOTTOMPADDING", (0,0), (-1,-1), 3),
        ("LEFTPADDING", (0,0), (-1,-1), 4),
        ("VALIGN", (0,0), (-1,-1), "TOP"),
        ("FONTSIZE", (0,1), (-1,-1), 8),
    ]))
    story.append(hyp_tbl)
    story.append(Spacer(1, 5))

    # ── SECTION 6: MISCELLANEOUS PATTERNS ─────────────────────────────────────
    story.append(ColorBanner("6  MISCELLANEOUS PATTERNS", GREEN, height=16, font_size=9))
    story.append(Spacer(1, 3))

    misc_data = [
        [Paragraph("<b>Pattern</b>", CELL_BOLD), Paragraph("<b>ECG Finding</b>", CELL_BOLD),
         Paragraph("<b>Diagnosis</b>", CELL_BOLD), Paragraph("<b>Action</b>", CELL_BOLD)],
        ["Saddle-shaped ST elevation (all leads)", "Diffuse ST up, PR depression, no reciprocal changes", "Pericarditis", "NSAIDs + colchicine; echo"],
        ["Electrical alternans", "Beat-to-beat alternating QRS amplitude/axis", "Cardiac tamponade", "EMERGENCY: Pericardiocentesis"],
        ["S1Q3T3 pattern", "Large S wave I, Q wave III, inverted T III", "Pulmonary embolism (classic but not sensitive)", "CT pulmonary angiogram; anticoagulate"],
        ["Sinus arrest / pause", "No P wave; long pause > 2x normal P-P interval", "SA node dysfunction / sick sinus syndrome", "Pacing if symptomatic"],
        ["Low voltage ECG", "All QRS amplitudes < 5mm in limb leads AND < 10mm in precordial", "Effusion, obesity, COPD, hypothyroidism, infiltrative disease", "Echo; treat cause"],
        ["LQTS (Long QT)", "QTc > 0.44s (M) / 0.46s (F); predisposes to TdP", "Congenital, drugs (quinolones, macrolides, antipsychotics), electrolytes", "Stop causative drugs; magnesium; consider beta-blocker / ICD"],
        ["SQTS (Short QT)", "QTc < 0.33s; tall peaked T waves, short ST", "Congenital; hypercalcaemia, digoxin", "Cardiology referral; ICD if congenital"],
        ["Epsilon wave", "Small positive deflection after QRS in V1-V3", "Arrhythmogenic RV Cardiomyopathy (ARVC)", "Cardiology; echo/MRI; ICD"],
        ["Early repolarisation", "J-point elevation with notch/slur at end of QRS; ST concave up", "Often benign (athletes); rarely arrhythmic in inferior leads", "Assess clinical context; consider Holter"],
        ["Dextrocardia", "Inverted P and QRS in lead I; decreasing R-wave V1-V6", "Dextrocardia (or lead reversal)", "Check arm leads reversal first; CXR"],
    ]
    misc_rows = []
    for i, r in enumerate(misc_data):
        if i == 0:
            misc_rows.append(r)
        else:
            action_style = CELL_RED if "EMERGENCY" in r[3] else CELL_NORMAL
            misc_rows.append([Paragraph(r[0], CELL_BOLD)] + [Paragraph(x, CELL_NORMAL) for x in r[1:3]] + [Paragraph(r[3], action_style)])

    misc_tbl = Table(misc_rows, colWidths=[4.5*cm, 5.5*cm, 4.2*cm, 4.9*cm])
    misc_tbl.setStyle(TableStyle([
        ("BACKGROUND", (0,0), (-1,0), GREEN),
        ("TEXTCOLOR", (0,0), (-1,0), WHITE),
        ("FONTNAME", (0,0), (-1,0), "Helvetica-Bold"),
        ("FONTSIZE", (0,0), (-1,0), 8),
        ("ROWBACKGROUNDS", (0,1), (-1,-1), [WHITE, GREEN_LIGHT]),
        ("BACKGROUND", (0,2), (-1,2), RED_LIGHT),  # Tamponade
        ("BOX", (0,0), (-1,-1), 0.5, colors.HexColor("#BDC3C7")),
        ("INNERGRID", (0,0), (-1,-1), 0.3, colors.HexColor("#D5D8DC")),
        ("TOPPADDING", (0,0), (-1,-1), 3),
        ("BOTTOMPADDING", (0,0), (-1,-1), 3),
        ("LEFTPADDING", (0,0), (-1,-1), 4),
        ("VALIGN", (0,0), (-1,-1), "TOP"),
        ("FONTSIZE", (0,1), (-1,-1), 8),
    ]))
    story.append(misc_tbl)
    story.append(Spacer(1, 5))

    # ── SECTION 7: SYSTEMATIC READING CHECKLIST ───────────────────────────────
    story.append(ColorBanner("7  SYSTEMATIC READING CHECKLIST", GREY_DARK, height=16, font_size=9))
    story.append(Spacer(1, 3))

    checklist_data = [
        ["STEP", "ASK", "NORMAL", "ABNORMAL = THINK"],
        ["1. RATE", "Boxes between R waves?", "60-100 bpm", "Tachy >100 / Brady <60"],
        ["2. RHYTHM", "Regular? P before every QRS?", "Sinus: regular, P:QRS = 1:1", "Irregular = AF, ectopics, block"],
        ["3. AXIS", "Leads I and aVF both positive?", "Both positive = normal (0 to +90)", "LAD: I(+) aVF(-) | RAD: I(-) aVF(+)"],
        ["4. P WAVE", "Shape, size, duration?", "Rounded, <2.5mm, <0.12s", "Tall=RAE | Broad/notched=LAE | Absent=AF"],
        ["5. PR INTERVAL", "Length from P start to QRS start?", "0.12-0.20s (3-5 small boxes)", "Long=heart block | Short=WPW"],
        ["6. QRS DURATION", "Is QRS narrow or wide?", "<0.12s (3 small boxes)", "Wide: BBB, VT, hyperkalaemia, drugs"],
        ["7. QRS MORPHOLOGY", "Q waves? R progression V1-V6?", "No pathological Q; R grows V1-V6", "Path Q=infarct | Poor R prog=anterior MI"],
        ["8. ST SEGMENT", "Above or below baseline?", "On isoelectric line (J point)", "Elevation=STEMI/pericarditis | Depression=ischaemia"],
        ["9. T WAVES", "Upright? Symmetrical?", "Upright in most leads; asymmetric", "Inversion=ischaemia | Peaked=hyperkalaemia"],
        ["10. QT INTERVAL", "QTc using Bazett formula?", "M <0.44s | F <0.46s", "Long QT=drugs, electrolytes, congenital"],
        ["11. U WAVES", "Small hump after T wave?", "Absent or small in V2-V3", "Prominent U=hypokalaemia/hypomagnesaemia"],
    ]

    checklist_rows = []
    for i, row in enumerate(checklist_data):
        if i == 0:
            checklist_rows.append([Paragraph(f"<b>{x}</b>", CELL_BOLD) for x in row])
        else:
            checklist_rows.append([
                Paragraph(row[0], CELL_BOLD),
                Paragraph(row[1], CELL_NORMAL),
                Paragraph(row[2], CELL_GREEN),
                Paragraph(row[3], CELL_RED),
            ])

    checklist_tbl = Table(checklist_rows, colWidths=[3.5*cm, 4.8*cm, 4.4*cm, 6.4*cm])
    checklist_tbl.setStyle(TableStyle([
        ("BACKGROUND", (0,0), (-1,0), GREY_DARK),
        ("TEXTCOLOR", (0,0), (-1,0), WHITE),
        ("FONTNAME", (0,0), (-1,0), "Helvetica-Bold"),
        ("FONTSIZE", (0,0), (-1,0), 8),
        ("ROWBACKGROUNDS", (0,1), (-1,-1), [WHITE, GREY_LIGHT]),
        ("BOX", (0,0), (-1,-1), 0.5, colors.HexColor("#BDC3C7")),
        ("INNERGRID", (0,0), (-1,-1), 0.3, colors.HexColor("#D5D8DC")),
        ("TOPPADDING", (0,0), (-1,-1), 3),
        ("BOTTOMPADDING", (0,0), (-1,-1), 3),
        ("LEFTPADDING", (0,0), (-1,-1), 4),
        ("VALIGN", (0,0), (-1,-1), "TOP"),
        ("FONTSIZE", (0,1), (-1,-1), 8),
    ]))
    story.append(checklist_tbl)
    story.append(Spacer(1, 4))

    # ── Footer ─────────────────────────────────────────────────────────────────
    story.append(HRFlowable(width="100%", thickness=0.5, color=GREY_MED))
    story.append(Spacer(1, 3))
    footer_data = [[
        Paragraph("Sources: Guyton & Hall Medical Physiology | Goldman-Cecil Medicine | "
                  "Miller's Anesthesia 10e | Harriet Lane Handbook 23e | Braunwald's Heart Disease",
                  FOOTNOTE),
        Paragraph("Orris Medical  |  For educational use. Always verify with senior clinician.",
                  S("FNR", "Normal", fontSize=7, textColor=GREY_MED,
                    fontName="Helvetica-Oblique", alignment=TA_RIGHT, leading=9))
    ]]
    footer_tbl = Table(footer_data, colWidths=[12*cm, 7.1*cm])
    footer_tbl.setStyle(TableStyle([("VALIGN", (0,0), (-1,-1), "TOP")]))
    story.append(footer_tbl)

    # ── Build ─────────────────────────────────────────────────────────────────
    doc.build(story)
    print(f"PDF saved: {OUTPUT}")


if __name__ == "__main__":
    build_pdf()
Running Command
cd /home/daytona/workspace/ecg-guide && python3 generate_ecg_guide.py 2>&1
Running Command
ls -lh /home/daytona/workspace/ecg-guide/ECG_Quick_Reference.pdf
The PDF is generated and ready. Here's your download:
ECG Quick Reference
PDF Document · PDF
Here's what's inside the 2-page A4 guide:
Page 1
- Schematic ECG waveform (P-QRS-T) with labelled intervals drawn from scratch
- Normal intervals reference table (PR, QRS, QTc, P wave)
- 300-rule quick heart rate calculator
- Section 1 - Rhythms: 12 rhythm abnormalities (sinus tachy/brady, AF, flutter, SVT, all degrees of heart block, VT, VF, Torsades) - color-coded red for life-threatening ones
- Section 2 - ST/T changes: 9 patterns including STEMI, pericarditis, Brugada, Wellens', Osborn waves
- Section 2a - STEMI territory localisation: 8 territories with culprit artery and reciprocal leads
Page 2
- Section 3 - Conduction: LBBB, RBBB, LAFB, LPFB, bifascicular block, WPW
- Section 4 - Electrolytes/metabolic: Hyperkalaemia, hypokalaemia, hypo/hypercalcaemia, hypo/hypermagnesaemia, hypothermia, digoxin toxicity
- Section 5 - Chamber enlargement: LVH (Sokolow-Lyon + Cornell criteria), RVH, LAE, RAE
- Section 6 - Miscellaneous: Pericarditis, tamponade, PE (S1Q3T3), low voltage, long/short QT, epsilon wave, early repolarisation, dextrocardia
- Section 7 - Systematic 11-step checklist: Rate to U waves with normal vs. abnormal at a glance
This is a shared conversation. Sign in to Orris to start your own chat.