
Teach me about Ecg in detail
Reading File
Now let me search the medical library for ECG content across multiple angles simultaneously.
Finding Sources
Finding Sources
Reading File
Finding Sources
Finding Sources
Reading File
Finding Sources
Finding Sources
Reading File
Reading File
Reading File
Reading File
Finding Sources
Loading Image
Loading Image
Finding Sources
I now have comprehensive material from multiple authoritative textbooks. Let me compile the detailed ECG guide.
Electrocardiogram (ECG) - A Complete Guide
What Is an ECG?
An ECG (electrocardiogram) is a non-invasive recording of the electrical activity of the heart at the body surface. It measures differences in electrical potential generated at multiple recording sites as electrical impulses travel through the heart's conduction system and myocardium. It provides direct measurement of rate, rhythm, and the time-dependent electrical vector of the heart.
- Miller's Anesthesia, 10e
- Medical Physiology (Boron & Boulpaep)
1. The Cardiac Conduction System (The Basis of the ECG)
The ECG reflects the ordered sequence of electrical activation:
| Step | Event | ECG Representation |
|---|---|---|
| SA node fires | Sinoatrial node initiates the impulse | Start of P wave |
| Atrial depolarization | Spreads through both atria via internodal tracts | P wave |
| AV node delay | Slow conduction at the AV junction | PR interval |
| His bundle → Bundle branches → Purkinje fibers | Rapid ventricular activation | QRS complex |
| Ventricular repolarization | Recovery of ventricles | T wave |
The AV node is a zone of deliberate slow conduction - this delay allows the atria to fully contract ("atrial kick") before ventricular systole begins. The PR interval represents this delay.
2. The ECG Waves and Intervals - In Detail
ECG Paper
- Small boxes: 1 mm wide = 0.04 seconds (horizontal); 0.1 mV (vertical)
- Large boxes: 5 mm wide = 0.20 seconds
- Standard paper speed: 25 mm/sec
The Waves
P Wave
- Represents atrial depolarization (both right and left atria)
- Normal duration: < 0.12 sec (3 small boxes)
- Normal amplitude: < 2.5 mm
- Should be upright in leads I, II, aVF; inverted in aVR
QRS Complex
- Represents ventricular depolarization
- Normal duration: 0.06-0.10 sec (< 3 small boxes)
- Q wave = initial negative deflection; R wave = positive deflection; S wave = negative deflection after R
- Abnormal Q waves (> 0.04 sec wide, > 25% of R height) indicate prior infarction
T Wave
- Represents ventricular repolarization
- Normally upright in most leads (inverted in aVR normally)
- Inverted T waves or peaked T waves carry clinical significance
U Wave
- Small, rounded wave after the T wave
- Best seen in V2-V3
- Prominent in hypokalemia
The Intervals and Segments
| Measurement | Normal Range | Significance |
|---|---|---|
| PR interval | 0.12-0.20 sec (3-5 small boxes) | AV conduction time; prolonged = heart block |
| QRS duration | 0.06-0.10 sec | Ventricular conduction; wide = BBB or aberrancy |
| QT interval | Varies with rate (QTc < 0.44 sec) | Ventricular action potential duration |
| ST segment | Isoelectric (flat) | Displacement = ischemia or injury |
Quick rate calculation: Count the number of large boxes in the R-R interval and divide 300 by that number.
- 1 large box = 300 bpm
- 2 large boxes = 150 bpm
- 3 large boxes = 100 bpm
- 4 large boxes = 75 bpm
- 5 large boxes = 60 bpm
- 6 large boxes = 50 bpm
The diagram below shows the ECG in context with the full cardiac cycle:
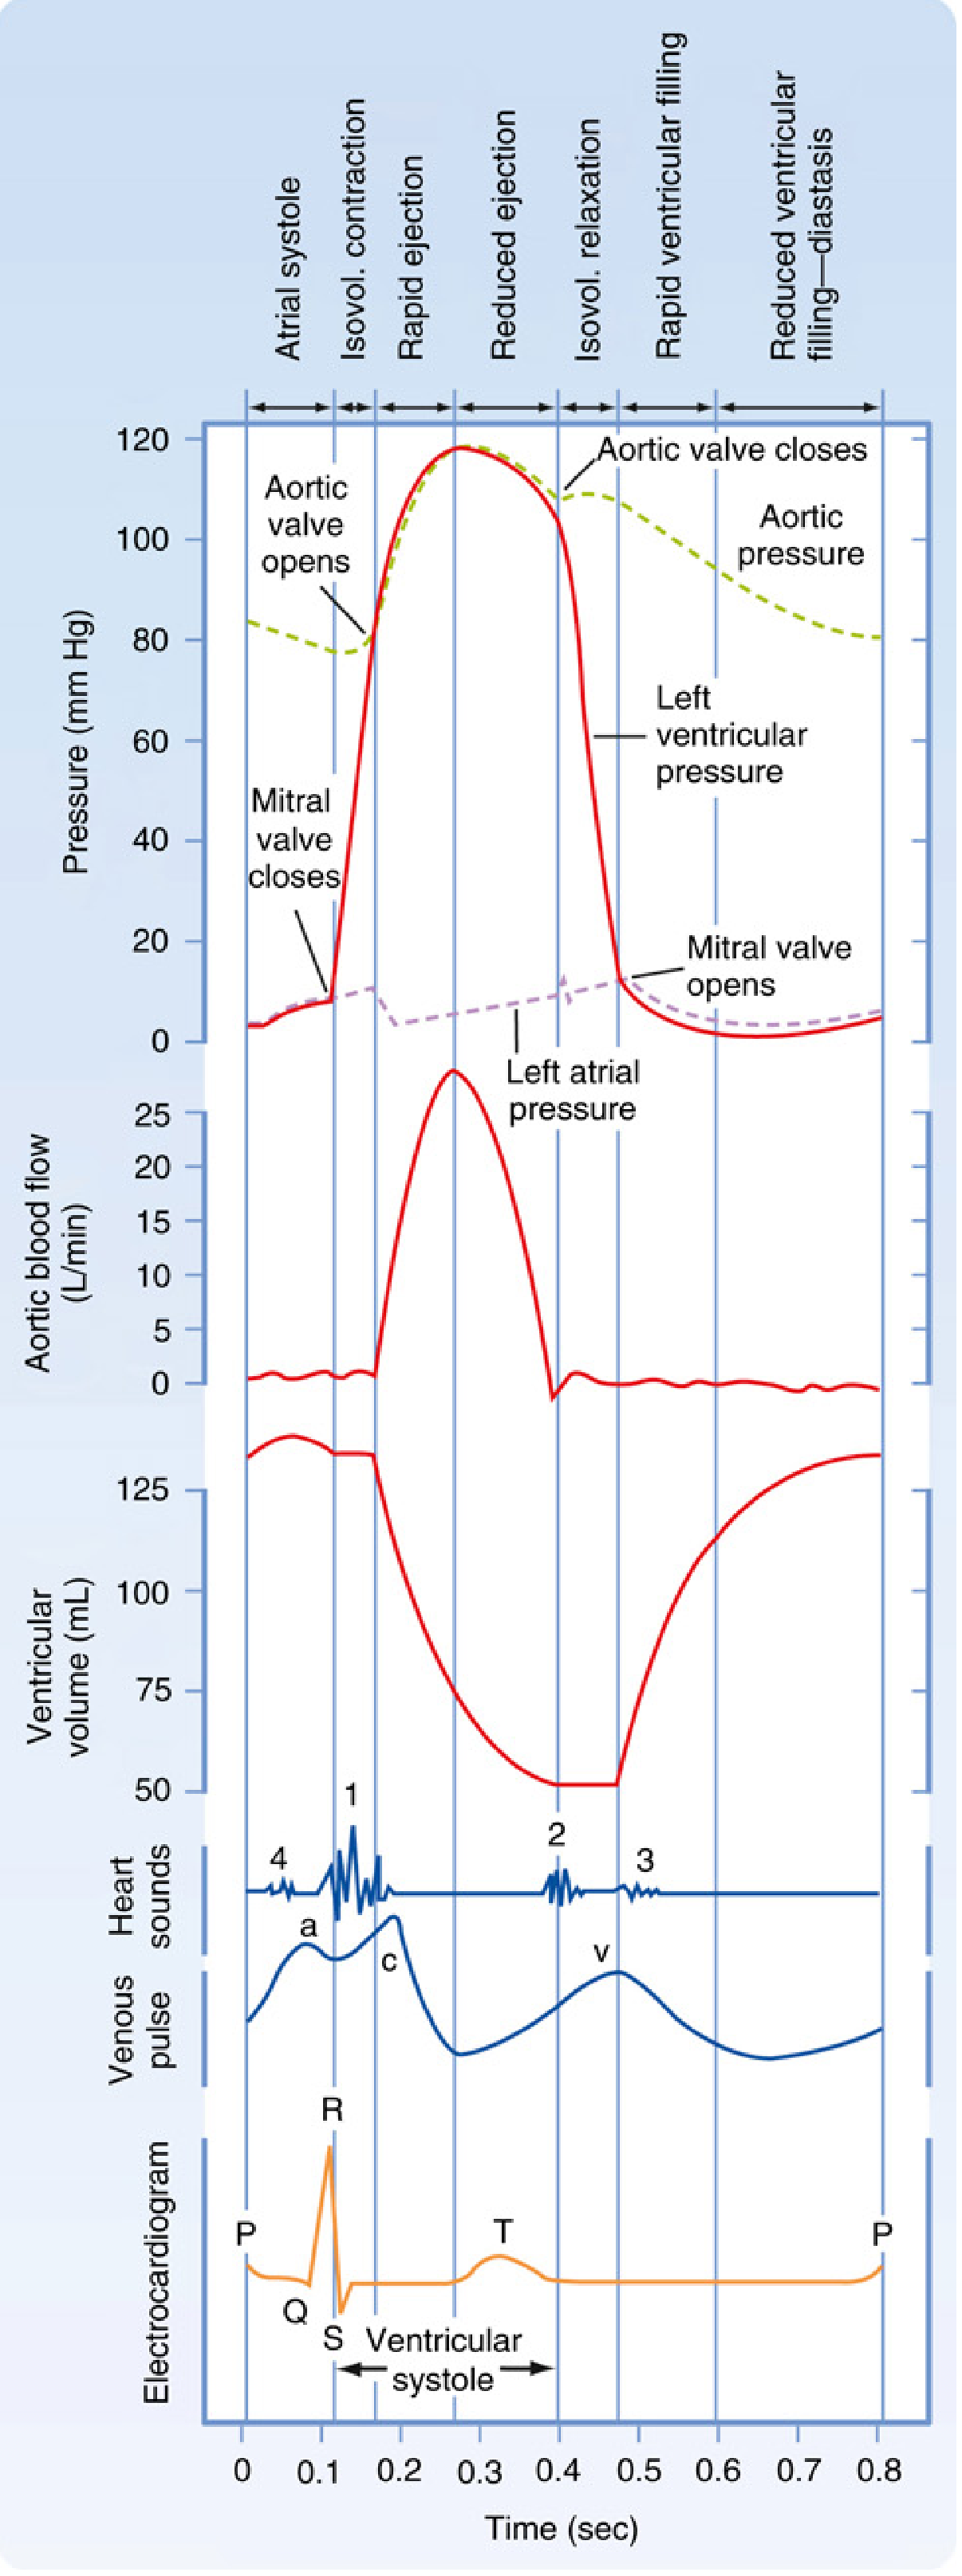
P wave coincides with atrial systole; QRS with the start of ventricular contraction; T wave with ventricular repolarization - Miller's Anesthesia, 10e
3. The 12 Leads - What They Look At
A standard 12-lead ECG uses 10 electrodes to generate 12 different "views" of the heart.
Limb Leads (Frontal Plane)
| Lead | What It "Sees" |
|---|---|
| I | Lateral wall (left side) |
| II | Inferior wall |
| III | Inferior wall |
| aVR | Right side of heart (normally negative) |
| aVL | High lateral wall |
| aVF | Inferior wall |
Precordial (Chest) Leads (Horizontal Plane)
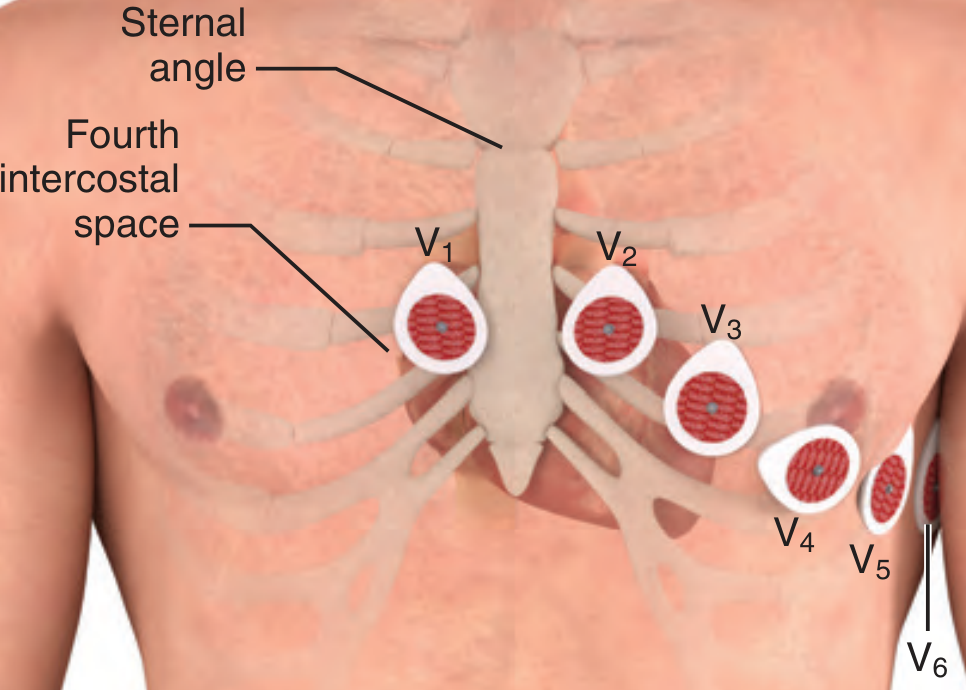
Correct electrode positions - Roberts and Hedges' Clinical Procedures in Emergency Medicine
Exact placement:
- V1 - Right sternal border, 4th intercostal space
- V2 - Left sternal border, 4th intercostal space
- V3 - Midway between V2 and V4
- V4 - Left midclavicular line, 5th intercostal space
- V5 - Left anterior axillary line, same horizontal level as V4
- V6 - Left midaxillary line, same horizontal level as V4 and V5
V4-V6 must remain on the same horizontal level, not following the rib contour.
To locate the 4th intercostal space: palpate the sternal angle (angle of Louis), which is the manubriosternal junction ~5 cm below the sternal notch. Immediately lateral and inferior is the 2nd intercostal space; two spaces lower is the 4th.
4. The Electrical Axis
The normal QRS axis in the frontal plane is -30 to +90 degrees.
| Axis | Range | Cause |
|---|---|---|
| Normal | -30° to +90° | - |
| Left axis deviation (LAD) | -30° to -90° | LVH, LBBB, left anterior hemiblock |
| Right axis deviation (RAD) | +90° to +180° | RVH, RBBB, left posterior hemiblock |
| Extreme/indeterminate | -90° to +180° | Severe ventricular disease |
Quick axis check: If QRS is positive in leads I and aVF, axis is normal. If positive in I but negative in aVF, suspect LAD.
5. Systematic Approach to Reading an ECG
Use this structured approach every time:
- Rate - Calculate using R-R interval method (300 / number of large boxes)
- Rhythm - Regular or irregular? Is every P followed by a QRS?
- P waves - Present? Upright in II? One before every QRS?
- PR interval - Normal 0.12-0.20 sec?
- QRS duration - Normal < 0.10 sec? Wide = bundle branch block
- Axis - Normal, LAD, or RAD?
- ST segments - Elevated, depressed, or flat?
- T waves - Upright, inverted, peaked?
- QT interval - Corrected for rate?
- Overall interpretation - Put it all together
6. Pathological ECG Patterns
A. Heart Blocks (AV Conduction Disturbances)
| Block | ECG Finding |
|---|---|
| 1st degree AV block | PR interval > 0.20 sec (> 1 large box); every P conducted |
| 2nd degree - Mobitz I (Wenckebach) | Progressive PR lengthening until a P wave is not conducted (dropped QRS) |
| 2nd degree - Mobitz II | Fixed PR interval; sudden dropped QRS without warning; PR intervals remain unchanged before the non-conducted P wave |
| 3rd degree (complete) heart block | P waves and QRS completely dissociated; P rate > QRS rate |
Mobitz type II block, especially with bundle branch block, often precedes progression to complete heart block and requires urgent attention.
B. Bundle Branch Blocks
Right Bundle Branch Block (RBBB)
- QRS > 0.12 sec
- rSR' pattern ("M-shaped") in V1
- Wide S wave in V6 and lead I
Left Bundle Branch Block (LBBB)
- QRS > 0.12 sec
- Broad notched R wave in V5, V6, I, aVL (no septal Q waves)
- New LBBB in the setting of chest pain = treat as STEMI equivalent
C. Myocardial Infarction
Three pathophysiological changes drive ECG changes in acute MI:
| Defect in Infarcted Cells | Current Flow | ECG Change |
|---|---|---|
| Rapid repolarization | Out of infarct | ST segment elevation |
| Decreased resting membrane potential | Into infarct | TQ segment depression (manifests as ST elevation) |
| Delayed depolarization | Out of infarct | ST segment elevation |
Evolution of MI on ECG (over hours to days):
- Hyperacute T waves (tall, peaked) - first minutes
- ST elevation in leads overlying the infarct - early hours
- Q wave development - hours to days
- T wave inversion
- ST returns to baseline; Q waves may persist permanently
Leads on the opposite side of the heart show ST depression (reciprocal changes).
Localizing the infarct:
| Leads with ST elevation | Territory | Artery |
|---|---|---|
| II, III, aVF | Inferior | Right coronary artery (RCA) |
| V1-V4 | Anterior | Left anterior descending (LAD) |
| I, aVL, V5-V6 | Lateral | Circumflex |
| V1-V2 (tall R, ST depression) | Posterior | RCA or circumflex |
D. Arrhythmias
Sinus tachycardia - Rate > 100 bpm, normal P wave before every QRS, regular rhythm. Common in fever, pain, anxiety, exercise, hyperthyroidism.
Sinus bradycardia - Rate < 60 bpm, otherwise normal morphology.
Atrial fibrillation (AF)
- Absent P waves, replaced by chaotic "f waves" (best seen in V1 and II)
- Irregularly irregular R-R intervals
- Normal QRS (unless aberrant conduction)
Atrial flutter
- Regular "sawtooth" flutter waves, typically at 250-350/min
- Upright flutter waves in leads II, III, aVF
- Usually 2:1, 3:1, or 4:1 conduction to ventricles
Wolff-Parkinson-White (WPW)
- Short PR interval (< 0.12 sec)
- Wide QRS with slurred upstroke = delta wave
- Predisposes to re-entrant tachycardia
Ventricular tachycardia (VT)
- Wide QRS tachycardia (QRS > 0.12 sec), rate > 100 bpm
- AV dissociation (P waves independent of QRS) is diagnostic
- Fusion beats and capture beats are pathognomonic
Ventricular fibrillation (VF)
- Chaotic baseline, no recognizable QRS complexes
- Fatal without immediate defibrillation
7. ECG Changes in Electrolyte Disturbances
| Electrolyte | ECG Finding |
|---|---|
| Hyperkalemia | Peaked (tall) T waves → widening QRS → sine wave pattern → VF |
| Hypokalemia | Flattened T waves, prominent U waves, ST depression |
| Hypercalcemia | Shortened QT interval |
| Hypocalcemia | Prolonged QT interval |
| Hypomagnesemia | Prolonged QT, risk of torsades de pointes |
8. Other Important ECG Patterns
Pulmonary embolism (PE)
- S1Q3T3 pattern: deep S in lead I, Q wave in lead III, T inversion in lead III
- Sinus tachycardia is the most common finding
- Right heart strain pattern (RBBB, RAD)
Pericarditis
- Diffuse saddle-shaped ST elevation in multiple leads (not territory-specific)
- PR segment depression
Hypothermia
- Osborn (J) waves: positive deflection at the J point (junction of QRS and ST)
- Slow rate, prolonged intervals
Long QT syndrome
- QTc > 0.44 sec in men, > 0.46 sec in women
- Predisposes to torsades de pointes (polymorphic VT)
- Causes: drugs (antiarrhythmics, some antibiotics, antipsychotics), electrolyte disturbances, congenital
9. Clinical Pearls
- Minor changes in precordial lead position will alter the ECG tracing - keep leads in place for serial comparisons
- Mason-Likar electrode placement (torso electrodes) may diminish inferior Q waves, making inferior MI harder to detect
- A new LBBB in the setting of suspected ischemia is treated as STEMI equivalent
- The QT segment shortens as heart rate increases (rate-correction is mandatory - use Bazett's formula: QTc = QT / √RR)
- Non-Q wave infarcts tend to be less severe but carry a high risk of reinfarction
Key Sources:
- Miller's Anesthesia, 10e - Electrical Events and the ECG
- Medical Physiology (Boron & Boulpaep) - Box 21-2, ECG interpretation
- Roberts and Hedges' Clinical Procedures in Emergency Medicine - Lead placement
- Ganong's Review of Medical Physiology, 26e - Myocardial infarction ECG changes
- Goldman-Cecil Medicine - Bundle branch blocks and AV conduction
- Harrison's Principles of Internal Medicine, 22e - Arrhythmia diagnosis
This is a shared conversation. Sign in to Orris to start your own chat.