
Teach me pft explaining every concept of it and itsvreadings in various conditions
pulmonary function test spirometry lung volumes diagram
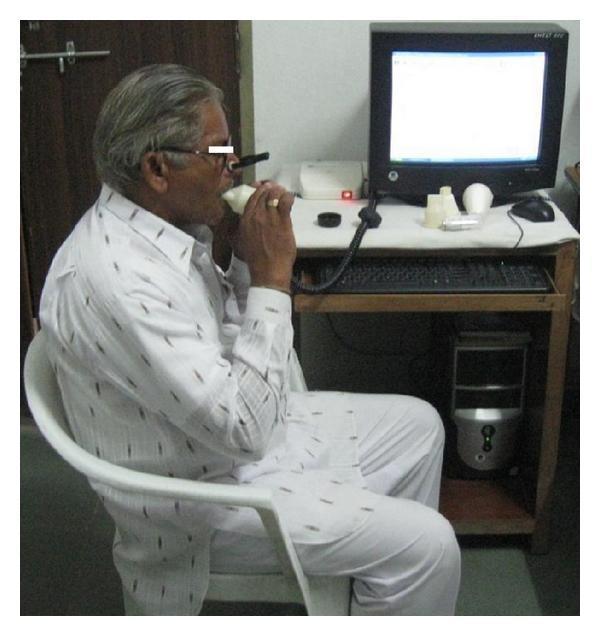
A clinical photograph illustrating a patient performing a Pulmonary Function Test (PFT) via spirometry in a clinical or research setting. The image depicts an older adult male seated upright, wearing a nose clip to ensure mouth-only breathing. He is actively interacting with a handheld spirometer, holding the disposable mouthpiece with both hands to maintain a tight seal. The device is connected via a data cable to a computer system, which includes a monitor displaying an active interface, likely for real-time visualization of flow-volume loops and spirograms. On the desk, several replacement white cylindrical mouthpieces and the hardware interface are visible. This visual serves as an educational example of the standardized setup for measuring lung volumes and ventilation capacities, such as Forced Vital Capacity (FVC) and Forced Expiratory Volume in 1 second (FEV1), highlighting the necessary equipment and proper patient positioning during the procedure.
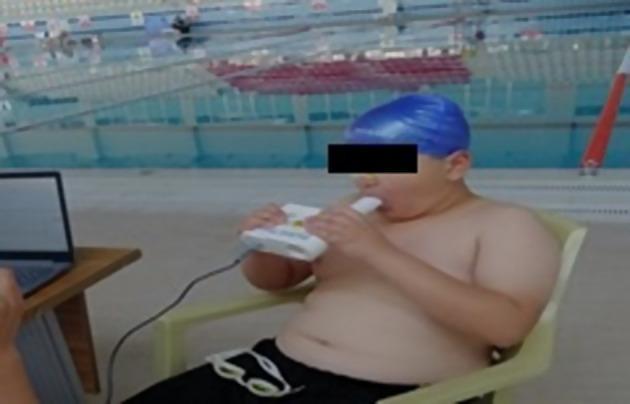
This clinical photograph illustrates the performance of a pulmonary function test, specifically Forced Vital Capacity (FVC) measurement, in an aquatic sports setting. A young male subject, wearing a blue swimming cap and dark shorts, is seated while performing spirometry. He is using a handheld digital spirometer (Pocket Spiro USB-100), gripping the white device with both hands. The subject’s lips are tightly sealed around a disposable cylindrical mouthpiece, and a nose clip is applied to ensure isolated oral expiration. A data cable connects the spirometer to a laptop on a nearby table, indicating real-time data acquisition and flow-volume loop analysis. The background shows a swimming pool environment, suggesting clinical research into the respiratory physiology of swimmers or the impact of aquatic training on lung volumes. This image serves as an educational example of portable spirometry application and proper patient positioning for diagnostic respiratory maneuvers outside a traditional lab setting.
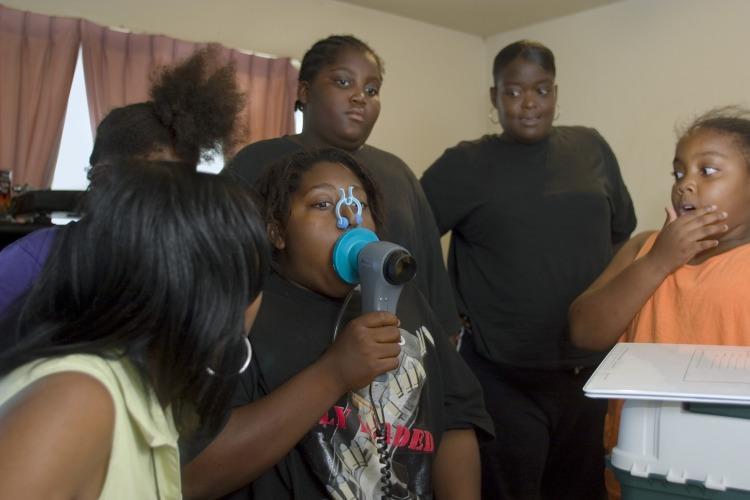
A clinical photograph depicting a pediatric patient using a handheld peak flow monitor (spirometry device) in a community or home setting. The central figure is a young girl performing a pulmonary function test; she has a blue circular mouthpiece sealed over her lips and a light blue nose clip applied to prevent nasal airflow. She holds the gray cylindrical handle of the device, which is connected by a coiled black cable to an unseen recording base. Surrounding her are other children observing the procedure. This image illustrates the practical application of respiratory diagnostic tools in community health or clinical research settings, specifically focusing on asthma management and the assessment of Peak Expiratory Flow (PEF). The clinical significance relates to monitoring airway obstruction and lung capacity in pediatric populations.
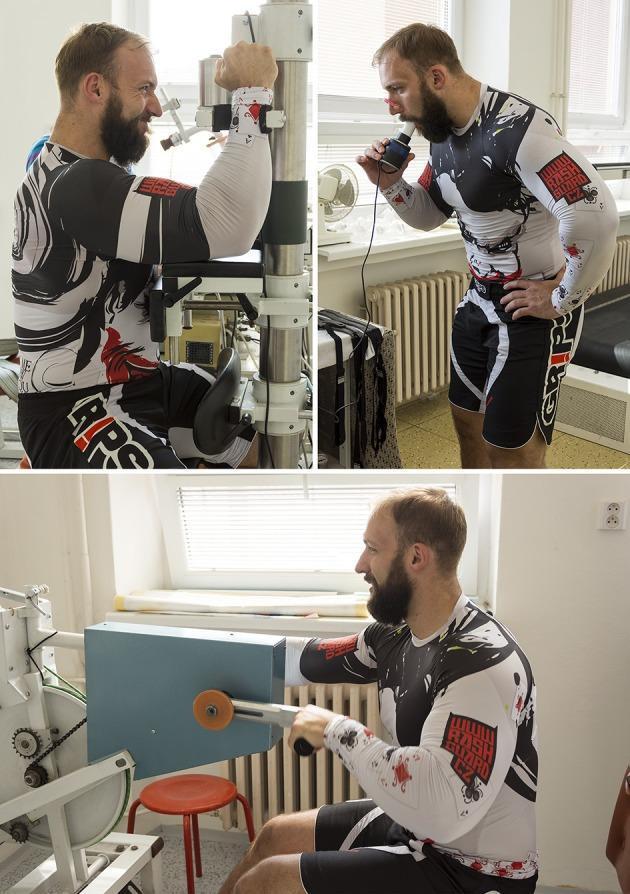
This composite of clinical photographs illustrates three standard methods for assessing physical performance and physiological capacity in a laboratory setting. Top Left: A participant undergoes maximal isometric strength measurement using an arm extension dynamometer. The subject is seated with the upper limb secured to a mechanical lever arm equipped with force transducers to quantify torque and muscular exertion. Top Right: A measurement of pulmonary function (spirometry) is shown. The participant uses a handheld spirometer with a nose clip to ensure isolated oral airflow, measuring lung volumes and capacities such as FVC and FEV1. Bottom: The participant is engaged in an anaerobic capacity assessment via a Wingate anaerobic test. This involves high-intensity cycling on a specialized ergometer to measure peak power, anaerobic fatigue, and total anaerobic work. These tests are essential in sports medicine and exercise physiology for evaluating cardiovascular fitness, neuromuscular strength, and metabolic efficiency.
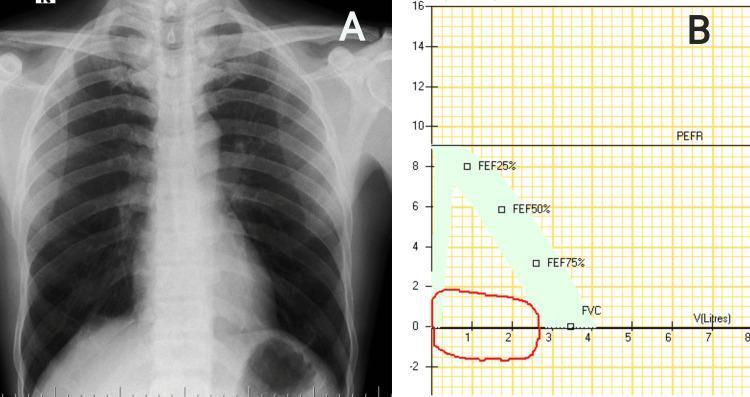
This composite medical image presents diagnostic findings for airway evaluation, consisting of a chest radiograph and a pulmonary function test graph. Image A is a posterior-anterior (PA) chest radiograph demonstrating hyperinflated lung fields characterized by increased radiolucency and flattened diaphragms, while the mediastinal contour and heart size appear within normal limits. Image B is a flow-volume loop from a spirometry assessment. The graph shows a characteristic flattening of both the expiratory (upper) and inspiratory (lower) limbs of the loop, resulting in a rectangular appearance rather than the typical triangular peak. This 'box-like' morphology is a classic physiological sign of a fixed large airway obstruction, such as subglottic stenosis or a tracheal mass. Key data points on the graph include Forced Expiratory Flow (FEF) at 25%, 50%, and 75% of vital capacity, and Peak Expiratory Flow Rate (PEFR). The clinical significance lies in the correlation between radiographic signs of air trapping and the physiological evidence of impaired airflow in both phases of respiration, facilitating the diagnosis of upper airway pathology.
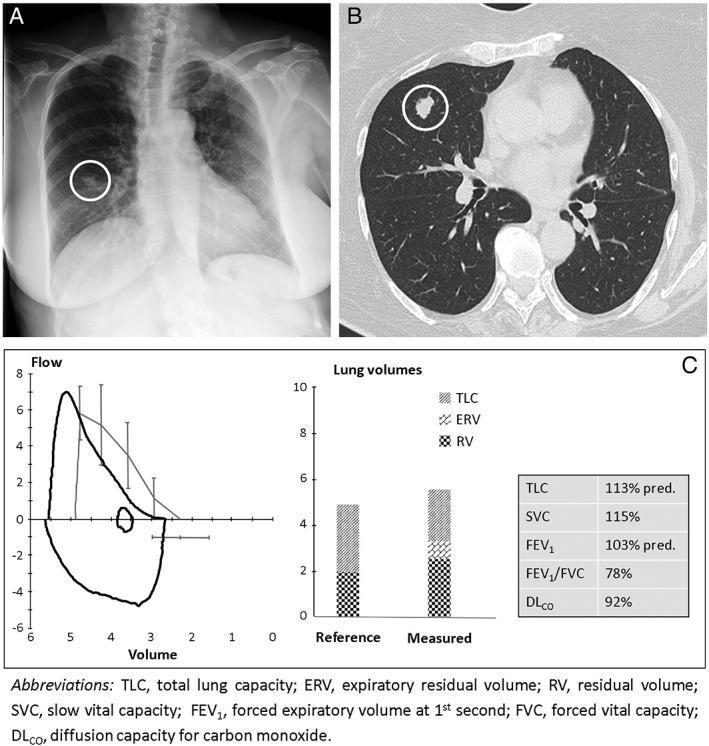
This composite educational graphic illustrates the diagnostic workup of a pulmonary nodule. Panel A is a posterior-anterior (PA) chest X-ray showing a focal, rounded opacity in the right mid-to-lower lung field, demarcated by a white circle. Panel B presents an axial high-resolution computed tomography (CT) slice of the chest, providing superior anatomical detail of the same nodule (circled), revealing its irregular morphology and heterogeneous density within the pulmonary parenchyma. Panel C details Pulmonary Function Test (PFT) results, featuring a flow-volume loop and bar graphs of lung volumes. The flow-volume loop shows a blunted expiratory limb and a shift toward higher volumes, while the bar graphs compare reference values to measured Total Lung Capacity (TLC), Expiratory Reserve Volume (ERV), and Residual Volume (RV). Accompanying data shows an elevated RV and SVC (115%), suggesting air trapping or expiratory muscle weakness. This image set is designed to teach the correlation between different thoracic imaging modalities and the physiologic assessment of lung function in patients with pulmonary lesions.
flow volume loop obstructive restrictive pattern spirometry
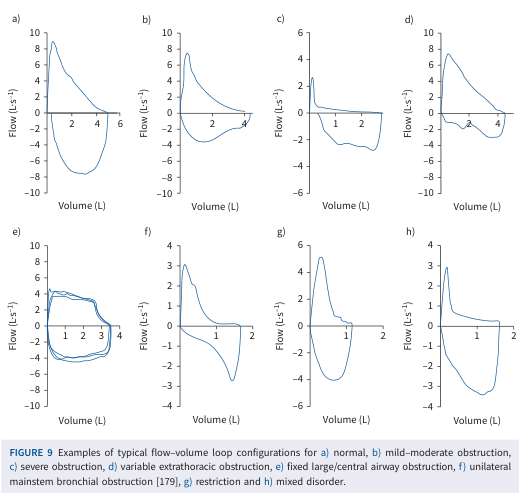
Summary : This figure presents eight typical flow–volume loop configurations, each illustrating a different pattern of pulmonary function abnormality, including normal, obstructive, restrictive, and mixed disorders. flow–volume loop plots: # Title & Axes : • Figure title: "Examples of typical flow–volume loop configurations for a) normal, b) mild–moderate obstruction, c) severe obstruction, d) variable extrathoracic obstruction, e) fixed large/central airway obstruction, f) unilateral mainstem bronchial obstruction, g) restriction and h) mixed disorder." • X-axis: "Volume (L)" with tick labels ranging from 0 to 6 (varies by panel). • Y-axis: "Flow (L·s⁻¹)" with tick labels ranging from -10 to 10 (varies by panel). # Panels & Data Points : • Panel a) Normal: Loop with peak expiratory flow near 10 L·s⁻¹, volume up to ~6 L, smooth descending limb. • Panel b) Mild–moderate obstruction: Lower peak flow (~8 L·s⁻¹), volume up to ~4 L, scooped-out descending limb. • Panel c) Severe obstruction: Peak flow ~6 L·s⁻¹, volume up to ~2.5 L, pronounced scooping and reduced flow. • Panel d) Variable extrathoracic obstruction: Peak flow ~6 L·s⁻¹, volume up to ~4 L, plateau in inspiratory limb. • Panel e) Fixed large/central airway obstruction: Loops with both inspiratory and expiratory plateaus, volume up to ~4 L, flow range -8 to 8 L·s⁻¹. • Panel f) Unilateral mainstem bronchial obstruction: Peak flow ~3 L·s⁻¹, volume up to ~2 L, irregular loop shape. • Panel g) Restriction: Peak flow ~6 L·s⁻¹, volume up to ~2 L, steep and narrow loop. • Panel h) Mixed disorder: Peak flow ~4 L·s⁻¹, volume up to ~2 L, combination of scooping and restriction features. # Design Encodings : • Each panel shows a single blue line representing the flow–volume loop. • Axes are consistent in style, with horizontal and vertical grid lines. • No additional colour or marker encodings. # Distribution & Trends : • Normal loop (a) is tall and broad, with a rapid rise and gradual fall. • Obstructive loops (b, c) show reduced peak flow and scooped-out descending limbs. • Restrictive loop (g) is narrow and steep, with reduced volume. • Fixed obstruction (e) shows plateaus in both inspiratory and expiratory limbs. • Mixed disorder (h) combines features of obstruction and restriction. # Analysis : • The figure visually distinguishes between normal, obstructive, restrictive, and mixed pulmonary function patterns. • Obstructive patterns are characterised by reduced peak flow and scooping; restrictive patterns by reduced volume and steep loops. • Fixed and variable obstructions show plateaus, while mixed disorders combine features. • These loop shapes are diagnostic for different types of airway and lung pathology.
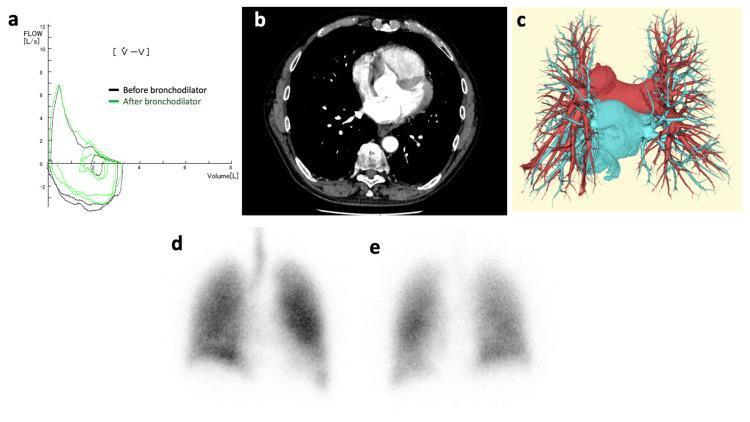
A multi-panel figure illustrating diagnostic findings in a patient with pulmonary and cardiovascular pathology. (a) A flow-volume loop (spirometry) showing a characteristic downward convex (scooped) expiratory limb indicative of obstructive lung disease, comparing pre-bronchodilator (black) and post-bronchodilator (green) states. (b) Axial contrast-enhanced chest CT at the level of the pulmonary arteries showing no acute thromboembolism. (c) Three-dimensional CT reconstruction of the pulmonary vasculature, with pulmonary arteries color-coded in red and pulmonary veins in blue; no pulmonary arteriovenous malformations or fistulas are identified. (d, e) Nuclear medicine ventilation-perfusion (V/Q) scintigraphy scans; the images demonstrate a V/Q mismatch without focal defects, suggesting a right-to-left shunt. Collectively, these images are used to evaluate platypnea-orthodeoxia syndrome (POS), focusing on identifying potential anatomical causes such as shunts or obstructive impairment.
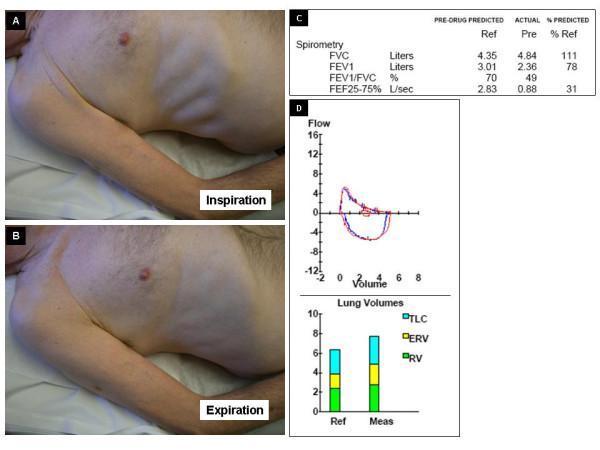
A multi-panel clinical graphic illustrating the physical and diagnostic findings of Hoover's sign in a patient with airway obstruction. Panels A and B contain clinical photographs of a male patient's torso in a lateral recumbent position. Panel A (Inspiration) demonstrates a paradoxical inward retraction of the lower rib cage and intercostal spaces, a classic physical sign of diaphragmatic flattening often seen in severe COPD or emphysema. Panel B (Expiration) shows the relative expansion or outward movement of the same region. Panel C provides a spirometry data table showing an obstructive pattern: a reduced FEV1/FVC ratio (49%) and low FEF25-75% (31% of predicted). Panel D includes a flow-volume loop demonstrating characteristic expiratory flow limitation and a bar chart of lung volumes. The lung volume chart highlights significant hyperinflation and gas trapping, characterized by an elevated Residual Volume (RV) and Total Lung Capacity (TLC) compared to reference values. This composite image serves to correlate physical examination findings of abnormal chest wall dynamics with quantitative pulmonary function testing in obstructive lung disease.
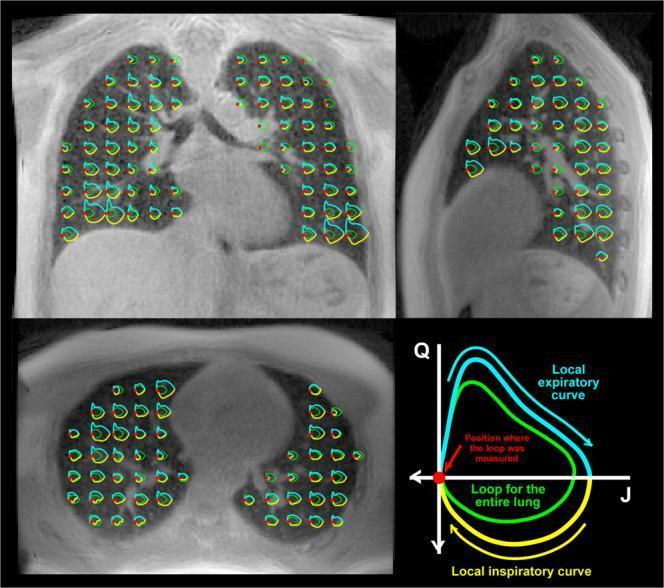
This composite diagnostic image showcases 3D Magnetic Resonance (MR) Spirometry data derived from a 3D Ultra-Short Echo Time (UTE) dataset of human lungs. The figure presents three anatomical planes: coronal (top left), sagittal (top right), and axial (bottom left), captured at the end of expiration. Superimposed across the lung parenchyma are regional flow-volume loops (Q vs. J). The yellow portions of these local loops represent the inspiratory phase, while the blue segments indicate the expiratory phase. Red dots denote the specific spatial points where each local loop was measured. A green loop is included at each location as a global reference, representing the flow-volume dynamics of the entire lung. The bottom right panel provides a legend for the color-coded phases and the Q (flow) and J (volume expansion) axes. These visualizations illustrate the spatial heterogeneity and regional variability of lung ventilation and respiratory mechanics during thoracic breathing, highlighting differences in loop size and shape across different lung regions.
lung volumes TLC RV FRC spirogram diagram
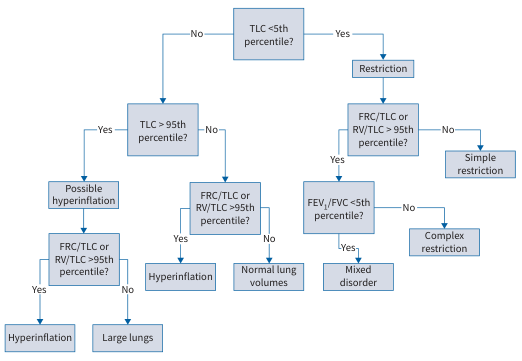
Summary : This flowchart provides a decision algorithm for interpreting lung volume measurements, specifically total lung capacity (TLC), functional residual capacity (FRC), and residual volume (RV), in relation to percentiles, to classify patterns such as restriction, hyperinflation, and mixed disorders. flowchart: # Nodes : • TLC <5th percentile? (rectangle) • Restriction (rectangle) • FRC/TLC or RV/TLC >95th percentile? (rectangle) • Simple restriction (rectangle) • FEV₁/FVC <5th percentile? (rectangle) • Mixed disorder (rectangle) • Complex restriction (rectangle) • TLC >95th percentile? (rectangle) • Possible hyperinflation (rectangle) • FRC/TLC or RV/TLC >95th percentile? (rectangle) • Hyperinflation (rectangle) • Large lungs (rectangle) • FRC/TLC or RV/TLC >95th percentile? (rectangle) • Hyperinflation (rectangle) • Normal lung volumes (rectangle) # Connectors : • TLC <5th percentile? → Yes → Restriction • Restriction → FRC/TLC or RV/TLC >95th percentile? → Yes → FEV₁/FVC <5th percentile? → Yes → Mixed disorder • FEV₁/FVC <5th percentile? → No → Complex restriction • Restriction → FRC/TLC or RV/TLC >95th percentile? → No → Simple restriction • TLC <5th percentile? → No → TLC >95th percentile? • TLC >95th percentile? → Yes → Possible hyperinflation • Possible hyperinflation → FRC/TLC or RV/TLC >95th percentile? → Yes → Hyperinflation • Possible hyperinflation → FRC/TLC or RV/TLC >95th percentile? → No → Large lungs • TLC >95th percentile? → No → FRC/TLC or RV/TLC >95th percentile? • FRC/TLC or RV/TLC >95th percentile? → Yes → Hyperinflation • FRC/TLC or RV/TLC >95th percentile? → No → Normal lung volumes # Layout : • The flowchart is organized in a top-down manner, starting with TLC <5th percentile? at the top center. • The left branch (No) leads to evaluation of TLC >95th percentile? and further splits into possible hyperinflation, hyperinflation, large lungs, or normal lung volumes. • The right branch (Yes) leads to restriction, which further splits into simple restriction, complex restriction, or mixed disorder based on FRC/TLC, RV/TLC, and FEV₁/FVC values. • All nodes are rectangles; decision points are indicated by Yes/No branches. # Analysis : • The flowchart provides a systematic approach to classifying lung volume patterns based on percentile thresholds. • Restriction is identified when TLC is below the 5th percentile, with further sub-classification based on FRC/TLC, RV/TLC, and FEV₁/FVC. • Hyperinflation and large lungs are considered when TLC is above the 95th percentile or when FRC/TLC or RV/TLC exceed the 95th percentile. • The algorithm ensures that all possible outcomes (restriction, hyperinflation, mixed disorder, normal lung volumes, large lungs) are covered based on the input values.
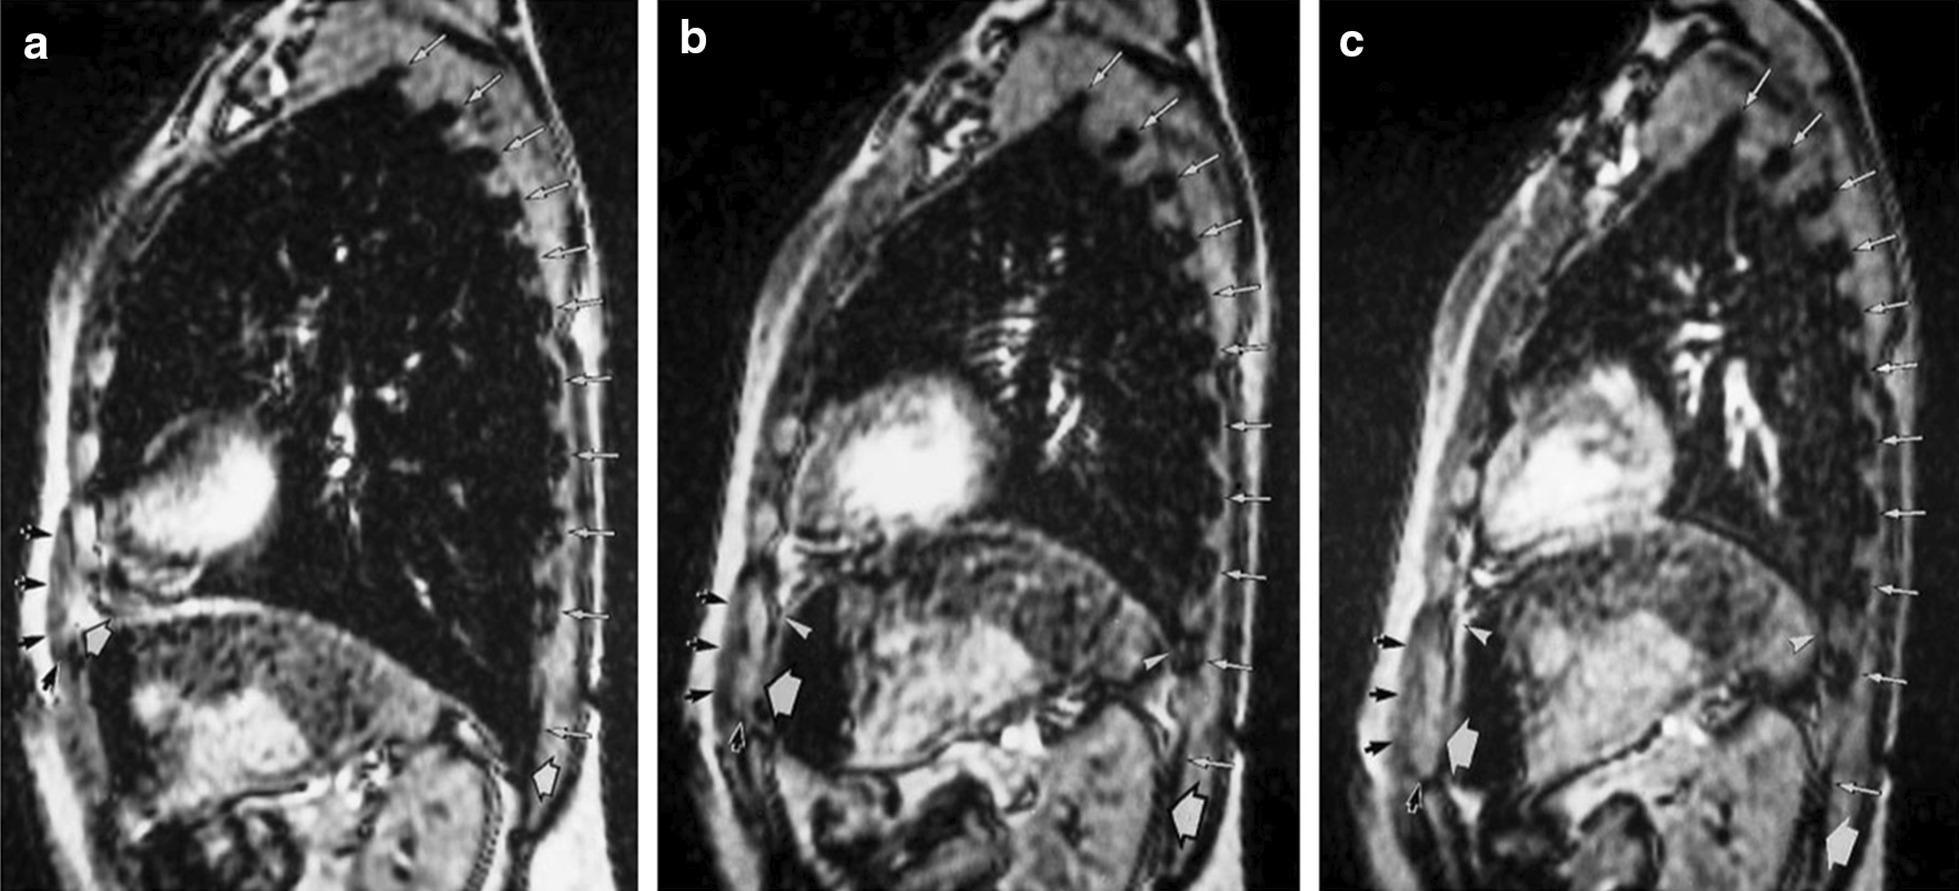
This diagnostic image set consists of three sagittal magnetic resonance (MRI) scans of the human thorax, illustrating the relationship between the diaphragm, rib cage, and lung volumes at different respiratory stages: (a) Total Lung Capacity (TLC), (b) Functional Residual Capacity (FRC), and (c) Residual Volume (RV). The images demonstrate the mechanics of the 'zone of apposition' (ZOA)—the area where the diaphragm muscle is directly opposed to the inner rib cage. At TLC (a), the diaphragm is flattened, and the ZOA is nearly zero, with the anterior insertion (white arrowhead) close to the lower ribs (black arrows). At FRC (b) and RV (c), the diaphragm domes cranially, significantly increasing the ZOA as shown by the rising upper limits (thin white arrowheads). The scans also highlight changes in thoracic geometry; as volume decreases from TLC to RV, the rib cage descends and intercostal spaces visibly narrow. This series is an educational tool for pulmonary physiology, demonstrating diaphragmatic excursion and its contribution to inspiratory capacity.

This medical flow diagram illustrates a multi-step image registration workflow used to generate 1H-MRI-specific ventilation (SV) maps. The flowchart tracks the processing of coronal thoracic MRI slices through various respiratory states. Primary inputs include '1H MRI TLC' (Total Lung Capacity) showing expanded lung volumes and a low-riding diaphragm, and '1H MRI RV' (Residual Volume) showing contracted lung volumes with a superiorly displaced diaphragm. The workflow utilizes 'Deformable registration' to align the TLC and RV scans, resulting in a 'Warped 1H MRI TLC' image that matches the RV geometry. From these registered datasets, a '1H MRI SV map' is computed, which provides a functional representation of regional lung ventilation, appearing as a segmented intensity map. The process further incorporates functional 129Xe MRI (acquired at Functional Residual Capacity plus bag) via 'Rigid registration' to an anatomical '1H MRI FRC+bag' reference. This workflow demonstrates the integration of anatomical proton MRI and functional hyperpolarized gas MRI for advanced pulmonary diagnostic imaging and quantification of regional ventilation defects.
Pulmonary Function Tests (PFT) - A Complete Guide
PART 1 - Lung Volumes (The Foundation)
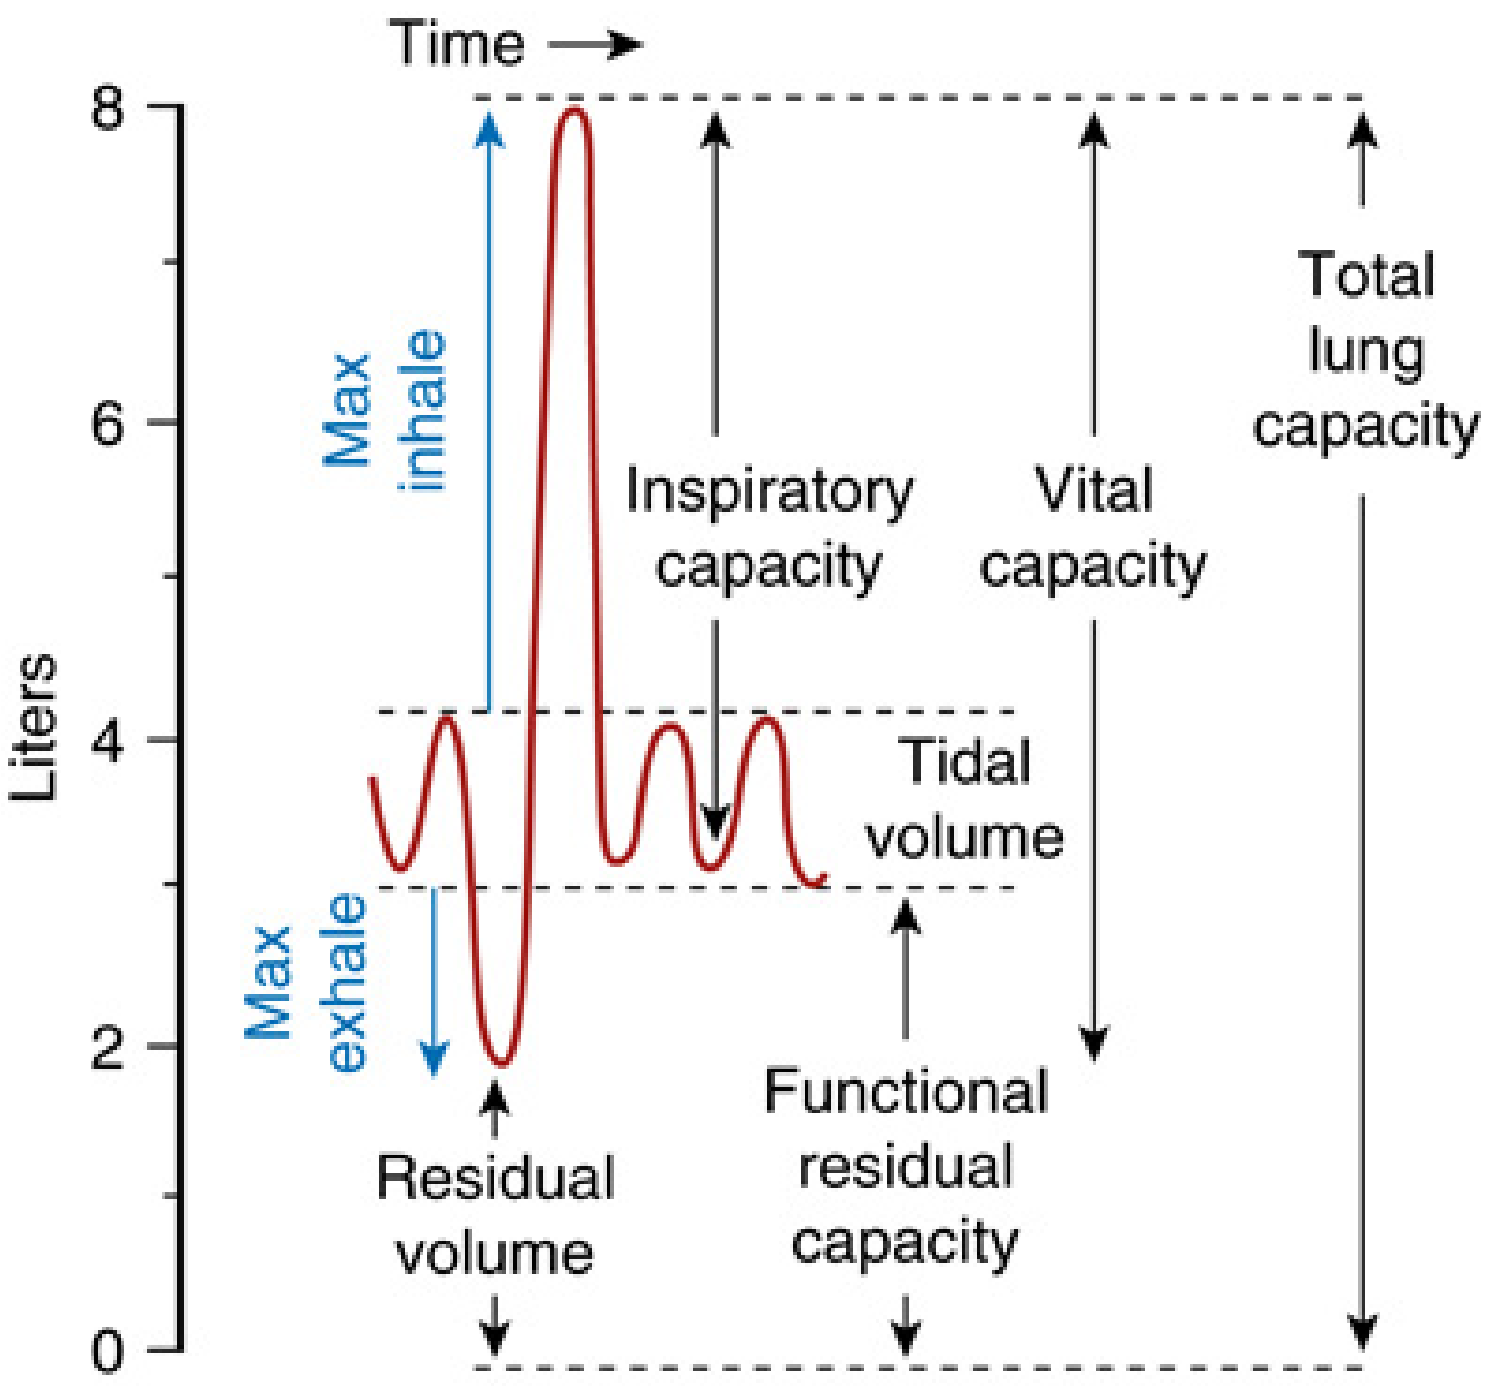
Static Lung Volumes
| Volume/Capacity | Definition | Normal value |
|---|---|---|
| Tidal Volume (TV) | Air moved in/out per normal breath at rest | ~500 mL |
| Inspiratory Reserve Volume (IRV) | Extra air you can inhale above a normal breath | ~3000 mL |
| Expiratory Reserve Volume (ERV) | Extra air you can exhale after a normal breath out | ~1200 mL |
| Residual Volume (RV) | Air remaining after maximal exhalation - cannot be measured by spirometry alone | ~1200 mL |
| Functional Residual Capacity (FRC) | Air in lungs after a normal exhale = ERV + RV | ~2400 mL |
| Inspiratory Capacity (IC) | Max air inhaled from resting position = TV + IRV | ~3500 mL |
| Vital Capacity (VC) | Max air exhaled after max inhalation = IRV + TV + ERV | ~4600 mL |
| Total Lung Capacity (TLC) | Total air the lung can hold = VC + RV | ~6000 mL |
PART 2 - Spirometry Parameters (The Core Test)
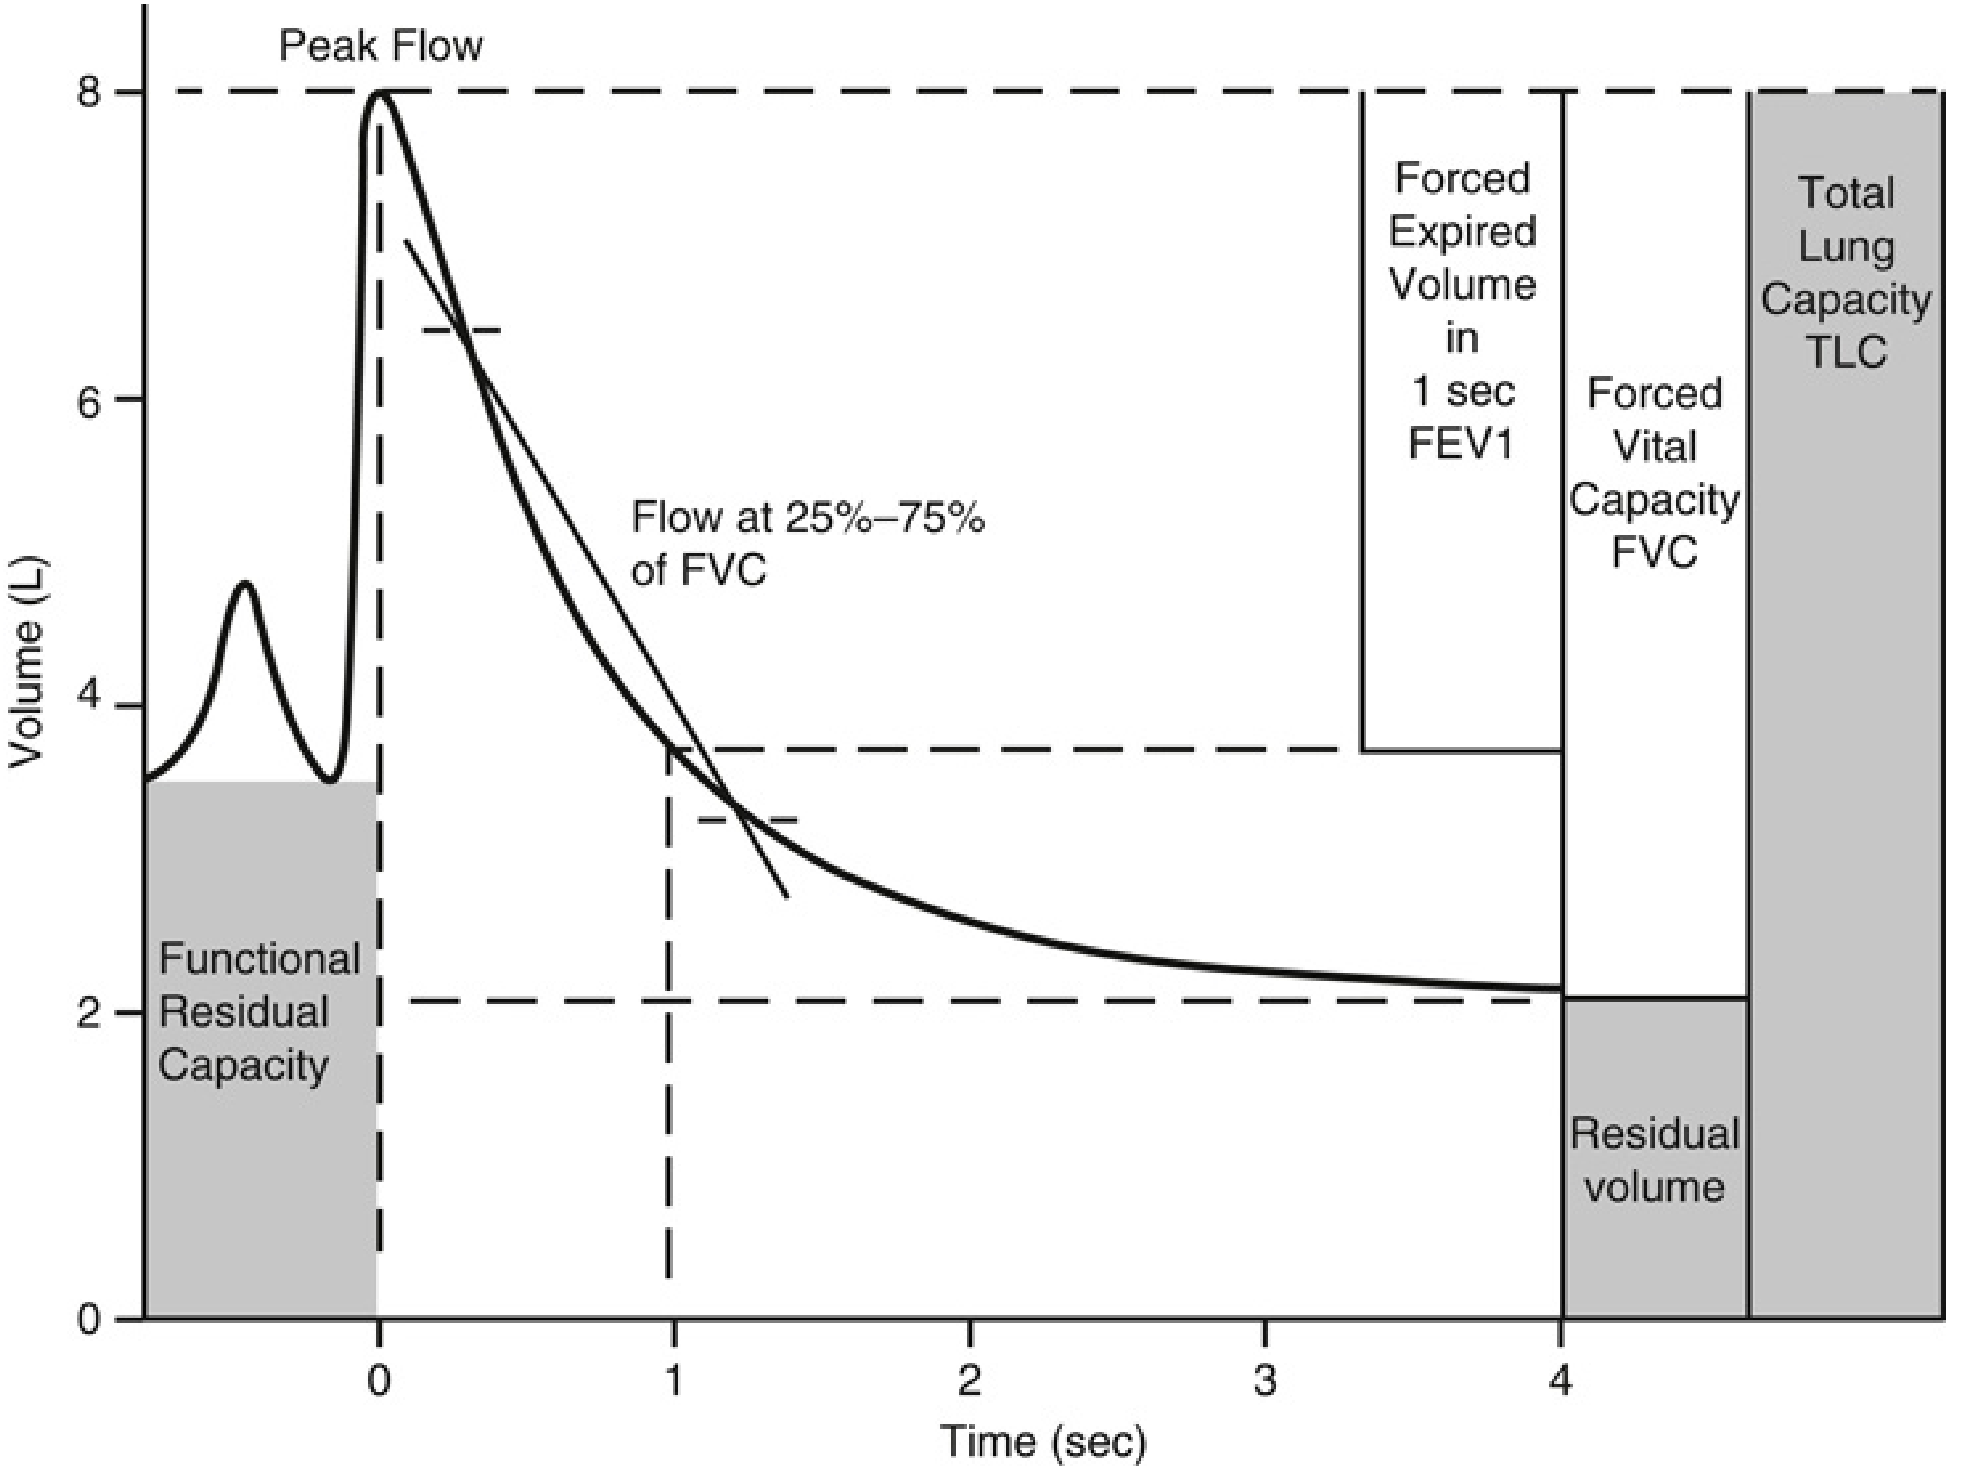
How Spirometry Is Performed
Key Spirometry Values
- The total volume exhaled from full inspiration to complete exhalation
- Reduced in restrictive disease (lungs can't fill fully)
- May also be reduced in severe obstruction (air trapping)
- Normal: >80% predicted
- Volume exhaled in the first second of the forced maneuver
- The single most useful spirometry number
- Reduced in both obstruction (can't push air out fast) and restriction (less air to begin with)
- Normal: >80% predicted
- The gold standard for distinguishing obstructive from restrictive disease
- Normal: >0.70 (or >LLN - Lower Limit of Normal using Z-scores)
- < 0.70 = Obstructive pattern
- Normal or elevated (>0.80) with reduced FVC = Restrictive pattern
- Also called MMEF (mid-maximal expiratory flow)
- Reflects small airway disease - often the earliest sign of airway dysfunction
- More effort-independent than FEV1; reduced early in smokers and early asthma
- Normal: >60% predicted
- Maximum flow rate achieved during forced expiration
- Effort-dependent
- Used mainly in asthma monitoring at home
- Reduced in obstruction; normal or mildly reduced in restriction
- FEV6 is used as a surrogate for FVC in effort-limited patients (elderly, unwell)
- FEV1/FEV6 ratio is nearly as good as FEV1/FVC for detecting obstruction
PART 3 - Interpreting the Pattern
Step-by-Step Interpretation Algorithm
Step 1: Is FEV1/FVC < 0.70?
   YES → Obstructive pattern
   NO → Normal ratio

Step 2 (if normal ratio): Is FVC < 80% predicted?
   YES → Restrictive pattern (confirm with TLC < 5th percentile)
   NO → Normal spirometry

Step 3: Grade severity (by FEV1 % predicted):
   ≥80% = Mild
   50-79% = Moderate
   30-49% = Severe
   <30% = Very severe
Obstructive Pattern
| Disease | FEV1 | FVC | Ratio | TLC | RV | DLCO |
|---|---|---|---|---|---|---|
| Asthma (reversible) | ↓↓ | Normal or ↓ | ↓ | N or ↑ | ↑ | Normal |
| COPD/Emphysema | ↓↓ | ↓ | ↓ | ↑↑ | ↑↑ | ↓↓ |
| Chronic Bronchitis | ↓↓ | ↓ | ↓ | N or ↑ | ↑ | Normal |
| Bronchiectasis | ↓ | ↓ | ↓ | N or ↑ | N or ↑ | Normal or ↓ |
| Cystic Fibrosis | ↓↓ | ↓ | ↓ | ↑ | ↑↑ | ↓ |
- Chronic bronchitis: large and small airway narrowing by fibrosis, secretions, edema
- Emphysema: loss of lung elastic recoil (parenchymal destruction)
- Asthma: bronchoconstriction, mucosal edema, mucus plugging
- Upper airway obstruction: seen in the flow-volume loop
Restrictive Pattern
| Disease | FEV1 | FVC | Ratio | TLC | RV | DLCO |
|---|---|---|---|---|---|---|
| Pulmonary Fibrosis (IPF) | ↓ | ↓↓ | N or ↑ | ↓↓ | ↓ | ↓↓ |
| Sarcoidosis | ↓ | ↓↓ | N or ↑ | ↓↓ | ↓ | ↓ |
| Pleural effusion | ↓ | ↓↓ | N | ↓ | ↓ | Normal |
| Kyphoscoliosis | ↓ | ↓↓ | N or ↑ | ↓↓ | ↓ | Normal |
| Neuromuscular disease | ↓ | ↓↓ | N or ↑ | ↓↓ | N or ↑ | Normal |
| Obesity | ↓ | ↓ | N | N or ↓ | N | Normal |
- Pulmonary/parenchymal: IPF, sarcoidosis, pneumoconiosis - lungs are stiff
- Extrapulmonary: chest wall deformity, pleural disease, neuromuscular - lungs can't expand due to external constraint
In neuromuscular disease, RV may be normal or elevated (patient can't exhale forcefully), while TLC is reduced - distinguishing it from true pulmonary restriction.
Mixed Obstructive-Restrictive Pattern
- Seen in: advanced sarcoidosis, coal worker's pneumoconiosis, some cases of COPD + fibrosis
Nonspecific Pattern
- FEV1/FVC normal, but both FEV1 and FVC reduced without TLC measurement confirming restriction
- Requires TLC measurement to classify properly
PART 4 - Flow-Volume Loops
Interpreting the Loop
Upper Airway Obstruction - The Key Patterns
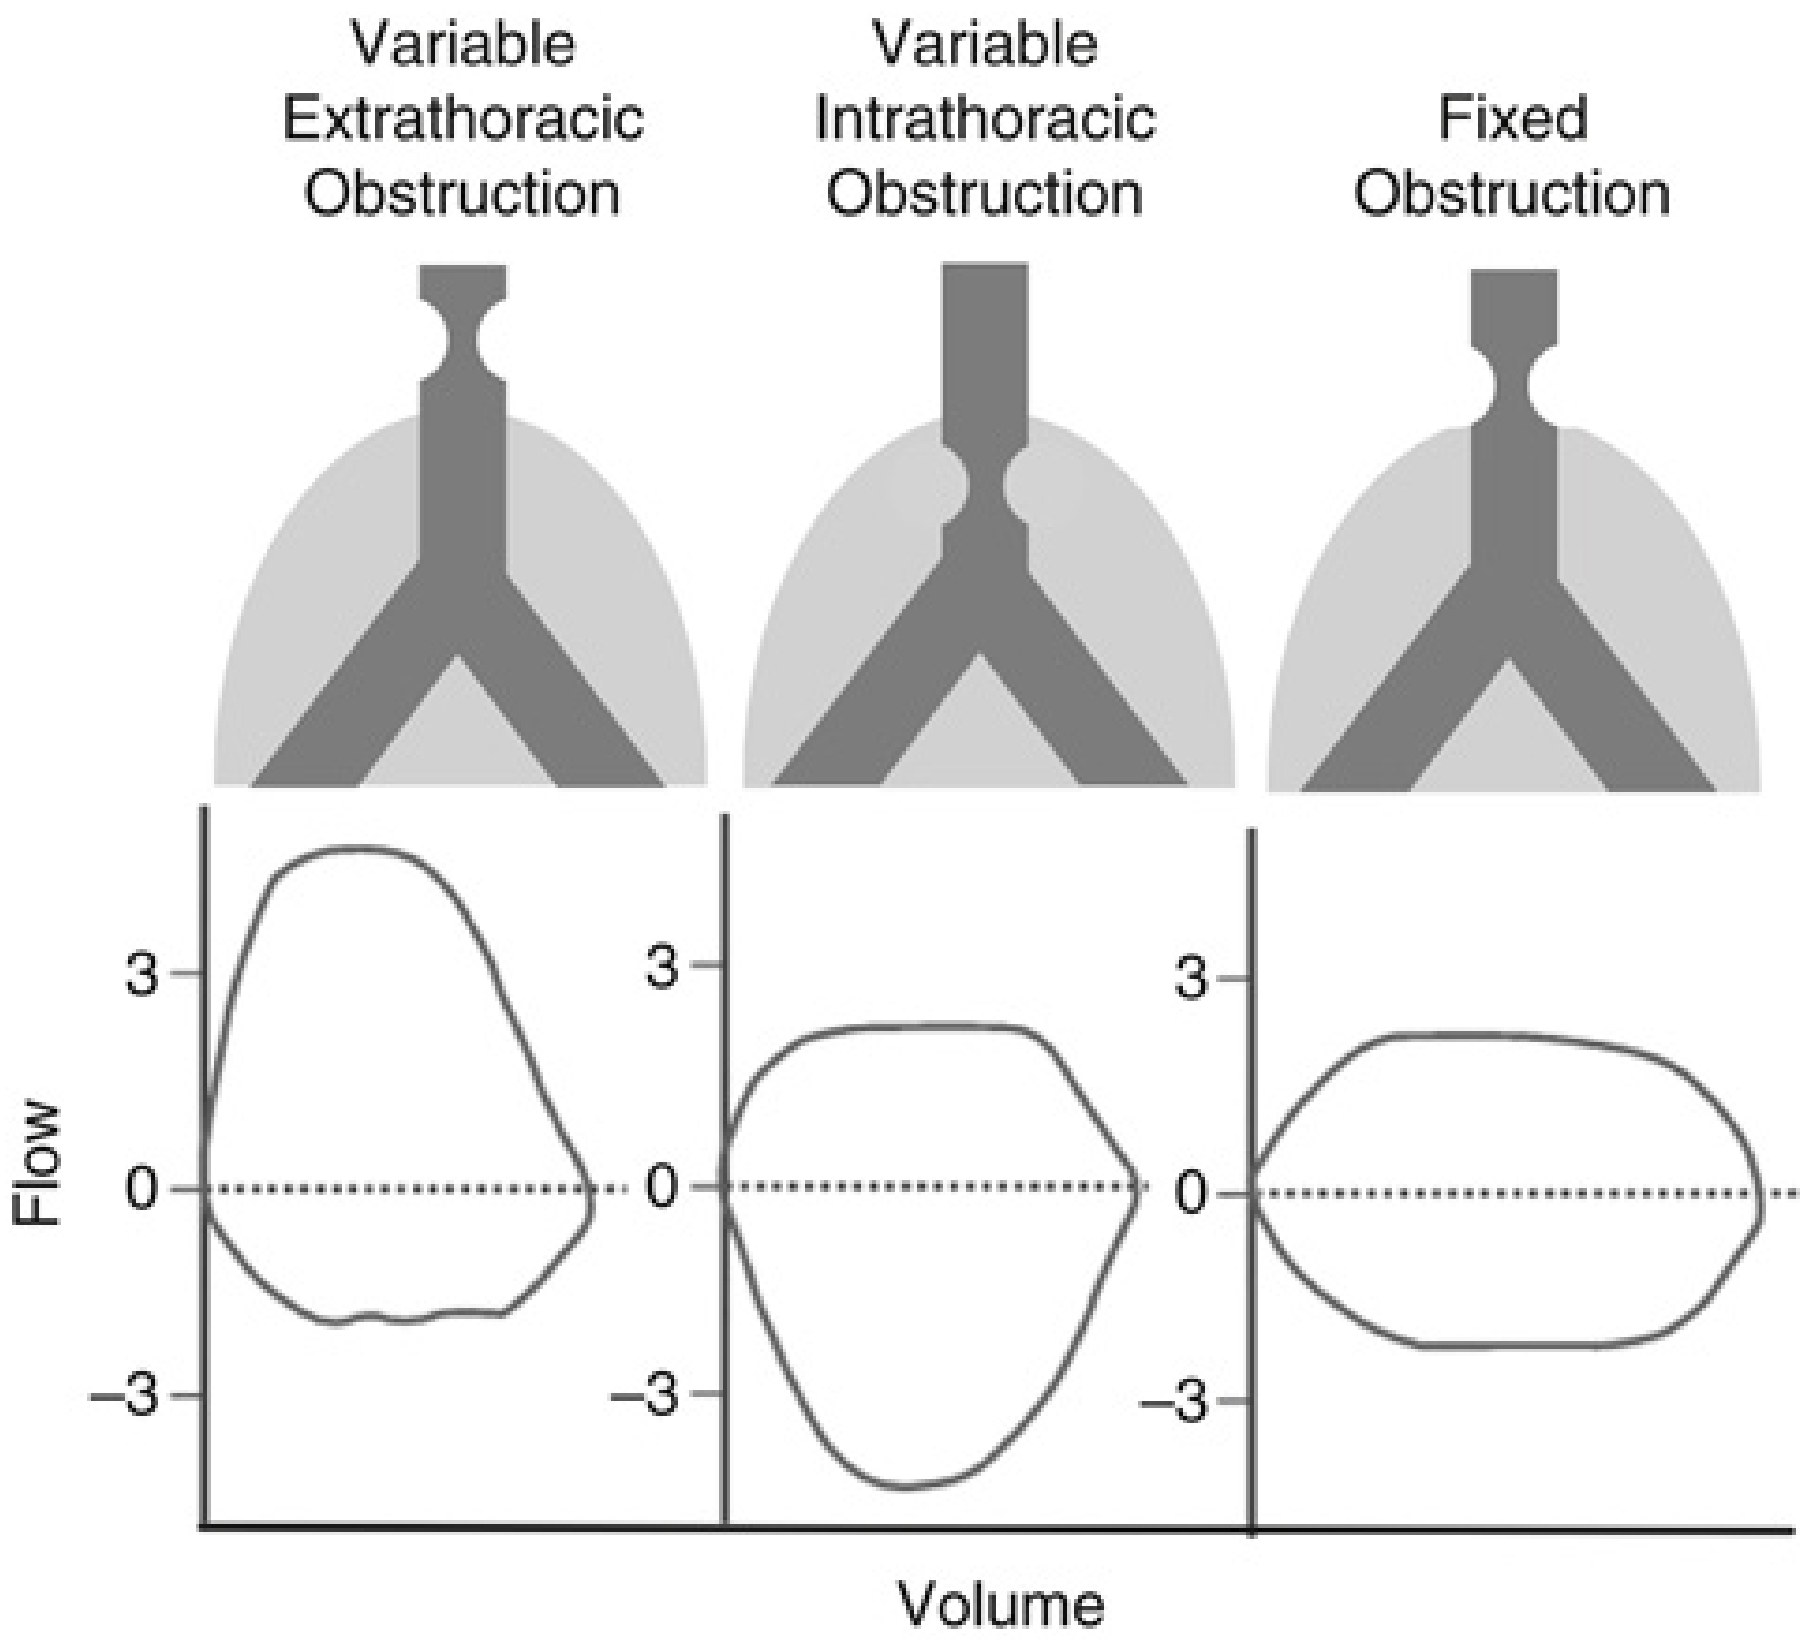
| Pattern | Flattening | Cause | Example |
|---|---|---|---|
| Variable Extrathoracic | Inspiratory limb only | During inspiration, negative airway pressure collapses the lesion above thoracic inlet | Vocal cord paralysis, tracheal stenosis above thorax |
| Variable Intrathoracic | Expiratory limb only | During expiration, positive pleural pressure compresses the lesion | Tracheomalacia, tracheal tumor below carina |
| Fixed Obstruction | BOTH limbs (box-shaped loop) | Rigid stenosis - not affected by breathing phase | Tracheal stenosis (rigid), goiter compressing trachea |
- Extra = Inspiratory plateau (the outside air is fighting the floppy upper airway on breathing IN)
- Intra = Expiratory plateau (the chest pressure squeezes the intrathoracic airway on breathing OUT)
- Fixed = Both limbs flattened equally
PART 5 - DLCO (Diffusing Capacity for Carbon Monoxide)
What It Measures
- Alveolar surface area
- Alveolar membrane thickness
- Hemoglobin concentration (CO binds hemoglobin - affected by anemia/polycythemia)
- Pulmonary capillary blood volume
The Test
Normal: >75% predicted (or >LLN)
DLCO in Disease States
| Condition | DLCO | Mechanism |
|---|---|---|
| Emphysema | ↓↓ | Destruction of alveolar walls - reduced surface area |
| Pulmonary Fibrosis (IPF) | ↓↓ | Thickened alveolar-capillary membrane |
| Pulmonary Hypertension | ↓↓ | Reduced pulmonary capillary blood volume |
| Pulmonary Embolism | ↓ | Reduced capillary perfusion |
| Anemia | ↓ (corrected for Hb) | Less hemoglobin to bind CO |
| Pneumonia / Atelectasis | ↓ | Reduced available surface area |
| Sarcoidosis | ↓ | Granulomatous destruction |
| Scleroderma/ILD | ↓↓ | Membrane thickening |
| Asthma (mild) | Normal | Airway disease only, parenchyma intact |
| Polycythemia | ↑ | More hemoglobin to bind CO |
| Pulmonary hemorrhage | ↑ | Free hemoglobin in alveoli binds CO |
| Left-to-right cardiac shunt | ↑ | Increased pulmonary blood volume |
| Exercise | ↑ | Increased pulmonary blood flow and recruitment |
DLCO < 60% of predicted = increased risk of postoperative pulmonary complications - Miller's Anesthesia, p. 1304
- Emphysema: DLCO markedly reduced (parenchymal destruction)
- Chronic bronchitis: DLCO usually normal (airways diseased, not parenchyma)
PART 6 - Bronchodilator Reversibility
Positive Response (Reversibility):
- FEV1 increases ≥ 12% AND ≥ 200 mL from baseline
- Suggests asthma (full reversibility) vs. COPD (partial or no reversibility)
| Feature | Asthma | COPD |
|---|---|---|
| Reversibility | Complete (FEV1 often normalizes) | Partial or absent |
| DLCO | Normal | Reduced (if emphysema) |
| TLC | Normal or ↑ | ↑↑ |
| Smoking history | Variable | Almost always |
| Age of onset | Often young | Usually >40 |
PART 7 - Lung Volume Measurement Methods
- Gold standard; most accurate
- Patient sits in airtight chamber, makes inspiratory efforts against closed shutter
- Measures ALL lung gas including trapped air
- Best for: COPD, emphysema (where trapped gas is significant)
- Patient breathes a known concentration of helium; helium equilibrates with lung air
- Underestimates TLC in obstructive disease (doesn't reach poorly ventilated regions)
- Best for: restrictive disease
- Patient inhales 100% O2; exhaled nitrogen is measured until it disappears
- FRC calculated from total nitrogen exhaled
- Same limitation as helium dilution in severe obstruction
PART 8 - Full PFT Interpretation Algorithm
Putting It All Together
- FEV1/FVC ↓, FEV1 ↓, FVC normal or ↓
- Reversibility: significant (>12% + 200 mL)
- TLC normal or ↑, RV ↑ during attack
- DLCO: normal
- Flow-volume loop: scooped expiratory limb, normalizes post-bronchodilator
- FEV1/FVC ↓ (post-bronchodilator, non-reversible)
- TLC ↑↑, RV ↑↑, FRC ↑↑ (air trapping and hyperinflation)
- DLCO ↓↓ (hallmark - differentiates from chronic bronchitis)
- Flow-volume loop: severe scooping
- FEV1/FVC normal or ↑, FVC ↓↓
- TLC ↓↓, RV ↓, FRC ↓
- DLCO ↓↓ (often out of proportion to spirometry)
- Flow-volume loop: narrow, tall (restrictive pattern)
- Spirometry often near-normal
- DLCO ↓↓ (isolated DLCO reduction is a key clue)
- TLC may be mildly reduced
- FVC ↓↓ (patient cannot generate enough force)
- FEV1/FVC ratio preserved (high or normal)
- TLC ↓, but RV often normal or slightly elevated (weak expiratory muscles can't empty the lungs)
- DLCO normal
- Peak inspiratory pressure (Pimax) and peak expiratory pressure (Pemax) both ↓
- Restrictive pattern (TLC ↓, FVC ↓, ratio normal)
- DLCO normal (parenchyma intact)
- Mild restriction: ↓ FRC, ↓ ERV
- FEV1/FVC normal
- TLC usually normal
- DLCO normal or slightly ↑
- Most commonly restrictive (parenchymal infiltration)
- Can be obstructive (if endobronchial involvement) or mixed
- DLCO reduced (granulomatous inflammation of alveolar walls)
- Spirometry usually normal or mildly abnormal
- DLCO ↓ (reduced perfusion)
- Useful to raise suspicion when DLCO drops out of proportion to spirometry
PART 9 - Quick Reference Summary Table
| Parameter | Obstructive | Restrictive | Mixed |
|---|---|---|---|
| PEFR | ↓↓ | Normal or ↓ | ↓ |
| FEV1 | ↓↓ | Normal or ↓ | ↓↓ |
| FVC | Normal or ↓ | ↓↓ | ↓↓ |
| FEV1/FVC | < 0.70 | > 0.80 (normal) | < 0.70 |
| TLC | N or ↑ | ↓↓ | ↓ |
| RV | ↑↑ | ↓ | Variable |
| FRC | ↑ | ↓ | Variable |
| DLCO | ↓ (emphysema) / N (bronchitis) | ↓↓ (fibrosis) / N (pleural) | ↓ |
- Bailey and Love's Surgery, p. 5079-5088
- Fishman's Pulmonary Diseases, p. 1566-1674
- Miller's Anesthesia, p. 1194-1200
PART 10 - Special Tests
6-Minute Walk Test (6MWT)
- Patient walks as far as possible in 6 minutes on a 30-meter course
- Measures functional exercise capacity
- Used in COPD, ILD, pulmonary hypertension, heart failure
- Contraindicated if: unstable angina, MI within 1 month, resting HR >120, BP >180/100
- Improved by bronchodilators in COPD, pulmonary rehabilitation, and lung transplantation
Peak Inspiratory Pressure (Pimax) / Expiratory Pressure (Pemax)
- Measures respiratory muscle strength
- Both ↓ in: poor effort, fatigue, neuromuscular disease
- Pimax alone ↓ in: increased lung volume (disadvantaged diaphragm position)
- Pemax alone ↓ in: decreased lung volume
Fractional Exhaled Nitric Oxide (FeNO)
- Elevated in eosinophilic airway inflammation (asthma)
-
25 ppb = likely eosinophilic inflammation; predicts steroid response
- Not a standard spirometry test but increasingly used alongside PFTs
Key Teaching Points to Remember
- FEV1/FVC ratio is the gatekeeper - it tells you the pattern (obstructive vs. restrictive)
- TLC confirms restriction - you cannot call restriction without a low TLC
- DLCO is your window into the alveolar-capillary unit - it goes down in emphysema, fibrosis, and pulmonary hypertension
- Emphysema vs. Chronic Bronchitis - DLCO separates them (emphysema = DLCO ↓↓; bronchitis = DLCO normal)
- Reversibility distinguishes asthma from COPD
- Flow-volume loop is the key to upper airway obstruction - always look for plateaus
- Neuromuscular disease = restrictive pattern but RV may be normal or high (can't generate force to exhale to RV)
- Isolated DLCO reduction = think pulmonary hypertension, pulmonary embolism, early emphysema
Teach me Interstitial Lung Disease
interstitial lung disease HRCT patterns honeycombing ground glass
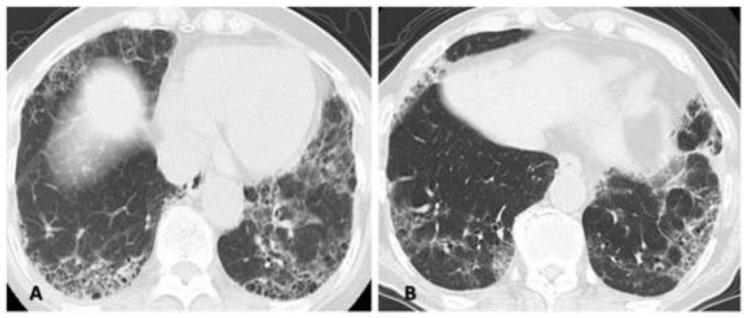
Two high-resolution computed tomography (HRCT) axial lung window images (A and B) demonstrating interstitial lung disease (ILD) patterns with overlapping features. Case A (left) shows a combination of diffuse ground-glass opacities (GGO), particularly in the right lung, and subpleural reticulation. Peripheral honeycombing is visible in the posterior lower lung fields, creating a mixed picture of nonspecific interstitial pneumonia (NSIP) and usual interstitial pneumonia (UIP). Case B (right) reveals predominant peripheral and subpleural reticular opacities and honeycombing in the bilateral lower lobes, more pronounced on the left side, which are classic hallmarks of a UIP pattern. These images illustrate the diagnostic challenge of 'unclassifiable' or 'mixed' patterns in rheumatology-associated ILD, where inflammatory (NSIP-like) and fibrotic (UIP-like) components coexist. Key educational features include the distinction between reversible GGO and irreversible honeycombing/traction bronchiectasis in the context of progressive fibrosing interstitial lung disease (PF-ILD).
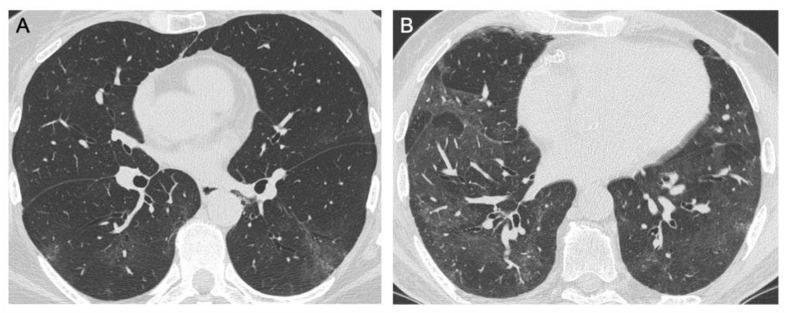
Two axial high-resolution computed tomography (HRCT) images of the thorax demonstrating patterns of interstitial lung disease, frequently associated with post-inflammatory sequelae such as those following viral pneumonia or ARDS. Image A shows bilateral, ill-defined subpleural ground-glass opacities (GGOs) primarily localized in the lower lobes. These GGOs represent a hazy increase in lung attenuation where underlying vascular structures remain visible. Image B illustrates a more diffuse distribution of ground-glass opacities across both lung fields. Associated findings include subtle interlobular septal thickening and fine reticular patterns, indicating mild interstitial involvement. No overt honeycombing, traction bronchiectasis, or dense consolidations are visualized in these specific slices. The images are pedagogically significant for distinguishing between focal subpleural and diffuse parenchymal opacification in the context of pulmonary follow-up and clinical assessment of lung parenchyma recovery.
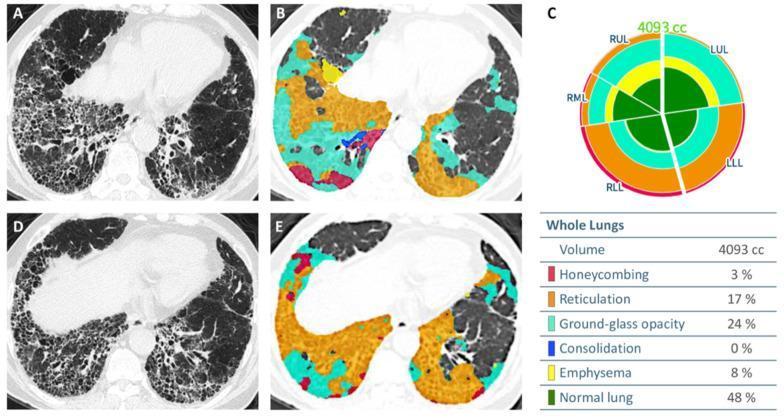
This composite image illustrates the automated quantification of CT parenchymal patterns in a 74-year-old male with Idiopathic Pulmonary Fibrosis (IPF). Figures A and D display axial thin-section High-Resolution Computed Tomography (HRCT) images at the lung bases, showing classic signs of interstitial lung disease: peripheral honeycombing, reticulation, and ground-glass opacities (GGO). Figures B and E show the same HRCT slices with color-coded overlays generated by AI for disease pattern classification. The color map identifies honeycombing (red), reticulation (orange), ground-glass opacity (cyan), emphysema (yellow), and consolidation (dark blue), with normal lung tissue in dark green. Figure C includes a quantitative circular glyph and table summarizing the whole-lung volume (4093 cc). The data highlights the extent of lung involvement: 48% normal lung, 24% GGO, 17% reticulation, 8% emphysema, and 3% honeycombing. The glyph further breaks down these proportions by lung lobe (RUL, RML, RLL, LUL, LLL), facilitating an objective assessment of disease distribution and severity for clinical monitoring and research.
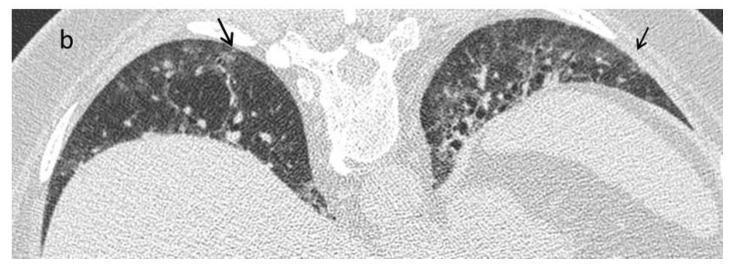
This diagnostic image is an axial High-Resolution Computed Tomography (HRCT) scan of the lung bases in a 42-year-old female patient with systemic sclerosis (SSc). The image demonstrates early-stage interstitial lung disease (ILD) characterized by subtle, patchy ground-glass opacities (GGO), indicated by black arrows. These opacities are primarily distributed in the peripheral and subpleural regions of both lungs. The ground-glass appearance is defined by a hazy increase in lung attenuation that does not obscure the underlying bronchovascular structures. Associated findings include mild reticular patterns and slight interlobular septal thickening within the affected areas. The persistence of these findings in a prone position scan (as indicated by the clinical context) suggests a non-specific interstitial pneumonia (NSIP) pattern rather than gravity-dependent atelectasis. This visual provides an educational example of the early pulmonary manifestations of connective tissue disease-associated ILD, emphasizing the importance of HRCT in detecting early interstitial alterations that may precede extensive fibrosis or honeycombing.
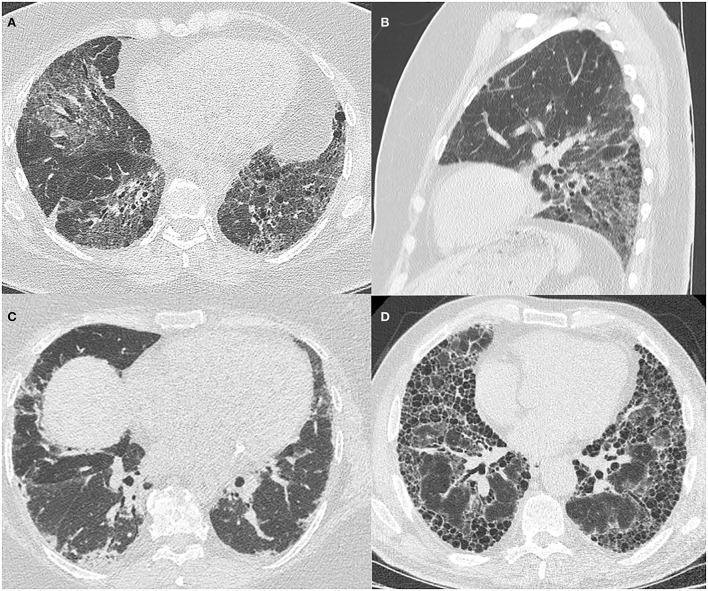
This composite of High-Resolution Computed Tomography (HRCT) images illustrates diverse patterns of Interstitial Lung Disease (ILD) associated with Antisynthetase Syndrome (ASyS). Panel A (axial) and B (sagittal) depict fibrotic Non-Specific Interstitial Pneumonitis (NSIP), characterized by bilateral, patchy ground-glass opacities, fine reticulation, and traction airway dilatation, with a clear lower zone predominance visible in the sagittal reconstruction. Panel C displays an Organizing Pneumonitis (OP) pattern, showing patchy, peripheral, and basal-predominant lung consolidation. Panel D demonstrates a Usual Interstitial Pneumonitis (UIP) pattern, featuring advanced fibrotic changes including subpleural and basal-predominant reticulation and extensive honeycombing. These images serve as an educational comparison of radiological manifestations in connective tissue disease-related ILD (CTD-ILD), highlighting key diagnostic features such as ground-glass opacification, architectural distortion, and honeycombing across different pathological patterns in patients with anti-Jo1 antibodies.
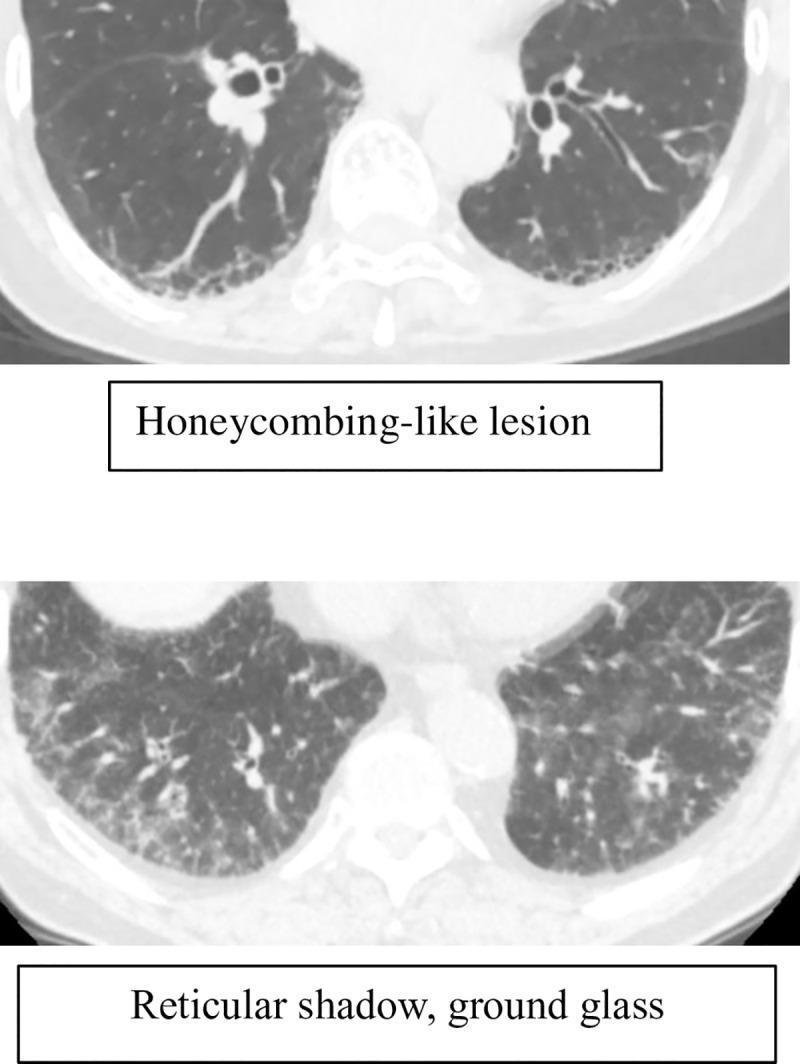
This diagnostic image consists of two axial high-resolution computed tomography (HRCT) scans of the human chest, demonstrating various patterns of interstitial lung abnormalities (ILAs). The upper panel displays a 'honeycombing-like lesion' characterized by clustered, cystic airspaces with thick, well-defined walls, primarily located in the subpleural and peripheral regions of the lower lung lobes. The lower panel illustrates 'reticular shadows' and 'ground-glass opacities.' The reticular pattern is visible as a fine network of linear opacities, while the ground-glass opacities present as a hazy increase in lung density that does not obscure the underlying bronchovascular structures. These findings are significant in the context of chronic obstructive pulmonary disease (COPD) and the progression of interstitial fibrosis. The imaging serves as a clinical reference for distinguishing specific radiological morphologies in pulmonology and radiology, specifically focusing on the diagnostic criteria for identifying early or comorbid interstitial changes in chronic lung disease patients.
sarcoidosis bilateral hilar lymphadenopathy chest xray
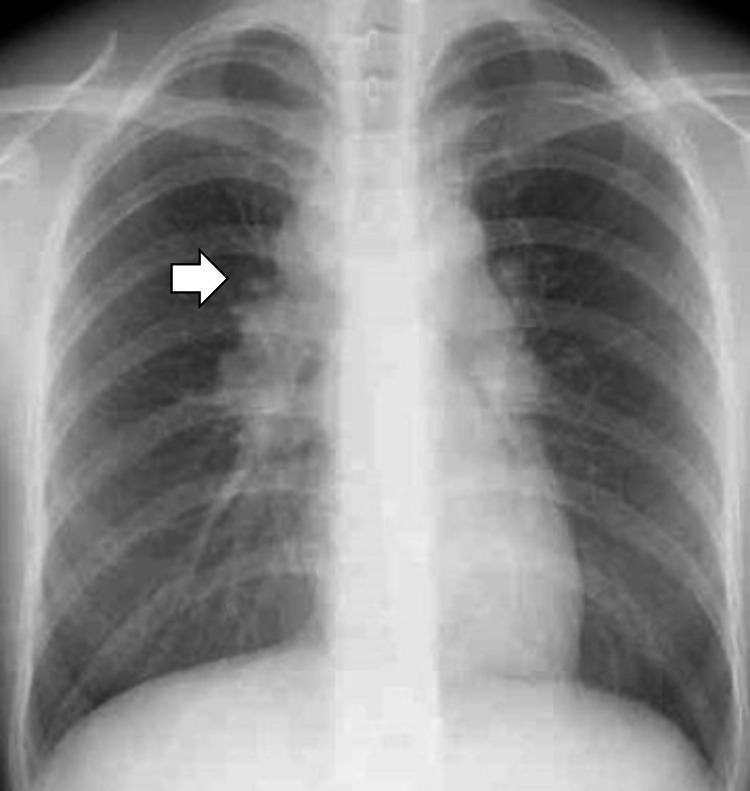
A posteroanterior (PA) chest radiograph demonstrating bilateral hilar enlargement, a classic radiological sign often associated with Stage I sarcoidosis. The image shows well-defined, lobulated opacities in both the left and right hilar regions, representing hilar lymphadenopathy. A white arrow specifically highlights the right hilar adenopathy. The lung parenchyma appears relatively clear with no obvious interstitial markings or focal consolidations. The mediastinal contour is slightly widened, likely due to paratracheal lymphadenopathy. Heart size is within normal limits, and the costophrenic angles are sharp, indicating no pleural effusion. The trachea is midline, and the bony structures, including the clavicles and ribs, appear intact. This diagnostic image is a key educational example for medical students learning the differential diagnosis of bilateral hilar lymphadenopathy, which includes sarcoidosis, lymphoma, and certain infections.
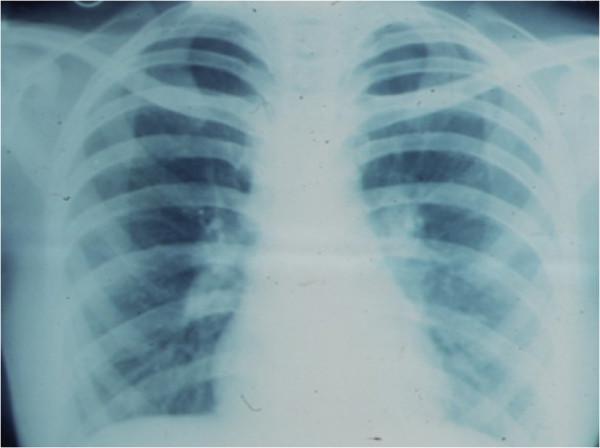
This diagnostic image is an anteroposterior chest X-ray demonstrating a classic presentation of bilateral hilar lymphadenopathy. The primary finding is the symmetrical enlargement of the hilar regions, appearing as lobulated, increased-density masses where the major bronchi and pulmonary vessels enter the lung parenchyma. This 'potato-node' appearance is a hallmark of pulmonary sarcoidosis. The lung fields are generally clear without obvious parenchymal infiltrates or consolidation, though the hilar margins are ill-defined due to the lymphatic enlargement. The mediastinal borders are slightly widened, but the cardiac silhouette and diaphragmatic contours remain distinguishable. The ribcage and clavicles are visualized and provide anatomical orientation. Clinically, this imaging is characteristic of Stage I sarcoidosis, often used to evaluate systemic granulomatous disease in both radiology and internal medicine education.
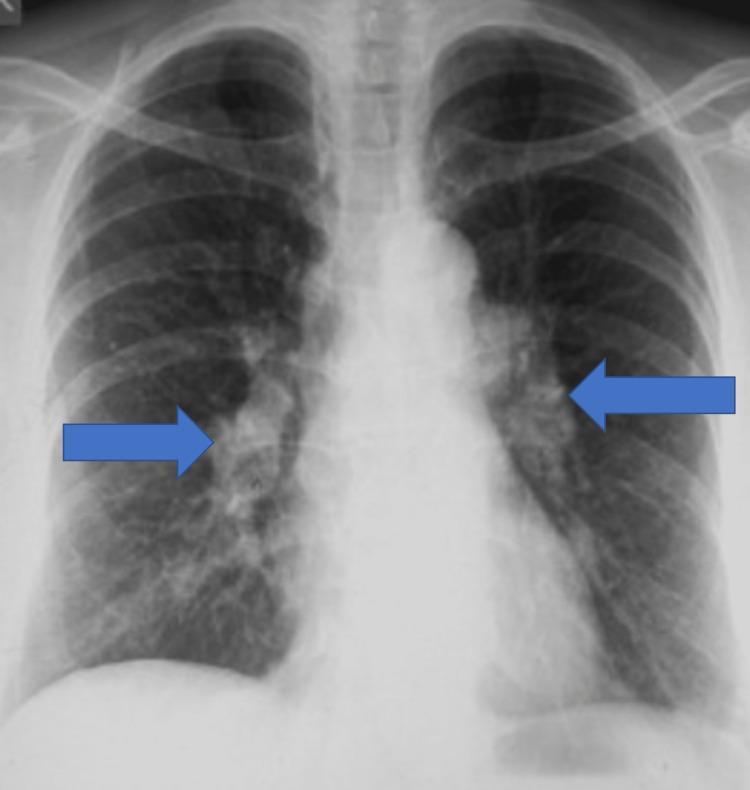
This diagnostic image is a posteroanterior (PA) chest radiograph demonstrating bilateral hilar lymphadenopathy. Two prominent blue arrows indicate symmetrical enlargement of the lymph nodes in the right and left hilar regions. These enlarged nodes appear as lobulated, increased opacities with well-defined lateral borders, typical of the 'potato nodes' appearance often seen in sarcoidosis. The lung parenchyma appears relatively clear with no visible consolidation, nodules, or interstitial thickening. The mediastinal silhouette is intact, although the paratracheal regions should be evaluated for concomitant adenopathy. The cardiac shadow is within normal limits in size and contour, and the costophrenic angles are sharp, indicating no pleural effusion. This radiographic presentation is a classic finding for Stage I sarcoidosis, providing a key diagnostic feature for medical students and clinicians in identifying granulomatous diseases or lymphoma. The clinical significance lies in recognizing the symmetrical distribution, which helps differentiate sarcoidosis from asymmetrical or unilateral causes of hilar enlargement such as malignancy or tuberculosis.
IPF usual interstitial pneumonia honeycombing traction bronchiectasis HRCT basal
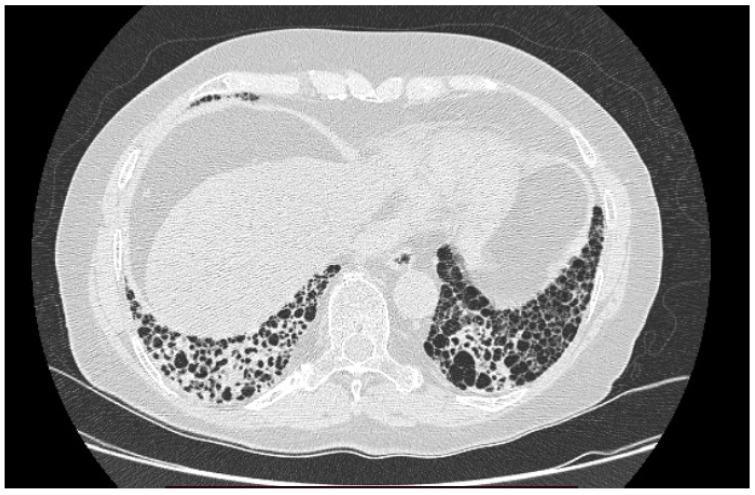
High-resolution computed tomography (HRCT) axial section of the thorax demonstrating a definitive Usual Interstitial Pneumonia (UIP) pattern in a patient with Idiopathic Pulmonary Fibrosis (IPF). The image reveals classic radiologic hallmarks of advanced interstitial lung disease, primarily characterized by extensive honeycombing. These cystic airspaces are predominantly subpleural and basal in distribution, appearing as clustered, thick-walled, lucent cavities of varying sizes. Associated reticular opacities and architectural distortion of the lung parenchyma are evident, indicating chronic fibrotic changes. Traction bronchiectasis may be inferred from the irregular airway dilatation within the fibrotic zones. The mediastinal structures appear grossly normal. This visual presentation is highly characteristic of restrictive lung disease, which clinically correlates with impaired gas exchange and reduced lung compliance.
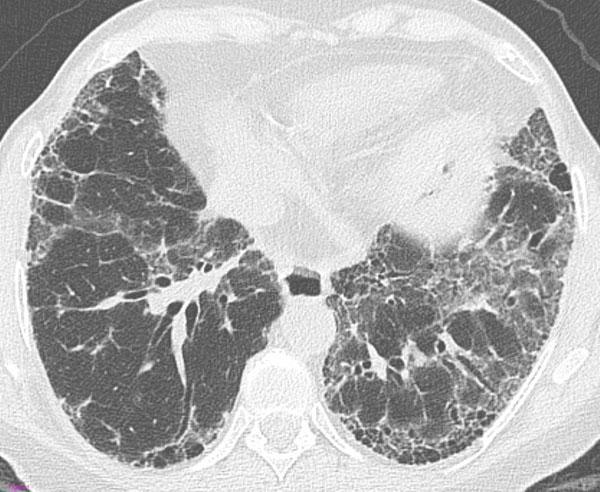
This transverse High-Resolution Computed Tomography (HRCT) axial scan of the thorax demonstrates a 'definite Usual Interstitial Pneumonia (UIP)' pattern, a hallmark of Idiopathic Pulmonary Fibrosis (IPF). The image shows bilateral, predominantly subpleural and basal lung involvement. Key diagnostic features include honeycombing—manifesting as clustered cystic airspaces with thick walls—which is particularly evident in the subpleural region of the left lung. Associated findings include a prominent reticular pattern, traction bronchiectasis (dilatation of bronchi within the fibrotic areas), and mild ground-glass opacities. The distribution is peripheral and basal-predominant, which is characteristic of the ATS/ERS/JRS/ALAT guidelines for diagnosing UIP. This imaging is crucial for medical students and radiologists to distinguish between different patterns of interstitial lung disease (ILD), specifically identifying the architectural distortion and honeycombing required for a definite diagnosis of UIP versus non-specific interstitial pneumonia (NSIP).
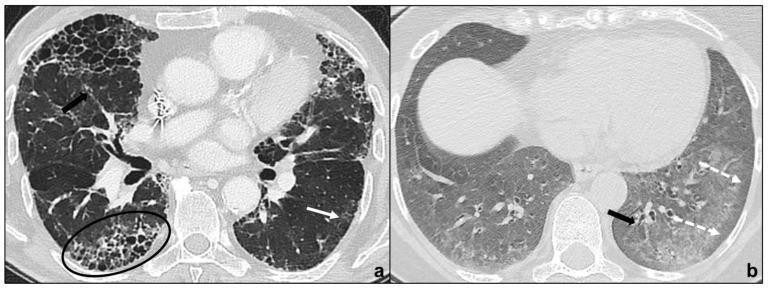
This diagnostic image consists of two high-resolution computed tomography (HRCT) axial scans of the chest demonstrating chronic fibrosing idiopathic interstitial pneumonias (IIPs). Panel (a) illustrates a Usual Interstitial Pneumonia (UIP) pattern, characterized by significant architectural distortion, irregular reticular opacities, and prominent macrocystic honeycombing in the basal and subpleural regions (indicated by a black oval). Traction bronchiectasis is visible (black arrow), along with limited, non-prevalent ground-glass opacities (white arrow). Panel (b) illustrates a Non-Specific Interstitial Pneumonia (NSIP) pattern. This is characterized by bilateral, diffuse, and basal ground-glass opacities. A key diagnostic feature shown is the relative sparing of the subpleural pulmonary parenchyma (indicated by white dotted arrows). Additional findings in panel (b) include irregular reticular opacities and traction bronchiectasis (black arrow). These images serve as a comparative educational resource for identifying radiological hallmarks that differentiate IPF/UIP from NSIP, focusing on the distribution of fibrosis, the presence of honeycombing, and subpleural sparing.
Interstitial Lung Disease (ILD) - A Complete Guide
PART 1 - What Is ILD?
- Progressive exertional dyspnoea (cardinal symptom)
- Dry, non-productive cough
- Fine bibasal crepitations ("Velcro crackles") on auscultation
- Clubbing (particularly in IPF)
- Hypoxemia - initially on exertion, then at rest
PART 2 - Classification of ILD
Goldman-Cecil Classification (2025)
ILD
├── IDIOPATHIC INTERSTITIAL PNEUMONIAS (IIPs)
│   ├── Chronic Fibrosing
│   │   ├── Idiopathic Pulmonary Fibrosis (IPF)
│   │   └── Nonspecific Interstitial Pneumonia (NSIP)
│   ├── Smoking-Related
│   │   ├── Respiratory Bronchiolitis-ILD (RB-ILD)
│   │   └── Desquamative Interstitial Pneumonia (DIP)
│   ├── Acute/Subacute
│   │   ├── Cryptogenic Organizing Pneumonia (COP)
│   │   └── Acute Interstitial Pneumonia (AIP)
│   └── Rare: LIP, PPFE, AFOP
│
├── CONNECTIVE TISSUE DISEASE-ASSOCIATED ILD (CTD-ILD)
│   ├── Systemic Sclerosis (most common)
│   ├── Rheumatoid Arthritis
│   ├── SLE
│   ├── Polymyositis/Dermatomyositis
│   ├── Sjögren Syndrome
│   └── Mixed CTD
│
├── HYPERSENSITIVITY PNEUMONITIS (HP)
│   ├── Farmer's lung, Bird fancier's lung, etc.
│
├── DRUG-INDUCED ILD
│   └── Amiodarone, methotrexate, nitrofurantoin, bleomycin
│
├── OTHER SPECIFIC FORMS
│   ├── Sarcoidosis
│   ├── Langerhans Cell Histiocytosis
│   └── Lymphangioleiomyomatosis (LAM)
│
└── INHERITED FORMS
    └── Familial IPF, Tuberous sclerosis, Niemann-Pick, Gaucher
- Goldman-Cecil Medicine, Table 80-1
PART 3 - HRCT Patterns in ILD (The Radiological Language)
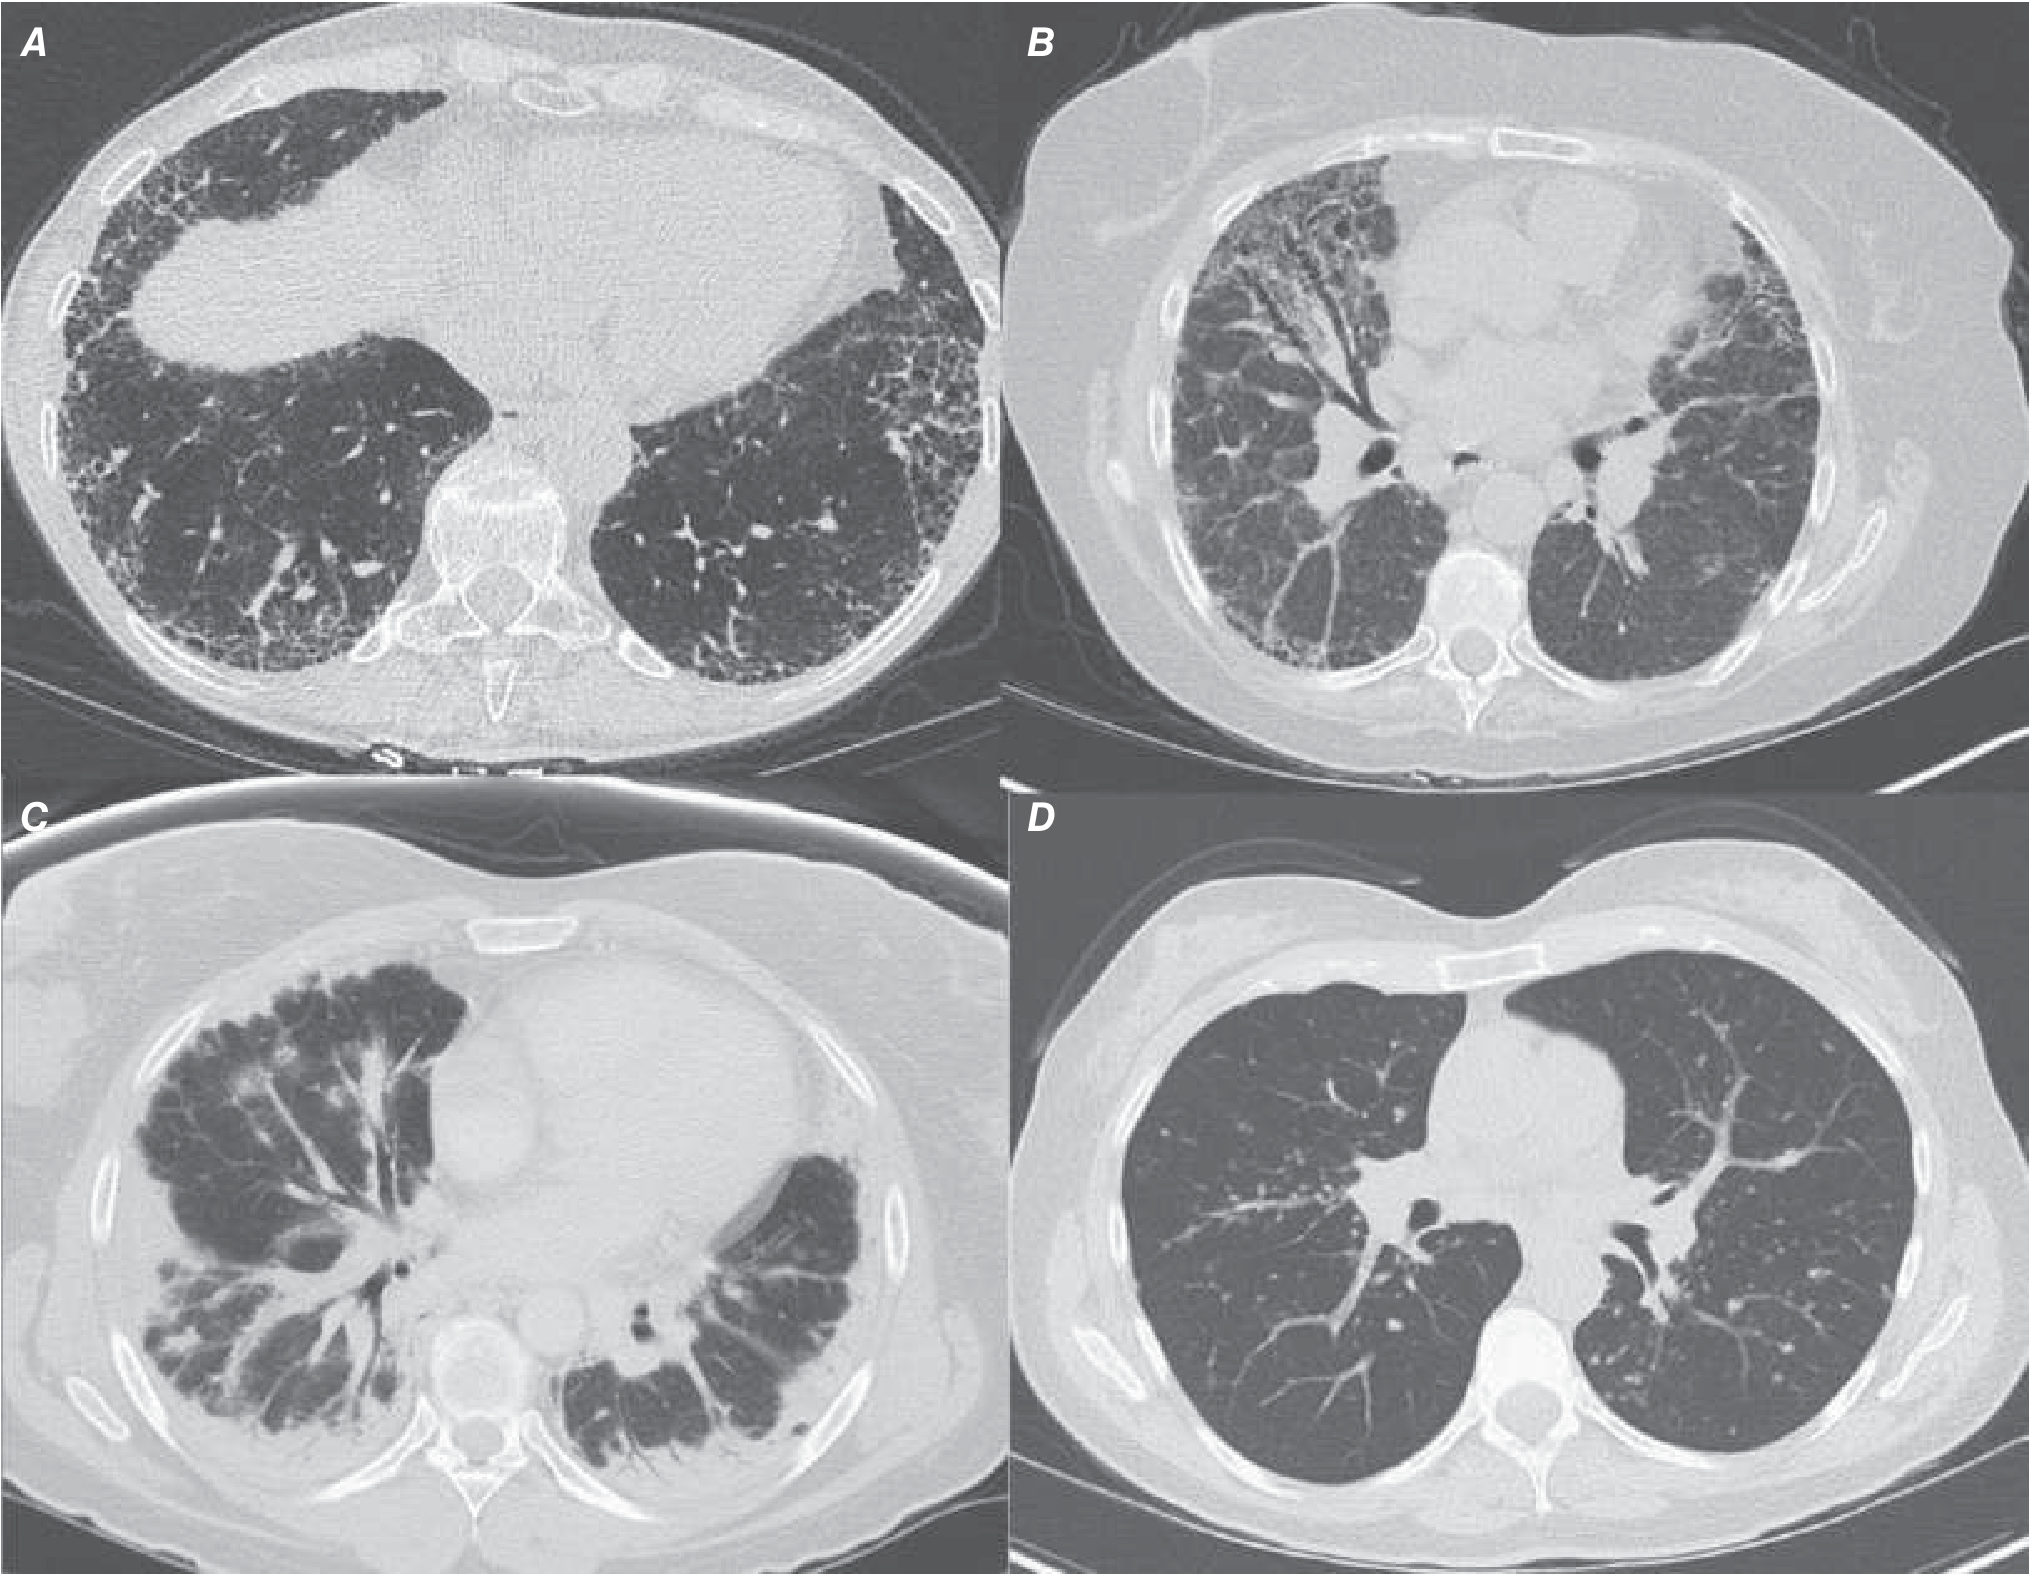
Key HRCT Terms
| Term | Appearance | Meaning |
|---|---|---|
| Ground-glass opacity (GGO) | Hazy increased density; vessels still visible | Active inflammation, potentially reversible |
| Reticulation | Network of fine lines | Interstitial thickening; often fibrotic |
| Honeycombing | Clustered cystic spaces with thick walls, subpleural | Established, irreversible fibrosis |
| Traction bronchiectasis | Irregular airway dilation within fibrotic tissue | Advanced fibrosis pulling airways open |
| Consolidation | Dense opacity obscuring vessels | Air-space filling |
| Nodules | Discrete opacities | Granulomas, metastases, infections |
| Mosaic attenuation | Geographic patchy density differences | Air trapping (small airway disease) |
| Septal thickening | Visible interlobular septa | Lymphangitis, edema, early fibrosis |
PART 4 - Idiopathic Pulmonary Fibrosis (IPF)
The Most Important ILD to Know
Epidemiology
- Prevalence: 50-200 per 100,000
- Men > Women
- Age: 5th-6th decade and beyond
- Strong association with cigarette smoking and environmental exposures (agriculture, metal dust, wood dust)
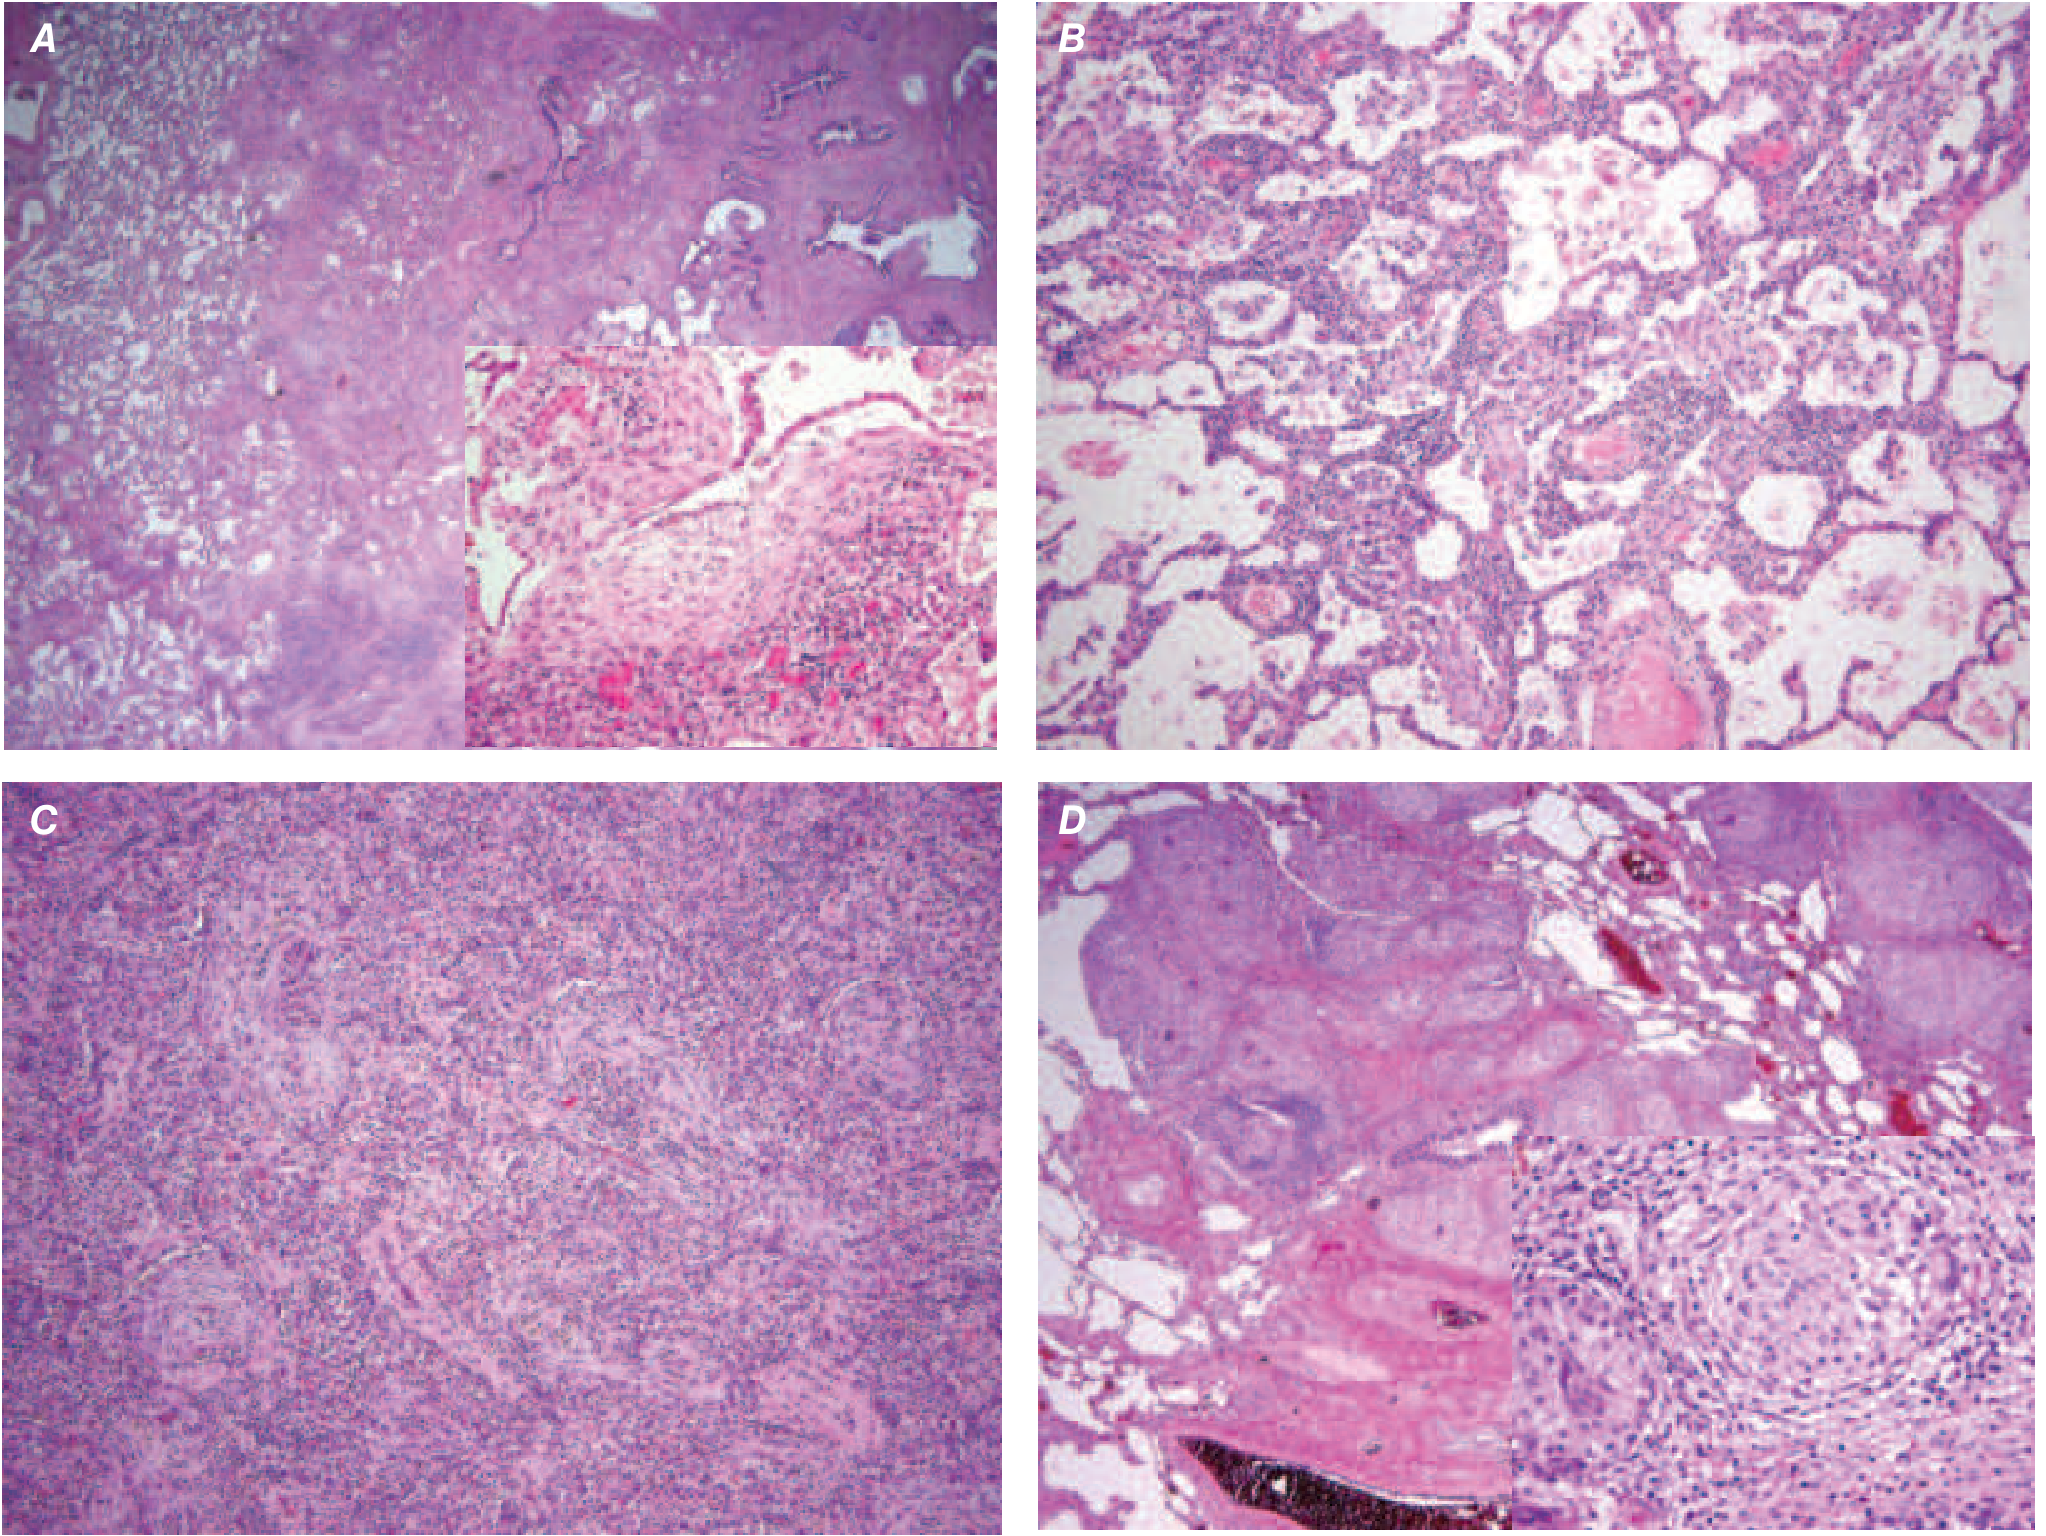
Pathology - UIP Pattern
- Temporal and spatial heterogeneity - areas of dense fibrosis alternating with normal lung (very characteristic)
- Honeycombing - clustered cystic spaces
- Fibroblast foci - subepithelial collections of myofibroblasts and collagen (the active edge of fibrosis)
- Subpleural and basal predominance
HRCT - Definite UIP Pattern (Can diagnose IPF without biopsy)
- Bilateral, subpleural, basal predominant reticulation
- Honeycombing (with or without traction bronchiectasis)
- Absent: extensive GGO, micronodules, upper or mid-lung predominance, peribronchovascular distribution
PFT in IPF
- Restrictive: FVC ↓, TLC ↓, FEV1/FVC normal or ↑
- DLCO ↓↓ (often out of proportion to spirometry - first abnormality to appear)
- 6-minute walk distance ↓, desaturation on exercise
Diagnosis Algorithm
- Exclude CTD (autoantibodies), drugs, occupational exposure
- HRCT - if definite UIP = diagnose IPF
- If indeterminate HRCT - bronchoscopy (BAL + transbronchial biopsy)
- If still uncertain - surgical lung biopsy (VATS)
- MDT discussion (pulmonologist + radiologist + pathologist)
Treatment
- Nintedanib - tyrosine kinase inhibitor (inhibits FGFR, VEGFR, PDGFR); slows FVC decline; main side effect = diarrhea (>60%)
- Pirfenidone - inhibits TGF-β-stimulated fibroblast proliferation and collagen production; slows FVC decline and reduces mortality; main side effects = photosensitivity, GI upset, fatigue
- Oxygen supplementation (when SpO2 <88%)
- Pulmonary rehabilitation
- Manage comorbid pulmonary hypertension (with caution - riociguat caused harm)
- Lung transplantation: only proven survival benefit; bilateral > unilateral
-
Acute onset (<30 days) of respiratory distress on background of IPF
-
HRCT: new bilateral GGO/consolidation superimposed on UIP
-
Mortality >85%
-
Treatment: supportive; mechanical ventilation only as bridge to transplant; nintedanib may reduce exacerbation rate
-
Harrison's Principles, p. 2305-2306
-
Fishman's Pulmonary, p. 3993-4000
PART 5 - Nonspecific Interstitial Pneumonia (NSIP)
The "Steroid-Responsive Counterpart" to IPF
- Second most common IIP
- Mostly women, non-smokers, 5th decade
- Strong association with CTD (especially scleroderma, myositis)
- Positive autoantibodies in many "idiopathic" cases
- Better prognosis than IPF: 5-year survival >80%
Histology
- Uniform interstitial inflammation and fibrosis (temporal and spatial homogeneity - the opposite of IPF)
- Honeycomb changes absent; fibroblast foci rare
- Two subtypes: Cellular NSIP (more inflammation, better steroid response) and Fibrotic NSIP (more collagen, less reversible)
HRCT
- Bilateral, symmetric, lower zone ground-glass and reticular opacities
- Subpleural sparing (pathognomonic when present - the alveoli just under the pleura are spared)
- Traction bronchiectasis and volume loss in lower zones
- Honeycombing uncommon
Treatment
- Immunosuppression: prednisone + mycophenolate / azathioprine / cyclophosphamide
- Biologics for refractory: rituximab, tocilizumab
- If progressive fibrosis: antifibrotic therapy (nintedanib increasingly used)
PART 6 - Cryptogenic Organizing Pneumonia (COP)
Key Facts
- Subacute onset over weeks to months
- Flu-like prodrome, then cough + dyspnoea
- Often misdiagnosed as pneumonia (does not respond to antibiotics)
- Responds dramatically to steroids - "melts away"
Histology
- Masson bodies: plugs of organizing granulation tissue filling alveolar ducts, alveoli, and small airways
- Surrounding wall inflammation
- Preserved lung architecture (no honeycombing)
HRCT
- Patchy bilateral peribronchovascular or subpleural consolidation - often migratory
- Reversed halo (atoll) sign: consolidation surrounding a central GGO - highly specific for COP
- Lower lobe predominance
- Sometimes a "band-like" peribronchovascular distribution
Treatment
- Prednisone 0.5-1 mg/kg/day for 3-6 months, then taper
- Dramatic response expected; relapses common on taper
- Good long-term prognosis in most cases
PART 7 - Smoking-Related ILD
Respiratory Bronchiolitis-ILD (RB-ILD)
- Active smokers, age 40-50
- Pigmented macrophages accumulating in respiratory bronchioles
- HRCT: centrilobular nodules, GGO, bronchial wall thickening
- Treatment: Smoking cessation - often sufficient
Desquamative Interstitial Pneumonia (DIP)
- Heavy smokers; also seen in familial pulmonary fibrosis
- Diffuse accumulation of pigmented macrophages in alveoli ("desquamation" - misnomer)
- HRCT: diffuse bilateral GGO (more extensive than RB-ILD)
- Treatment: smoking cessation + steroids if persistent
Pulmonary Langerhans Cell Histiocytosis (PLCH)
- Young, heavy smokers (25-40 years)
- Langerhans cell granulomas centered on small airways
- HRCT: Upper lobe cysts and nodules (characteristic - opposite distribution to IPF)
- Treatment: smoking cessation; variable response to steroids
Acute Interstitial Pneumonia (AIP) (Hamman-Rich Syndrome)
- Idiopathic equivalent of ARDS
- Rapid-onset respiratory failure
- Histology: Diffuse Alveolar Damage (DAD)
- HRCT: bilateral diffuse GGO and consolidation
- Treatment: supportive (mechanical ventilation); no proven drug therapy; steroids often given
- Mortality: very high (>50%)
PART 8 - Sarcoidosis
The Great Mimicker
Histology
- Non-caseating (non-necrotizing) granulomas - tightly packed epithelioid histiocytes + giant cells, with a rim of lymphocytes
- If you see caseation, think TB first!
- Granulomas follow lymphatic routes (peribronchial, subpleural, along fissures)
Radiological Staging (Scadding Classification)
| Stage | CXR Findings | Spontaneous Remission |
|---|---|---|
| 0 | Normal CXR | - |
| I | Bilateral hilar lymphadenopathy (BHL) only | 60-80% |
| II | BHL + pulmonary infiltrates | 50-60% |
| III | Pulmonary infiltrates only (no LN) | 10-20% |
| IV | Advanced fibrosis, bullae, distortion | <5% (irreversible) |
HRCT
- Bilateral hilar and mediastinal lymphadenopathy
- Perilymphatic nodules along bronchovascular bundles, fissures, and pleura
- Upper and mid-lung zone predominance (opposite of IPF)
- In advanced disease: conglomerate masses, upper lobe fibrosis, traction bronchiectasis
Clinical Features
- Often asymptomatic (found incidentally on CXR)
- Cough, dyspnoea
- Lofgren syndrome (acute sarcoidosis): erythema nodosum + bilateral hilar LN + arthralgia + fever - excellent prognosis, usually resolves spontaneously
- Extrapulmonary: eyes (uveitis), skin (lupus pernio), heart (arrhythmia, heart block), CNS (cranial nerve palsy), bones, liver, spleen
- Hypercalcemia (granulomas produce 1,25-OH vitamin D)
- Elevated ACE (serum angiotensin-converting enzyme) - useful but not specific or sensitive
BAL Findings
- Lymphocytosis with elevated CD4:CD8 ratio >3.5 (highly suggestive of sarcoidosis)
Treatment
- Stage I and II with no symptoms: observe - most remit spontaneously
- Indications for treatment: progressive PFT decline, symptomatic, cardiac/neuro/eye/renal involvement, hypercalcemia
- Prednisone 20-40 mg/day for 3 months, then taper over 9-12 months
- Relapse rate on stopping: 30-80%
- Steroid-sparing agents: methotrexate, azathioprine
- Refractory: infliximab (anti-TNF)
- Goldman-Cecil Medicine, p. 983-984
PART 9 - Hypersensitivity Pneumonitis (HP)
The Allergy of the Alveolus
Common Causes
| Disease | Antigen | Source |
|---|---|---|
| Farmer's lung | Thermophilic actinomycetes, Faeni rectovirgula | Moldy hay, silage, grain |
| Bird fancier's lung | Bird serum/droppings proteins | Pigeons, parakeets, poultry |
| Humidifier lung | Thermoactinomyces vulgaris | Air-conditioning, humidifiers |
| Hot tub lung | Mycobacterium avium complex | Contaminated hot tubs |
| Bagpipe/trombone lung | Fusarium, Candida, Penicillium spp | Instrument reservoirs |
| Metalworking fluid lung | M. immunogenum, Pseudomonas | Industrial metalworking fluid |
| Cheese washer's lung | Penicillium casei | Cheese |
| Mushroom worker's lung | Thermoactinomyces sacchari | Mushroom compost |
Immunopathology
- Type III (immune complex): precipitating IgG antibodies (precipitins) in serum; complement activation in vessel walls
- Type IV (cell-mediated): CD4+ and CD8+ T lymphocytes in BAL; non-caseating granulomas in 2/3 of patients
- BAL: marked lymphocytosis (CD4:CD8 low or reversed - opposite to sarcoidosis)
Phases and Histology
| Phase | Time after exposure | Histology |
|---|---|---|
| Acute | Hours-days | Alveolar damage, neutrophil infiltration |
| Subacute | Weeks-months | Interstitial pneumonitis (lymphocytes, plasma cells), non-caseating granulomas, bronchiolocentric |
| Chronic/Fibrotic | Years | Fibrosis (UIP or NSIP pattern), honeycombing, obliterative bronchiolitis |
Clinical Presentation
- 4-8 hours after antigen exposure
- Fever, chills, malaise, cough, dyspnoea
- Resembles "flu"
- Resolves 24-48 hours after leaving the exposure
- Insidious, progressive dyspnoea and cough
- Often no acute episodes
- May closely mimic IPF (if the antigen exposure is not identified)
HRCT
- Subacute: GGO, centrilobular nodules, mosaic attenuation (air trapping), no lower zone predominance
- Chronic/Fibrotic: Fibrosis (UIP or NSIP pattern) + signs that suggest HP: upper/mid lobe distribution, relative sparing of lower zones, lobular areas of decreased attenuation (air trapping), mosaic pattern
Diagnosis
- History of exposure (most important - must ask specifically about birds, hot tubs, work environment)
- Serum precipitins (specific IgG antibodies) against the offending antigen
- HRCT (as above)
- BAL: lymphocytosis, low CD4:CD8
- Challenge test or inhalation provocation (rarely needed)
- Biopsy if uncertain
Treatment
- Remove the antigen - the most important step and can prevent progression to fibrosis
- Acute: corticosteroids (prednisone) speed recovery
- Chronic fibrotic HP: similar to IPF management (antifibrotics increasingly used)
- Prognosis depends entirely on whether antigen exposure is eliminated
PART 10 - CTD-Associated ILD
Which CTD Has the Most ILD?
| CTD | ILD prevalence | Most common histological pattern |
|---|---|---|
| Systemic Sclerosis (SSc) | 50% diffuse, 30% limited | NSIP (most common), also UIP |
| Polymyositis/Dermatomyositis | 30-40% | NSIP, also COP |
| Rheumatoid Arthritis (RA) | 10-30% | UIP (often indistinguishable from IPF) |
| Sjögren Syndrome | 10-25% | LIP (lymphoid interstitial pneumonia) |
| SLE | <10% clinically significant | NSIP, DAD, COP |
| Mixed CTD | 50-67% | NSIP |
Key Clinical Points
- ILD may precede extrapulmonary CTD features by years
- Screen all CTD patients with HRCT and PFT regularly
- In SSc: also check for pulmonary arterial hypertension (PAH) - which has an ISOLATED DLCO reduction
- Antisynthetase antibodies (anti-Jo-1) are strongly associated with ILD in myositis
Treatment of CTD-ILD
- Immunosuppression: prednisone + mycophenolate mofetil (preferred) or azathioprine or cyclophosphamide
- Rituximab for refractory cases
- Nintedanib was approved for systemic sclerosis-ILD (SSc-ILD) based on the SENSCIS trial
- Lung transplantation in end-stage disease
PART 11 - Drug-Induced ILD
| Drug | Pattern | Notes |
|---|---|---|
| Amiodarone | NSIP, COP, DAD | Most common; check CXR/HRCT at baseline and annually |
| Methotrexate | HP-like, COP | Usually reversible on stopping |
| Bleomycin | NSIP, DAD | Dose-dependent; avoid high FiO2 (worsens) |
| Nitrofurantoin | Acute: DAD; Chronic: NSIP | Two distinct syndromes |
| Immunotherapy (checkpoint inhibitors) | Pneumonitis | Increasingly common; may be severe |
| Radiation | Radiation pneumonitis → fibrosis | Confined to radiation field |
PART 12 - Rare ILDs Worth Knowing
Lymphangioleiomyomatosis (LAM)
- Exclusively premenopausal women
- Mutation in TSC1/TSC2 gene; associated with tuberous sclerosis
- Abnormal smooth muscle proliferation along lymphatics
- HRCT: Bilateral diffuse thin-walled cysts (different from honeycombing)
- Presentations: pneumothorax (recurrent!), chylothorax, dyspnoea
- Treatment: Sirolimus (mTOR inhibitor) slows progression
Pulmonary Alveolar Proteinosis (PAP)
- Accumulation of surfactant-like material in alveoli
- CXR/HRCT: "bat-wing" or "crazy paving" pattern (GGO + interlobular septal thickening)
- Treatment: whole-lung lavage
Goodpasture Syndrome
- Anti-GBM antibodies attack alveolar and glomerular basement membranes
- Pulmonary hemorrhage + rapidly progressive glomerulonephritis
- Hemoptysis is a key feature (unlike most ILDs)
- DLCO paradoxically elevated (blood in alveoli absorbs CO)
- Treatment: plasmapheresis + immunosuppression
PART 13 - Diagnostic Approach to ILD
Step-by-Step
Step 1: HISTORY
  - Duration and pace (acute/subacute/chronic)
  - Occupational: dust, birds, mold, metal, chemicals
  - Medications, radiation, smoking
  - Autoimmune symptoms: joint pain, Raynaud's, skin changes, sicca, myositis
  - Family history

Step 2: EXAMINATION
  - Velcro crackles (bibasal)
  - Clubbing (IPF > others)
  - Signs of CTD: arthritis, skin thickening, telangiectasia, myositis

Step 3: INVESTIGATIONS
  - CXR (initial, often non-specific)
  - HRCT chest (most important imaging)
  - PFT: restrictive pattern + DLCO ↓
  - Bloods: FBC, LFTs, U&E, CRP, ESR
  - Autoimmune screen: ANA, RF, anti-CCP, anti-Scl70, anti-Jo-1, anti-dsDNA, myositis panel
  - Serum precipitins (if HP suspected)
  - 6-minute walk test (exercise capacity)

Step 4: BRONCHOSCOPY (if diagnosis unclear)
  - BAL: cell differential
    · Lymphocytosis → sarcoidosis, HP, NSIP, COP
    · Neutrophilia → IPF, infection
    · Eosinophilia → eosinophilic pneumonia
    · Hemosiderin-laden macrophages → alveolar hemorrhage
  - Transbronchial biopsy (good for sarcoidosis, less useful for fibrotic ILD)

Step 5: SURGICAL BIOPSY (if still uncertain)
  - VATS (video-assisted thoracoscopic surgery) biopsy
  - Multiple biopsies from different lobes
  - Avoid areas of dense fibrosis (sample the "active edge")
  - MDT discussion: pulmonologist + radiologist + pathologist
BAL Cell Differential Clues
| Cell Predominance | Think |
|---|---|
| Lymphocytes (>15%) | Sarcoidosis (CD4:CD8 ↑), HP (CD4:CD8 ↓), NSIP, COP |
| Neutrophils | IPF, infection, acute HP, ARDS |
| Eosinophils | Eosinophilic pneumonia, drug reaction |
| Macrophages with lipid | Aspiration, DIP, RB-ILD |
| Hemosiderin macrophages | Alveolar hemorrhage, Goodpasture, vasculitis |
PART 14 - PFT Summary in ILD
| Condition | FVC | TLC | DLCO | Special Note |
|---|---|---|---|---|
| IPF | ↓↓ | ↓↓ | ↓↓ | DLCO often disproportionately low |
| NSIP | ↓ | ↓ | ↓ | Better preserved than IPF |
| Sarcoidosis | ↓ (variable) | ↓ | ↓ | Can also have obstruction (endobronchial) |
| HP (chronic) | ↓ | ↓ | ↓ | Obstruction possible (air trapping) |
| COP | ↓ | ↓ | ↓ | Dramatic improvement with steroids |
| LAM | ↓ + obstruction | ↑ RV | ↓ | Mixed pattern; cysts trap air |
| SSc-ILD | ↓ | ↓ | ↓ | Isolated DLCO ↓ may indicate PAH |
Quick Memory Anchors
| Finding | Disease |
|---|---|
| Velcro crackles + clubbing + basilar honeycombing + male smoker >60 | IPF |
| Young woman + recurrent pneumothorax + diffuse lung cysts | LAM |
| Farmer / bird keeper + acute flu-like illness after exposure | HP |
| Bilateral hilar LN + non-caseating granulomas + erythema nodosum | Sarcoidosis Stage I / Lofgren |
| Non-smoker female + GGO + subpleural sparing + positive ANA | CTD-ILD (NSIP pattern) |
| Consolidation that doesn't respond to antibiotics | COP |
| Young heavy smoker + upper lobe cysts + nodules | PLCH |
| Pulmonary hemorrhage + nephritis | Goodpasture / ANCA vasculitis |
| Amiodarone use + new opacities | Drug-induced ILD |
| Scleroderma patient with low DLCO out of proportion to FVC | Pulmonary Arterial Hypertension complicating SSc-ILD |
- Harrison's Principles of Internal Medicine 22e, Ch. 304
- Goldman-Cecil Medicine, Ch. 80-83
- Murray & Nadel's Respiratory Medicine, Chs. 91-92
- Fishman's Pulmonary Diseases, Chs. 10-11
- Robbins & Cotran Pathologic Basis of Disease, Ch. 15