
• IVS Motion Jerky • • • • Borderline LV Systolic Function Grade I LV Diastolic Dysfunction RVSP Normal No Pericardial Effusion
echocardiography findings IVS jerky motion borderline LV systolic function grade 1 diastolic dysfunction clinical significance
echocardiography diastolic dysfunction grade 1 impaired relaxation transmitral Doppler E/A
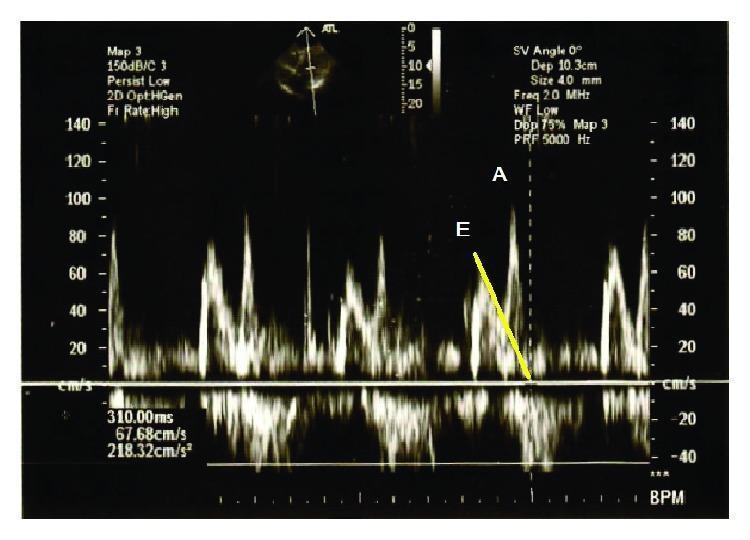
This diagnostic image shows a pulsed-wave Doppler spectral tracing used in echocardiography to evaluate left ventricular diastolic function. The spectral display plots blood flow velocity (y-axis, cm/s) against time (x-axis), demonstrating the characteristic transmitral flow profile. Two distinct positive peaks are labeled: the 'E' wave, representing early diastolic filling, and the 'A' wave, representing late diastolic filling during atrial contraction. In this tracing, the E/A ratio is less than 1 (E < A), which is indicative of impaired myocardial relaxation. A yellow superimposed line on the downslope of the E wave highlights the Deceleration Time (DT), measured here as 310 ms. The prolongation of the DT and the inverted E/A ratio are key diagnostic markers for Grade I diastolic dysfunction. Measurement readouts also include a peak velocity of 67.68 cm/s and an acceleration rate of 218.32 cm/s^2. A small 2D reference ultrasound image is visible at the top, showing the sampling volume placement.
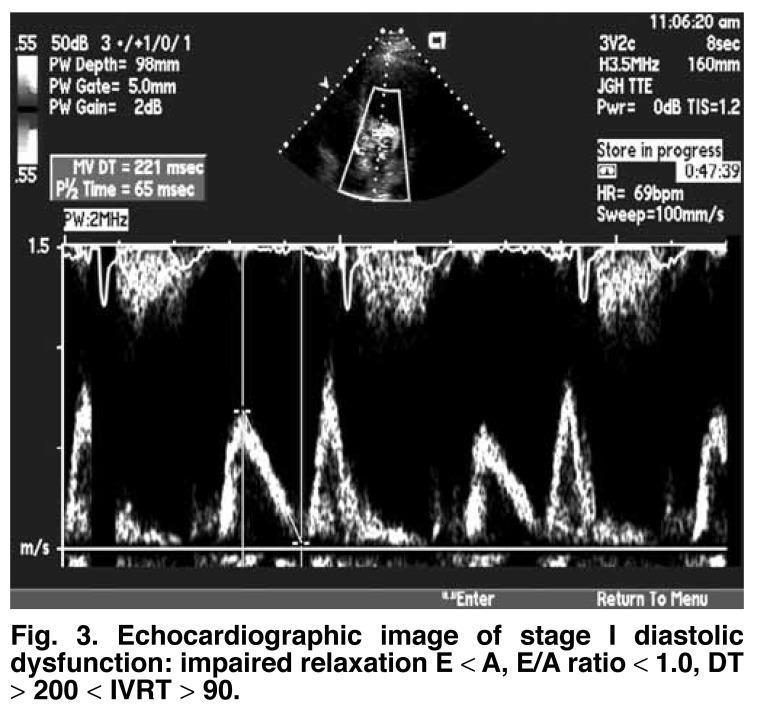
This diagnostic image is a transthoracic pulse-wave (PW) Doppler echocardiogram demonstrating transmitral inflow velocities. The spectral tracing illustrates a classic 'impaired relaxation' filling pattern characteristic of Grade I diastolic dysfunction. Key visible features include a reversal of the normal E/A ratio, where the E-wave (early diastolic filling velocity) is noticeably smaller than the A-wave (late diastolic atrial contraction velocity), resulting in an E/A ratio < 1.0. Quantitative measurements displayed on the screen include a prolonged mitral valve deceleration time (MV DT) of 221 msec and a pressure half-time (P 1/2 Time) of 65 msec. The top portion of the display provides an anatomical reference in the apical four-chamber view, with the Doppler sample gate positioned at the mitral valve leaflets. Clinical parameters such as a heart rate (HR) of 69 bpm and a sweep speed of 100 mm/s are also recorded. This imaging study is essential for cardiologists and sonographers in assessing left ventricular compliance and filling pressures.
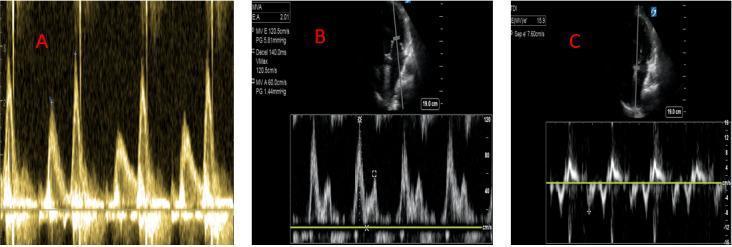
This diagnostic composite displays three panels (A, B, and C) of Doppler echocardiography findings used to assess left ventricular diastolic function. Panel A shows a pulsed-wave Doppler trace of mitral inflow with an inverted E/A ratio (E < A), characteristic of Grade 1 diastolic dysfunction (impaired relaxation). Panel B illustrates Grade 3 diastolic dysfunction (restrictive filling pattern) with a tall, narrow E wave and a markedly diminished A wave, resulting in an E/A ratio > 2.0. Panel C demonstrates tissue Doppler imaging (TDI) used to calculate the E/e' ratio. The spectral waveform shows a high-velocity E wave relative to a low-velocity e' (septal) wave, with an E/e' ratio > 15, which is clinically indicative of elevated left ventricular end-diastolic pressure (LVEDP). The grayscale inserts in B and C show the anatomical positioning of the sample volume within the four-chamber view of the heart. Key hemodynamic parameters displayed include peak velocities (Vmax), pressure gradients (PG), and deceleration time (Decel), which are essential for categorizing the severity of heart failure with preserved ejection fraction (HFpEF).
interventricular septal motion echocardiography M-mode
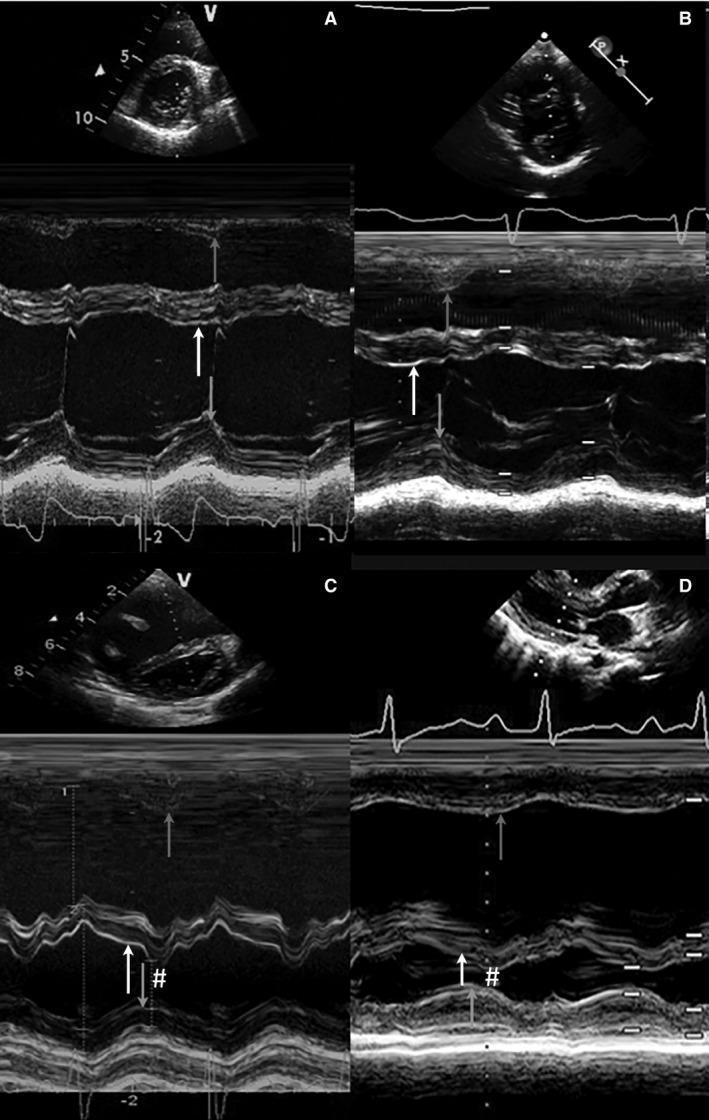
This composite diagnostic image displays four M-mode echocardiography panels (A, B, C, and D) used to evaluate interventricular septal (IVS) kinetics across different cardiac conditions. Each panel consists of a two-dimensional sector orientation image (top) and an M-mode tracing (bottom) showing the depth of cardiac structures over time. The tracings highlight the motion of the right ventricular free wall (RVFW), the IVS, and the left ventricular posterior wall (LVPW). Panel A represents a healthy control with normal, coordinated septal motion. Panel B shows pulmonary stenosis (PS), exhibiting delayed onset of contraction but maintaining relatively coordinated free wall motion. Panels C and D illustrate idiopathic pulmonary arterial hypertension (iPAH), characterized by significant mechanical discoordination. These pathological examples feature abnormal septal displacement marked by a '#' symbol, indicating paradoxical or leftward displacement toward the LVPW during early diastole and late systole. Arrows indicate the timing to peak radial motion, demonstrating the prolonged systolic contraction and delayed relaxation phases typical of right ventricular pressure overload. This visual comparison serves as an educational tool for identifying ventricular dyssynchrony and septal flattening in pulmonary hypertensive heart disease.
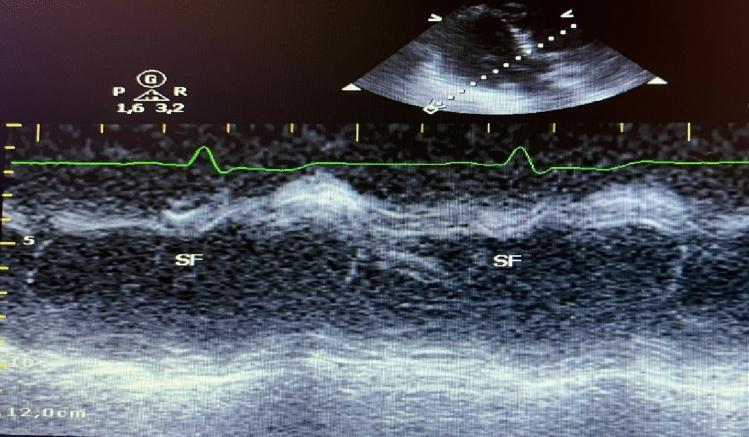
This diagnostic image displays a cardiac ultrasound featuring a dual-mode display: a parasternal long-axis view in 2D echocardiography (top) and a corresponding M-mode tracing (bottom). The M-mode captures the time-motion relationship of the interventricular septum and left ventricular walls. A green electrocardiogram (ECG) lead is superimposed over the M-mode to provide temporal synchronization with the cardiac cycle. The image specifically illustrates 'Septal Flash' (SF), marked with labels. This pathology is characterized by a rapid, pre-systolic inward motion of the interventricular septum, occurring immediately after the QRS complex on the ECG. This visual finding is a classic indicator of mechanical dyssynchrony, often associated with left bundle branch block (LBBB). The vertical axis indicates depth (up to 12.0 cm), while the horizontal axis demonstrates the progression through multiple cardiac cycles. This educational material is used to demonstrate the diagnostic utility of M-mode in identifying subtle wall motion abnormalities required for assessing candidates for Cardiac Resynchronization Therapy (CRT).
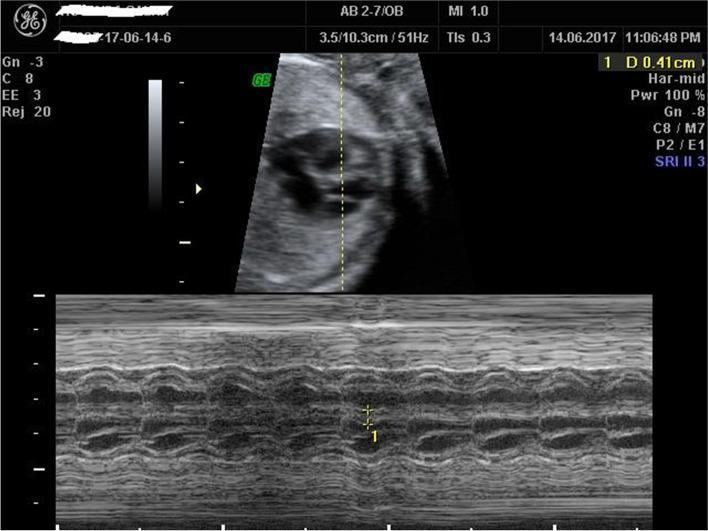
Fetal M-mode echocardiography used for the quantitative assessment of the heart. The image is split into two sections: the top displays a 2D B-mode ultrasound of the fetal thorax in a transverse four-chamber view. A vertical, dotted M-mode cursor is positioned perpendicularly across the interventricular septum (IVS), just distal to the atrioventricular valves. The bottom section displays the corresponding M-mode tracing, showing the motion of the cardiac structures over time. The IVS is visualized as a rhythmic, undulating hyperechoic structure. Calipers (labeled '1') are placed on the M-mode tracing to measure the interventricular septal thickness at end-diastole, recorded as 0.41 cm in the top-right metadata. This diagnostic technique is used to screen for fetal myocardial hypertrophy, which is defined as septal thickness exceeding two standard deviations for gestational age. The image demonstrates cardiac wall motion and structural thickness throughout the cardiac cycle, providing essential data for prenatal cardiovascular evaluation.
2D Echo / Echocardiography Report - Findings Explained
1. IVS Motion - Jerky
| Cause | Mechanism |
|---|---|
| Conduction defect (LBBB/RBBB) | Altered sequence of RV vs. LV contraction causes the septum to contract and relax out of step - classic "septal flash" in LBBB |
| RV pressure/volume overload | The septum moves toward the center of mass of the whole heart; when RV mass/volume is increased, this causes paradoxical or jerky septal motion |
| Post-cardiac surgery | Pericardial adhesions disrupt normal tethering |
| Pericardial constriction | Fixed total cardiac volume forces respiratory shifts in septal motion |
| Ischemia | Regional wall motion abnormality can make the septum appear jerky |
2. Borderline LV Systolic Function
| Category | LVEF |
|---|---|
| Normal | ≥ 55% |
| Borderline / Mildly Reduced | 50 - 54% |
| Mildly reduced | 41 - 49% |
| Moderately reduced | 30 - 40% |
| Severely reduced | < 30% |
- The heart is pumping adequately but not optimally
- This category carries increased long-term cardiovascular risk compared to a clearly normal EF (≥55%)
- It often coexists with diastolic dysfunction (as seen in this report)
- It warrants monitoring and risk factor modification - but does not by itself indicate heart failure requiring treatment
3. Grade I LV Diastolic Dysfunction
How it is graded (from the Textbook of Clinical Echocardiography):
| Grade | Pathophysiology | E/A Ratio | Deceleration Time | LVEDP |
|---|---|---|---|---|
| Normal | - | ≥ 0.8 | 150-200 ms | Normal |
| Grade I (Mild) | Impaired relaxation, normal filling pressure | < 0.8 | > 200 ms | Normal |
| Grade II (Moderate) | Impaired relaxation + elevated filling pressure | 0.8-2.0 (pseudonormal) | 150-200 ms | Elevated |
| Grade III (Severe) | Decreased compliance + very elevated pressure | ≥ 2.0 (restrictive) | < 150 ms | Very elevated |
- E wave < A wave (E/A ratio < 0.8): The ventricle fills more with the active "kick" from the atrium (A wave) than by passive early filling (E wave) - a reversal of the normal pattern
- Prolonged Deceleration Time (> 200 ms)
- Prolonged IVRT (≥ 100 ms)
- Left Atrial Pressure is NORMAL (this is what distinguishes Grade I from Grade II)
- Aging (most common - normal age-related stiffening)
- Hypertension (LVH causes impaired relaxation)
- Diabetes
- Coronary artery disease / ischemia
- Early cardiomyopathy
- Mostly asymptomatic at rest
- Patients may notice exercise intolerance or mild breathlessness with exertion
- Does not imply heart failure at this stage
- Approximately 76% of patients do not progress to higher grades
- Requires lifestyle modification and treatment of underlying causes (BP control, diabetes management, etc.)
4. RVSP Normal
RVSP = 4 × (TR velocity)² + estimated Right Atrial Pressure
- Rules out pulmonary hypertension - a potentially serious condition where the pulmonary arteries are under high pressure, placing strain on the right heart
- Reassuring finding, especially in a patient with borderline LV systolic function and Grade I diastolic dysfunction - elevated RVSP in that context would suggest the left heart dysfunction is already backing up pressure into the pulmonary circulation
- Makes RV pressure overload an unlikely cause of the jerky IVS motion
5. No Pericardial Effusion
- Rules out pericarditis, cardiac tamponade, or other pericardial pathology
- A completely reassuring finding
- Also means pericardial constriction is less likely as the cause of jerky IVS motion
Putting It All Together - Clinical Summary
| Finding | Significance | Reassuring or Concerning? |
|---|---|---|
| IVS Jerky Motion | Likely a conduction/electrical sequence issue; needs clinical correlation | Requires context |
| Borderline LV Systolic Function | Lower end of normal EF; monitor and treat risk factors | Mildly concerning |
| Grade I Diastolic Dysfunction | Mildest form; impaired relaxation, normal filling pressures | Mildly concerning |
| RVSP Normal | No pulmonary hypertension | ✅ Reassuring |
| No Pericardial Effusion | No fluid around heart | ✅ Reassuring |
- Treat underlying causes - optimal BP control, diabetes management, cholesterol management
- Lifestyle modification - regular moderate exercise, salt restriction, weight management
- Repeat echo in 1-2 years to monitor for progression
- ECG to look for conduction abnormalities explaining the jerky IVS motion
- Possibly a stress test if there are symptoms suggesting ischemia