
Why it’s needed to maintain concentration of ors as per blood osmolarity
oral rehydration solution osmolarity intestinal absorption
SGLT1 sodium glucose cotransporter intestinal absorption oral rehydration

This composite educational graphic details the physiological absorption and distribution of orally delivered glucose PET tracers (Me-4FDG, 2-FDG, and 4-FDG) in wild-type and Glut2−/− mouse models. Section A displays volumetric renderings of co-registered microPET and CT scans, utilizing the NIH intensity scale (red: highest; purple: lowest). Key landmarks include the brain (br), stomach (st), intestine (in), kidneys (lk/rk), and bladder (bl). The images demonstrate differential organ uptake based on tracer substrate specificity: Me-4FDG (SGLT1 selective) shows high gastric retention and minimal brain uptake, while 2-FDG and 4-FDG (GLUT selective) exhibit notable accumulation in the brain and urinary bladder. Section B provides scatter plots showing the percentage of gastric emptying at 60 minutes, revealing high variability (range 15–100%) but no significant difference between genotypes. Section C quantifies intestinal tracer absorption, showing nearly complete absorption for Me-4FDG and 4-FDG, with slightly lower and more variable absorption for 2-FDG. This figure is used in metabolic research to study the roles of SGLT1 and GLUT2 transporters in intestinal glucose absorption.
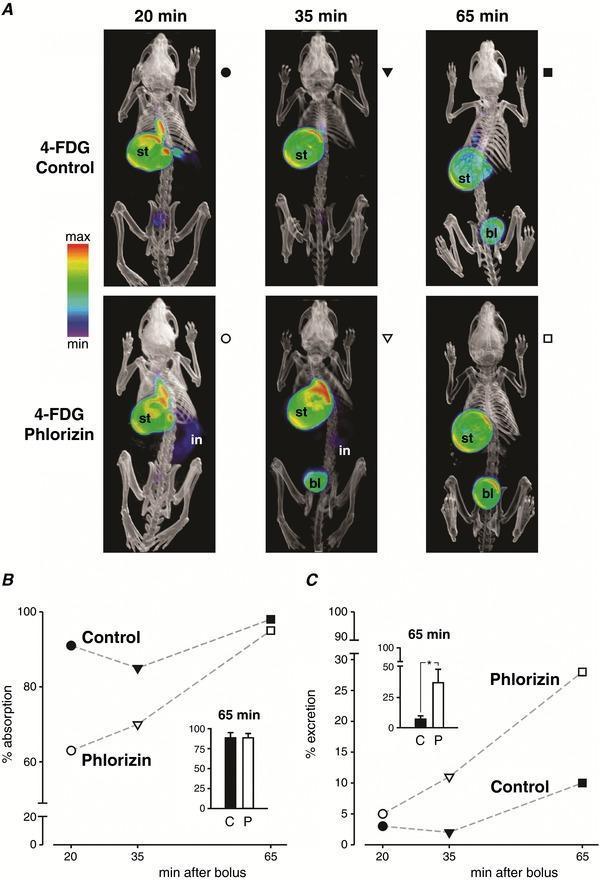
This diagnostic image set illustrates the pharmacokinetics and biodistribution of 4-FDG (4-fluorodeoxyglucose) in a mouse model using PET-CT imaging. Panel A displays volumetric renderings of whole-body PET-CT scans at 20, 35, and 65 minutes post-oral gavage. The top row (Control) shows high tracer intensity primarily in the stomach (st) at early time points, with minimal excretion. The bottom row (Phlorizin-treated) demonstrates the effect of SGLT1/SGLT2 inhibition, characterized by visible tracer in the intestine (in) and significantly earlier and higher accumulation in the urinary bladder (bl). An NIH color scale indicates activity intensity from red (highest) to purple (lowest). Panel B provides a quantitative comparison of gastrointestinal absorption over time, showing a significant initial delay in the phlorizin group at 20 and 35 minutes, which converges by 65 minutes. Panel C quantifies renal excretion, highlighting that phlorizin treatment leads to a marked increase in the percentage of the tracer excreted into the bladder (reaching ~35% at 65 min) compared to control (~7%). These visuals demonstrate the role of SGLTs in intestinal glucose absorption and renal reabsorption.
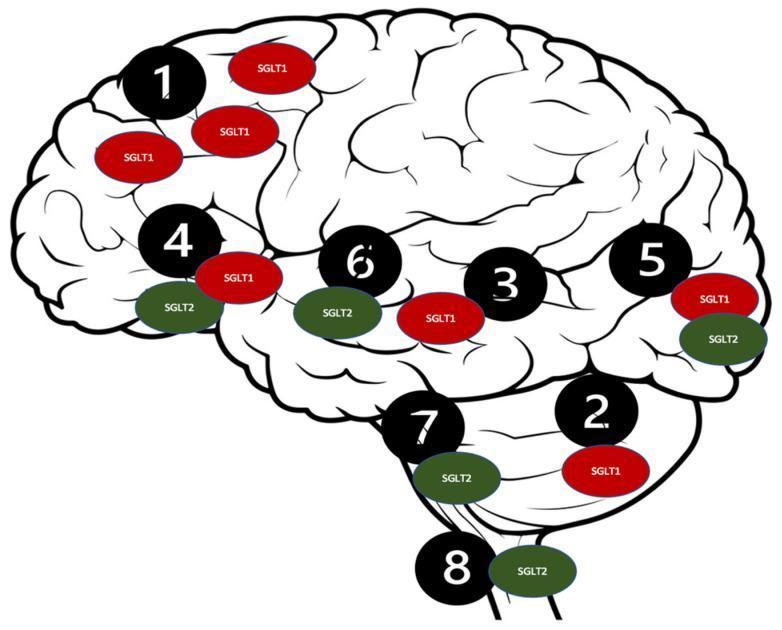
This medical anatomical diagram illustrates the distribution of Sodium-Glucose Co-transporter (SGLT) 1 and 2 receptors throughout the human Central Nervous System (CNS). The diagram uses a lateral view of the brain with numbered black circles corresponding to eight specific anatomical regions: (1) cerebral cortex pyramidal cells, (2) Purkinje neurons, (3) hippocampus, (4) hypothalamus, (5) microvessels, (6) amygdala, (7) periaqueductal gray, and (8) dorsomedial medulla. SGLT1 receptors are represented by red oval labels, while SGLT2 receptors are indicated by green oval labels. The visualization shows that SGLT1 is distributed in regions 1, 2, 3, 4, and 5. SGLT2 expression is depicted in regions 4, 5, 6, 7, and 8. The diagram highlights the co-localization of both receptor types in the hypothalamus (4) and cerebral microvessels (5), providing neuroanatomical context for the physiological roles of SGLT transporters and the potential therapeutic targets for SGLT2 inhibitors in neurological health and glucose metabolism.
Why ORS Concentration Must Match Blood Osmolarity
The Core Problem: Osmosis at the Gut Wall
The Physiological Mechanism: SGLT1 Cotransport
"The major process for the absorption of nutrients, such as glucose, is cotransport with Na+ - through the sodium-glucose cotransporter, SGLT1. The entry of these solute molecules draws water across the epithelium... Direct measurements indicate that there is cotransport of 210-260 water molecules per 1 glucose molecule. It has been estimated that SGLT1 absorbs 8-9 liters of water each day from the small intestine."
- Yamada's Textbook of Gastroenterology, 7th ed.
What Happens If Osmolarity Is Wrong?
| ORS Type | Osmolarity | Problem |
|---|---|---|
| Too hypertonic (e.g., plain sugar water, sports drinks) | >300 mOsm/L | High solute load in the lumen draws water OUT of the bloodstream into the gut by osmosis, worsening diarrhea and dehydration |
| Too hypotonic (e.g., plain water) | ~0 mOsm/L | No glucose/Na⁺ to drive SGLT1 cotransport; water poorly absorbed; risk of hyponatremia |
| Correct reduced-osmolarity ORS | 245 mOsm/L | Slightly hypotonic relative to blood; provides just enough glucose + Na⁺ to maximally drive SGLT1 without osmotic back-pressure |
"Fluids containing glucose and electrolytes provide optimal rehydration due to the cotransport of water across the intestinal lumen. Reduced osmolarity rehydration solution (e.g., WHO ORS 245 mOsm/kg) is associated with a reduced need for unscheduled IV infusions, lower stool volume, and less vomiting. High-glucose solutions have high osmolarity, and pure water has a low osmolarity; thus neither are optimal for water resorption."
- Rosen's Emergency Medicine
WHO ORS Composition (Reduced-Osmolarity Formula)
| Constituent | Concentration (mmol/L) |
|---|---|
| Na⁺ | 75 |
| K⁺ | 20 |
| Cl⁻ | 65 |
| Citrate | 10 |
| Glucose | 75 |
| Total osmolarity | 245 mOsm/L |
Why Isotonic Is Not Ideal Either
- It provides a small osmotic "pull" driving water toward the bloodstream
- It reduces luminal fluid retention compared to an isotonic solution
- It lowers total stool output by reducing osmotic secretion back into the lumen
Summary
- Osmotic physics - hypertonic fluids pull water INTO the lumen, worsening dehydration
- SGLT1 saturation - just enough glucose + Na⁺ is needed to drive cotransport of ~250 water molecules per cycle; excess glucose raises osmolarity without extra benefit
- Net absorption efficiency - a slightly hypotonic ORS creates a favorable osmotic gradient from lumen to blood, maximizing water recovery
Ideal time duration to measure body temperature by mercury thermometer when used orally or in armpit
mercury thermometer oral axillary temperature measurement duration minutes clinical standard
Mercury Thermometer: Duration for Oral and Axillary Measurement
Standard Time Durations
| Site | Duration | Normal Reading |
|---|---|---|
| Oral (sublingual) | 3 minutes | 37.0°C (98.6°F) |
| Axillary (armpit) | 5 minutes (some sources cite up to 7-10 min) | 36.4-36.7°C (97.6°F) |
| Rectal | 3 minutes | 37.5°C (99.5°F) |
Why the Times Differ
- Roberts and Hedges' Clinical Procedures in Emergency Medicine notes that the sublingual pocket should be used with the mouth closed, and oral electronic probes take up to 3 minutes.
- One study at high ambient temperatures timed oral mercury thermometers for 5 minutes to ensure full stabilization, noting that "previous literature reported stabilisation of temperature often takes over 3 minutes" in some conditions.
- Less direct blood supply compared to the sublingual mucosa
- Exposed to ambient air, so thermometer equilibration is slower
- Temperature is affected by room temperature, sweating, and arm position
- The axilla reads 0.5-1°C lower than core temperature
Why Axillary Is Less Reliable
"Axillary and tactile temperature assessments have been demonstrated to be unreliable and insensitive. They should not be used as screening methods for core temperature abnormalities in the ED."
Important Precautions for Oral Measurement
- Had hot or cold drinks or food
- Smoked
- Chewed gum
- Done strenuous exercise
- Recently been breathing through the mouth
- Children under 5 years (can't hold thermometer safely)
- Confused, uncooperative, or drowsy patients
- Patients with recent oral surgery
- Patients with a history of seizures
Summary
| Route | Time | Key reason |
|---|---|---|
| Oral | 3 min | Richly vascularized sublingual mucosa equilibrates faster |
| Axillary | 5 min (min) | Peripheral, air-exposed site equilibrates slowly; some authorities recommend up to 7-10 min |