
Cardiac cycle for 10 mark gk pal
I'll look up the cardiac cycle from GK Pal's physiology textbook right away.
Searching sources...
Reading File
Finding Sources
Finding Sources
GK Pal's textbook isn't in the library, but I have Guyton & Hall, Ganong, and Costanzo - the same standard references Indian physiology courses use. Let me pull the cardiac cycle content comprehensively now.
Finding Sources
Reading File
Reading File
Reading File
Reading File
Reading File
Finding Sources
Reading File
Loading Image
Reading File
I now have everything needed for a complete 10-mark answer. Here it is:
The Cardiac Cycle
Definition
The cardiac cycle refers to all the events that occur from the beginning of one heartbeat to the beginning of the next. At a heart rate of 75 beats/min, one complete cycle lasts approximately 0.8 seconds (systole ~0.3 s + diastole ~0.5 s).
Each cycle is initiated by spontaneous depolarization of the SA node (sinoatrial node) in the right atrium. The impulse travels through both atria, is delayed at the AV node (>0.1 s), then spreads to the ventricles via the Bundle of His and Purkinje fibres. This delay allows the atria to contract before the ventricles, acting as "primer pumps."
The Cardiac Cycle Diagram (Wiggers Diagram)
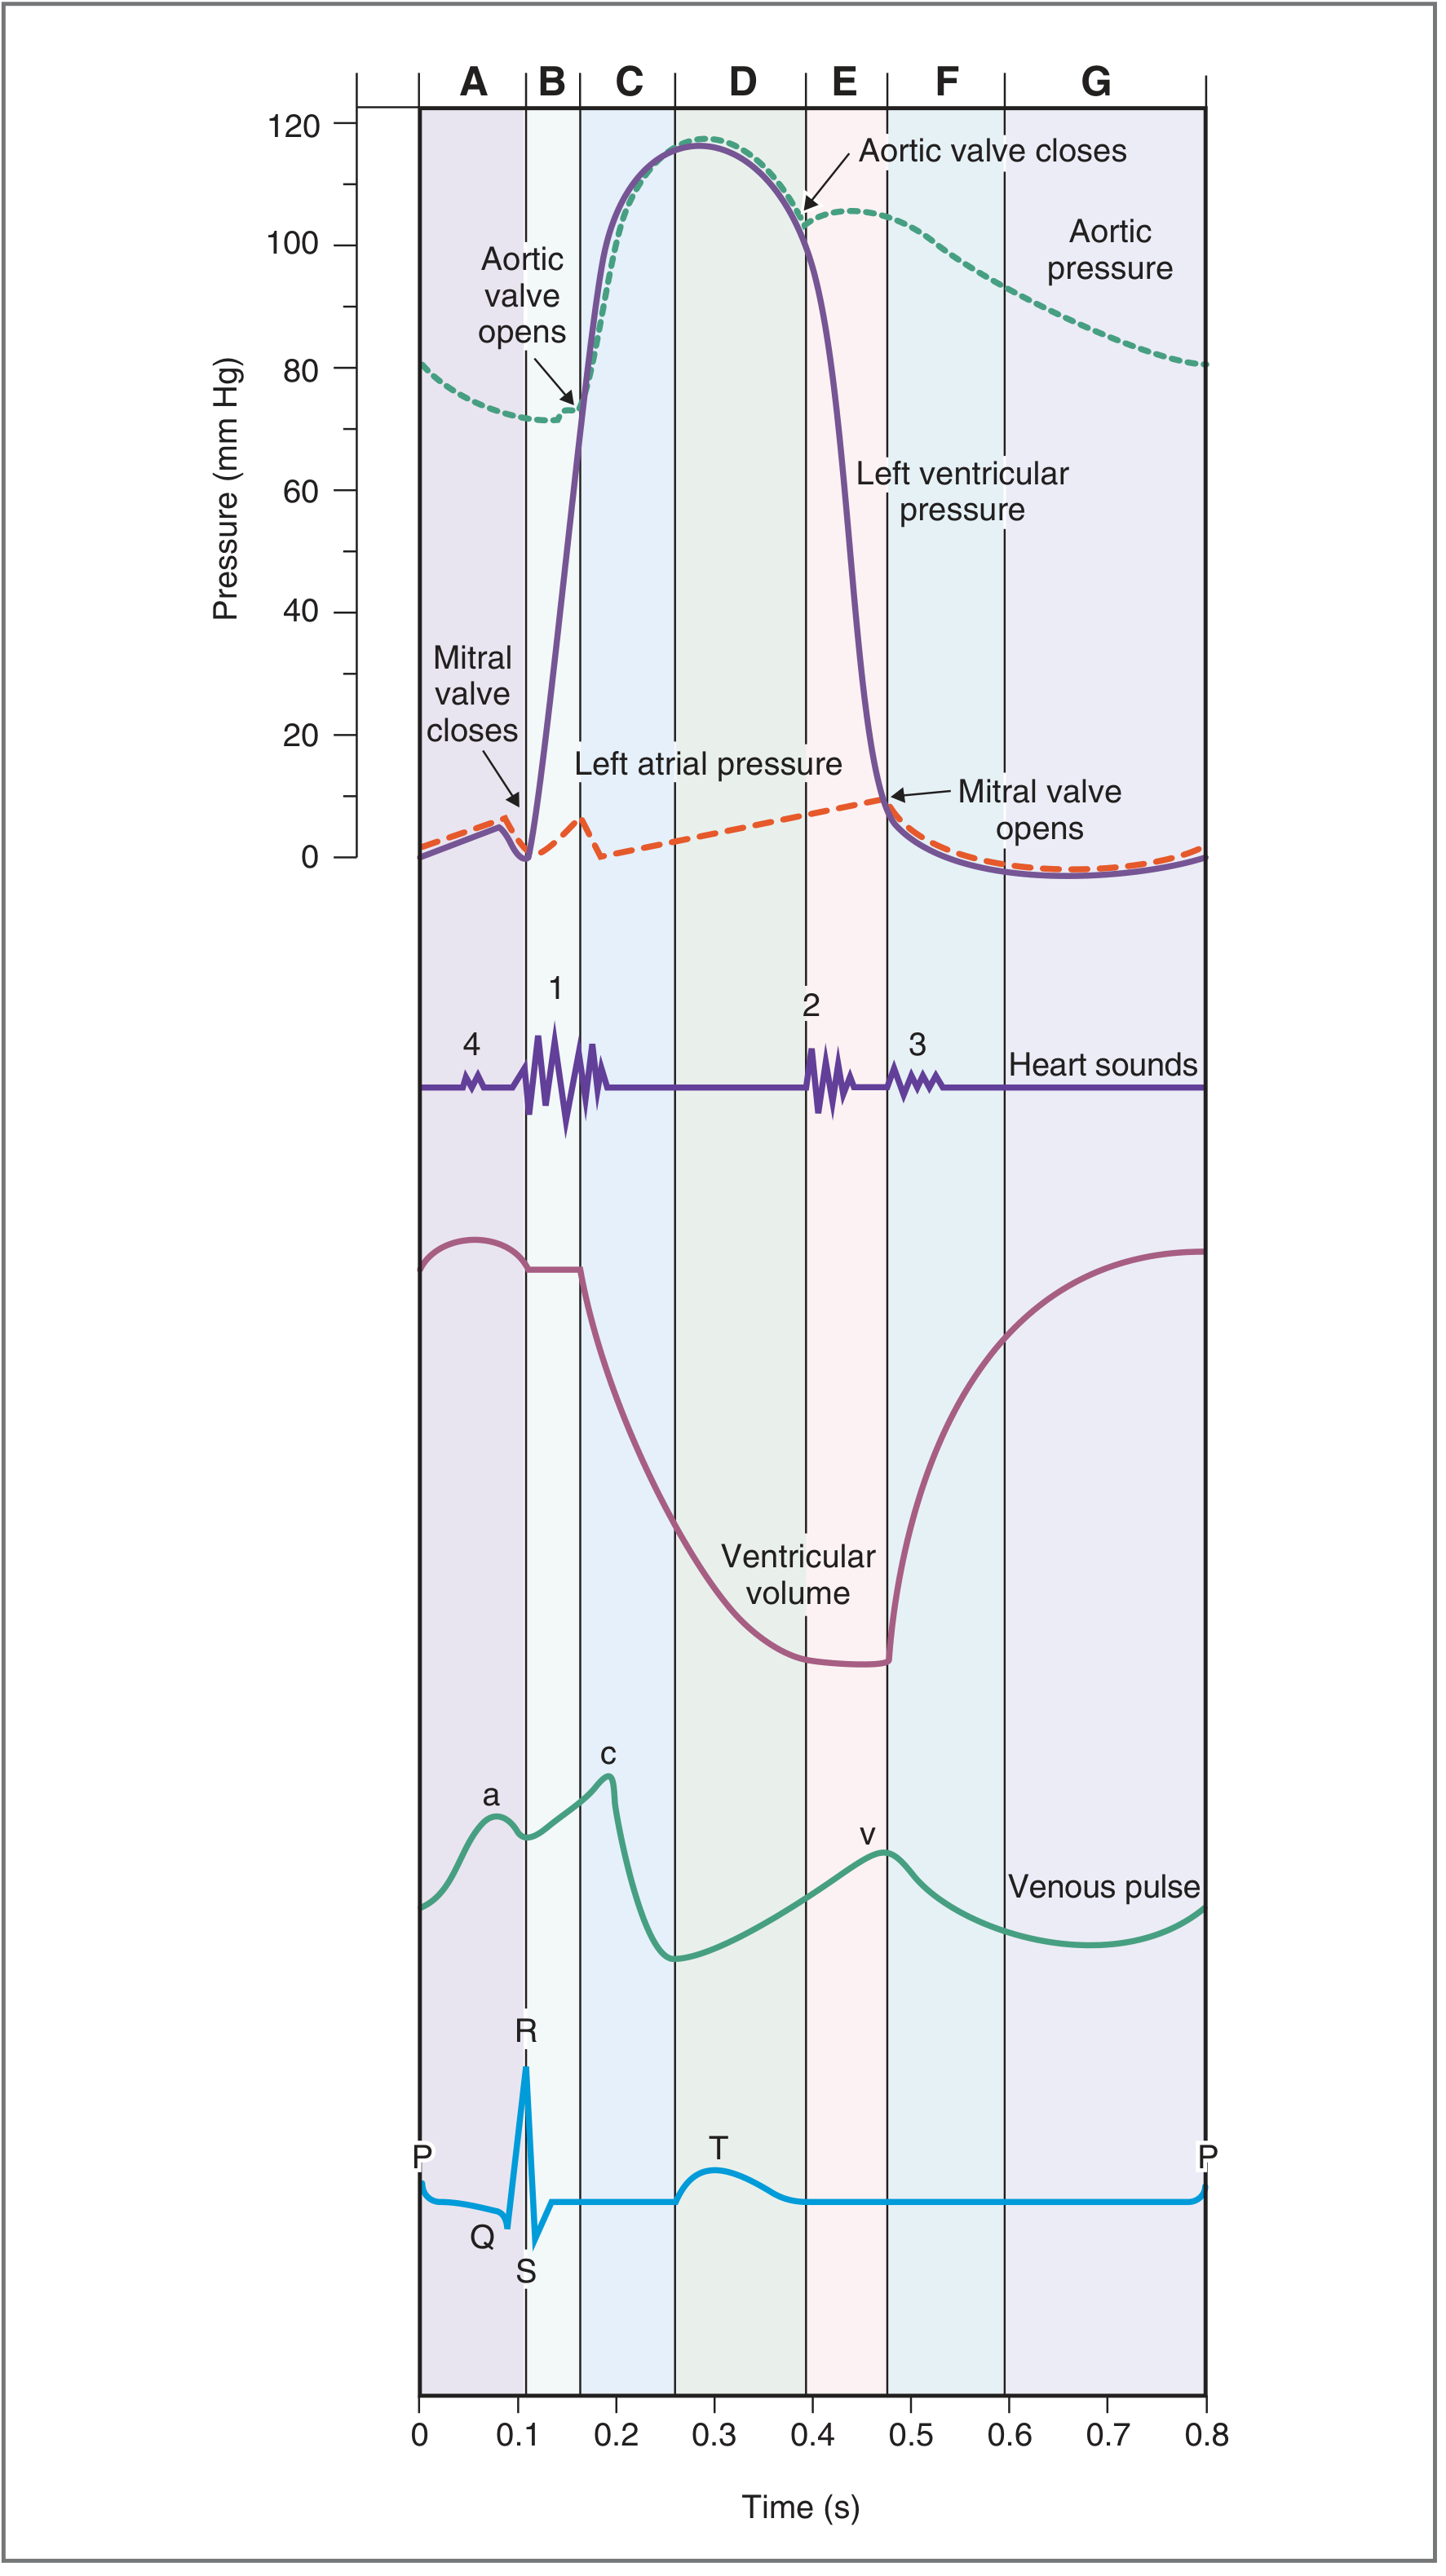
Fig. 4.25 - Costanzo Physiology 7th Ed. Shows phases A-G with LV pressure, aortic pressure, atrial pressure, ventricular volume, venous pulse, heart sounds, and ECG.
Seven Phases of the Cardiac Cycle
Phase A - Atrial Systole (0-0.1 s)
- ECG: P wave (atrial depolarization)
- Atria contract → left atrial pressure rises → blood actively pumped into the already-filling left ventricle through the open mitral valve
- LV volume increases to end-diastolic volume (EDV) ~120-130 mL
- Venous pulse: 'a' wave (atrial contraction reflected into jugular veins)
- Heart sound: S4 (not audible in normal adults; heard in ventricular hypertrophy/stiff ventricle)
Phase B - Isovolumetric Ventricular Contraction (IVC)
- ECG: QRS complex (ventricular depolarization)
- LV begins to contract → LV pressure rises rapidly
- When LV pressure exceeds LA pressure → mitral valve closes → S1 (lub)
- All valves are closed - LV pressure rises steeply but volume stays constant (isovolumetric)
- LV pressure builds until it exceeds aortic pressure (~80 mmHg)
- Duration: ~0.05 s
- Venous pulse: 'c' wave (tricuspid valve bulges into atrium)
Phase C - Rapid Ventricular Ejection
- ECG: ST segment
- When LV pressure exceeds aortic pressure (~80 mmHg) → aortic valve opens
- Blood rapidly ejected into aorta → LV volume drops sharply
- LV pressure reaches peak systolic pressure (~120 mmHg)
- Aortic pressure rises rapidly to its peak (~120 mmHg)
- ~70% of stroke volume is ejected in this phase
- Atrial filling begins (atrial pressure slowly rises)
- Venous pulse: 'x' descent
Phase D - Reduced Ventricular Ejection
- ECG: T wave (ventricular repolarization begins)
- Ventricles begin to repolarize → contracting force decreases
- Blood continues to be ejected (aortic valve still open), but at a slower rate
- LV volume reaches end-systolic volume (ESV) ~50 mL
- Aortic pressure starts to fall (blood runs off into peripheral arteries faster than it is added)
- Stroke volume = EDV - ESV = ~70 mL; Ejection fraction = SV/EDV = ~60%
Phase E - Isovolumetric Ventricular Relaxation (IVR)
- ECG: End of T wave
- LV relaxes → LV pressure drops rapidly
- When LV pressure falls below aortic pressure → aortic valve closes → S2 (dub)
- The dicrotic notch (incisura) appears on the aortic pressure curve at the moment of aortic valve closure
- All valves are again closed - volume stays constant (isovolumetric)
- Physiological splitting of S2 on inspiration: reduced intrathoracic pressure → increased RV venous return → prolonged RV ejection → pulmonic valve closes later than aortic valve
- Venous pulse: 'v' wave (venous filling while tricuspid is closed)
Phase F - Rapid Ventricular Filling
- ECG: Isoelectric (between T and next P)
- When LV pressure falls below LA pressure → mitral valve opens
- Blood flows rapidly from LA → LV (passive filling)
- LV volume increases rapidly but LV pressure remains low (ventricle is relaxed and compliant)
- Heart sound: S3 (rapid ventricular filling sound)
- Normal in children and young adults
- In adults >40 years: indicates volume overload (e.g., heart failure, MR, TR)
- Aortic pressure continues to fall as blood runs off into the arterial tree
Phase G - Reduced Ventricular Filling (Diastasis)
- The longest phase of the cardiac cycle
- Filling continues at a slow rate
- Ventricular volume approaches EDV
- If heart rate increases, this phase is shortened first - explaining why tachycardia reduces stroke volume (less filling time)
Summary Table
| Phase | Mitral Valve | Aortic Valve | ECG Event | Heart Sound |
|---|---|---|---|---|
| A - Atrial Systole | Open | Closed | P wave | S4 |
| B - IVC | Closes | Closed | QRS | S1 |
| C - Rapid Ejection | Closed | Opens | ST segment | - |
| D - Reduced Ejection | Closed | Open | T wave | - |
| E - IVR | Closed | Closes | End of T | S2 + Dicrotic notch |
| F - Rapid Filling | Opens | Closed | Isoelectric | S3 |
| G - Diastasis | Open | Closed | Isoelectric | - |
Key Values to Remember
| Parameter | Value |
|---|---|
| Total cycle duration (75 bpm) | 0.8 s |
| Systole | 0.3 s |
| Diastole | 0.5 s |
| End-diastolic volume (EDV) | 120-130 mL |
| End-systolic volume (ESV) | ~50 mL |
| Stroke volume (SV = EDV - ESV) | ~70 mL |
| Ejection fraction | ~60-65% |
| Peak LV systolic pressure | ~120 mmHg |
| LV diastolic pressure | ~0-5 mmHg |
Important Clinical Correlates
- S4 - Stiff/hypertrophied ventricle (aortic stenosis, hypertension, hypertrophic cardiomyopathy)
- S3 - Volume overload: congestive heart failure, mitral regurgitation
- Dicrotic notch - Marks aortic valve closure; used to define end-systole in clinical monitoring
- Tachycardia - Reduces diastasis (Phase G) most, impairing ventricular filling and reducing stroke volume
- Splitting of S2 - Physiological on inspiration; fixed splitting in ASD; paradoxical in LBBB/severe AS
Sources: Costanzo Physiology 7th Edition, p. 160-163; Guyton and Hall Textbook of Medical Physiology, p. 126-127
This is a shared conversation. Sign in to Orris to start your own chat.