Explain me 10 common heart disease with ecg changes and ecg images of those disease
Reading File
Finding Sources
Finding Sources
Searching Images
ECG electrocardiogram myocardial infarction ST elevation STEMI
Searching Images
ECG atrial fibrillation irregular rhythm absent P waves
Searching Images
ECG heart block third degree complete AV block
Searching Images
ECG hypertrophic cardiomyopathy left ventricular hypertrophy
Searching Images
ECG Wolff-Parkinson-White WPW delta wave pre-excitation
Searching Images
ECG pulmonary embolism S1Q3T3 right heart strain
Searching Images
ECG ventricular tachycardia wide complex tachycardia
Searching Images
ECG pericarditis diffuse ST elevation saddle shape PR depression
Searching Images
ECG left bundle branch block LBBB wide QRS
Searching Images
ECG hyperkalemia peaked T waves sine wave pattern
Here is a comprehensive guide to 10 common heart diseases with their ECG changes and representative ECG images:
10 Common Heart Diseases: ECG Changes & Images
1. 🫀 ST-Elevation Myocardial Infarction (STEMI)
ECG Changes
| Phase | Finding |
|---|---|
| Hyperacute | Tall, peaked (hyperacute) T-waves |
| Acute | ST-segment elevation ≥1 mm (≥2 mm in V1–V4), convex "tombstone" morphology |
| Evolving | Pathological Q waves (>40 ms wide, >25% of R-wave height) |
| Reciprocal | ST depression in leads opposite the infarct zone |
| Chronic | Q waves persist; T-wave inversion |
Territory localization:
- Anterior (LAD): ST elevation in V1–V4
- Inferior (RCA): ST elevation in II, III, aVF; reciprocal depression in I, aVL
- Lateral (LCx): ST elevation in I, aVL, V5–V6
- Posterior: ST depression in V1–V3 + tall R waves
ECG Images
Anterior STEMI: pronounced "tombstone" ST elevation in V2–V5, evolving QS waves, consistent with proximal LAD occlusion

Anterolateral STEMI: ST elevation V1–V6 + leads I and aVL with reciprocal ST depression in II, III, aVF
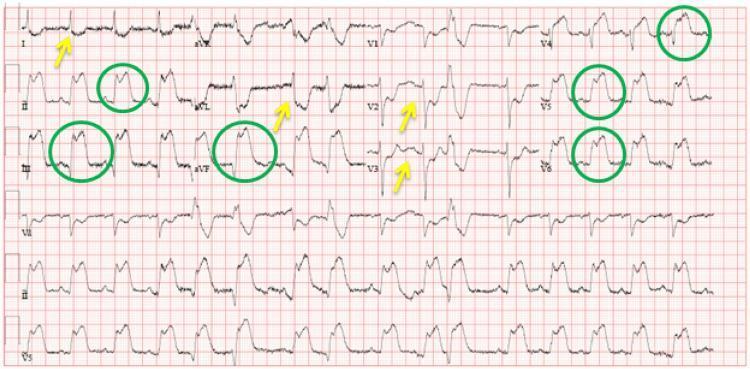
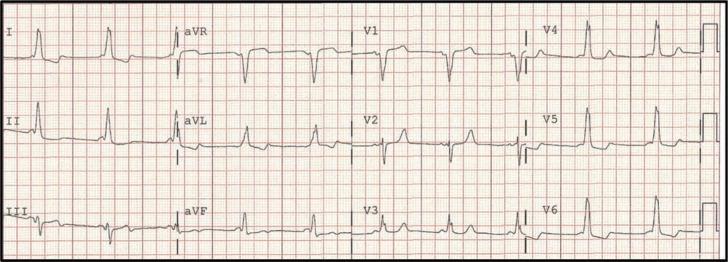
Inferolateral STEMI: ST elevation in II, III, aVF, V4–V6 (green circles) with reciprocal depressions in I, aVL, V2–V3 (yellow arrows)
2. ❤️🔥 Atrial Fibrillation (AF)
ECG Changes
| Feature | Finding |
|---|---|
| P waves | Absent — replaced by chaotic fibrillatory (f) waves at 350–600/min |
| Rhythm | Irregularly irregular R-R intervals (hallmark) |
| Rate | Variable; uncontrolled: 100–160 bpm |
| QRS | Narrow (unless aberrant conduction or pre-excitation) |
| Baseline | Fine or coarse fibrillatory activity, best seen in V1 |
ECG Image
AF with rapid ventricular response (~134 bpm): absent P waves, chaotic baseline, irregularly irregular QRS complexes with narrow morphology
3. 🚫 Complete (Third-Degree) AV Block
ECG Changes
| Feature | Finding |
|---|---|
| AV dissociation | Complete — P waves and QRS bear NO relationship |
| P waves | Regular at faster atrial rate (e.g., 75 bpm) |
| QRS rate | Slow escape rhythm (20–45 bpm if ventricular; 40–60 bpm if junctional) |
| QRS width | Wide (>120 ms) if ventricular escape; narrow if junctional |
| PR interval | No fixed PR interval — P waves "march through" QRS complexes |
ECG Images
Third-degree heart block: wide-complex escape rhythm, P waves dissociated from QRS complexes, postoperative tricuspid valve replacement
Third-degree AV block with narrow-complex junctional escape at ~36 bpm — pacemaker implantation indicated
4. 🏋️ Hypertrophic Cardiomyopathy (HCM)
ECG Changes
| Feature | Finding |
|---|---|
| LVH | Sokolow-Lyon criteria: S in V1 + R in V5/V6 >35 mm |
| ST-T changes | Diffuse ST depression + deep T-wave inversions (strain pattern) |
| Apical HCM | Giant T-wave inversions in V3–V5 (Yamaguchi syndrome) — ≥10 mm deep |
| Septal Q waves | Absent in I, aVL, V5–V6 (due to abnormal septal depolarization) |
| QRS axis | Left axis deviation common |
| Arrhythmias | AF, ventricular ectopy, non-sustained VT |
ECG Images
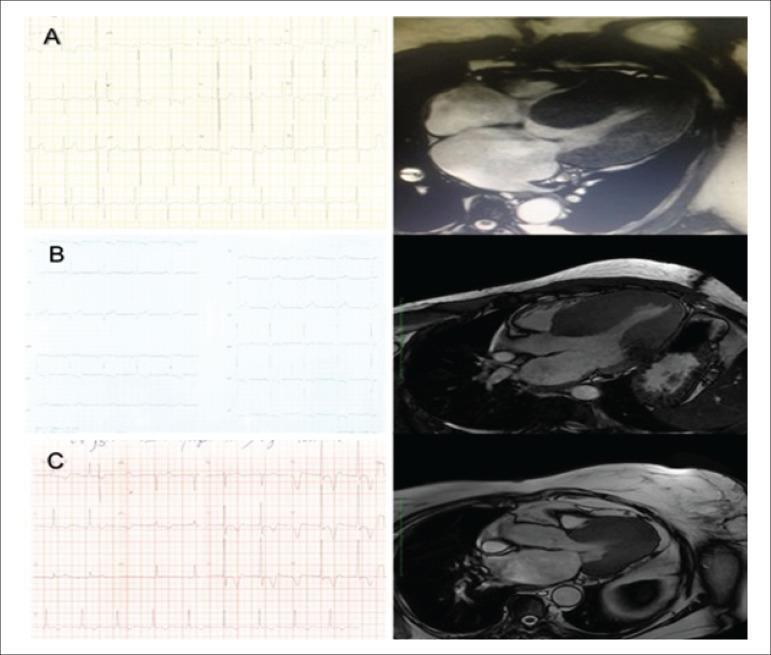
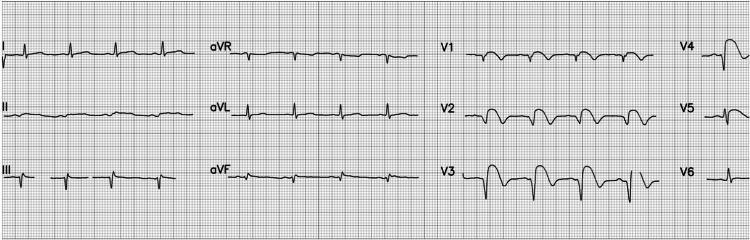
HCM variants: (A) Concentric — high-voltage R waves + strain; (B) Septal — moderate LVH; (C) Apical — giant T-wave inversions (12 mm) in lateral leads, with CMR correlation
Apical HCM (Yamaguchi syndrome): high-voltage QRS + dramatic deep symmetric T-wave inversions in V2–V5
5. ⚡ Wolff-Parkinson-White (WPW) Syndrome
ECG Changes
| Feature | Finding |
|---|---|
| PR interval | Short (<120 ms) — bypass tract bypasses AV node delay |
| Delta wave | Slurred upstroke of the QRS — hallmark of pre-excitation |
| QRS width | Widened (>120 ms) |
| ST-T changes | Discordant (opposite to QRS vector) — secondary repolarization changes |
| Pseudo-infarct | Negative delta waves in II, III, aVF can mimic inferior Q waves |
| Arrhythmia risk | AVRT, AF with rapid ventricular response (potentially fatal) |
Pathway localization: Delta wave polarity in V1 and inferior leads identifies pathway location (left lateral, posteroseptal, anteroseptal, etc.)
ECG Images
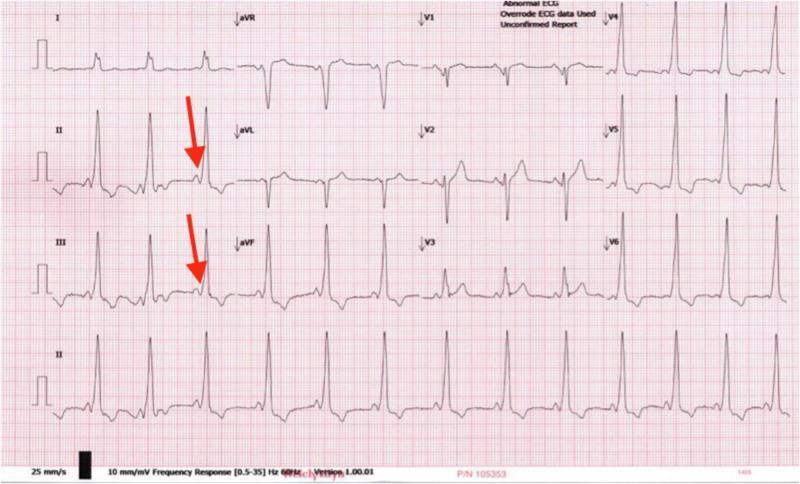
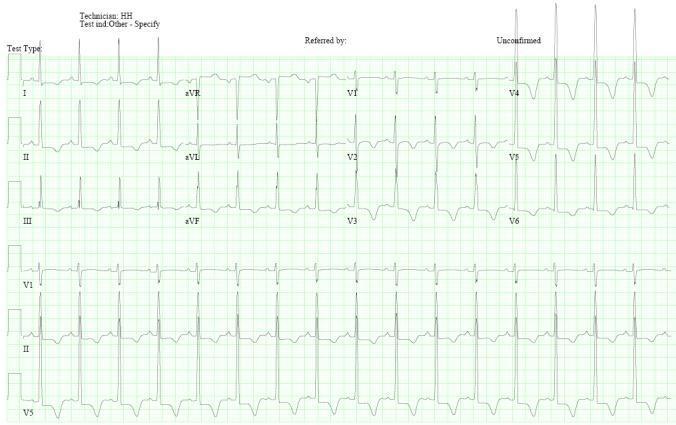
WPW syndrome: short PR, widened QRS with delta waves (red arrows in II and III), regular tachycardia — anteroseptal accessory pathway
WPW: Short PR (<120 ms), widened QRS with prominent delta waves across precordial and lateral limb leads, mid-septal pathway location
6. 🫁 Pulmonary Embolism (PE)
ECG Changes
| Feature | Finding |
|---|---|
| Sinus tachycardia | Most common ECG finding (~40% of PE) |
| S1Q3T3 pattern | Deep S in lead I + Q wave in III + T-wave inversion in III (McGinn-White sign) |
| Right axis deviation | Reflecting acute RV strain |
| RBBB | New complete or incomplete right bundle branch block |
| T-wave inversions | V1–V4 (right precordial) indicating RV strain |
| P pulmonale | Tall, peaked P waves in II if severe pulmonary hypertension |
⚠️ ECG is non-specific; normal ECG does not rule out PE. Always correlate with clinical probability and CT-PA.
ECG Images
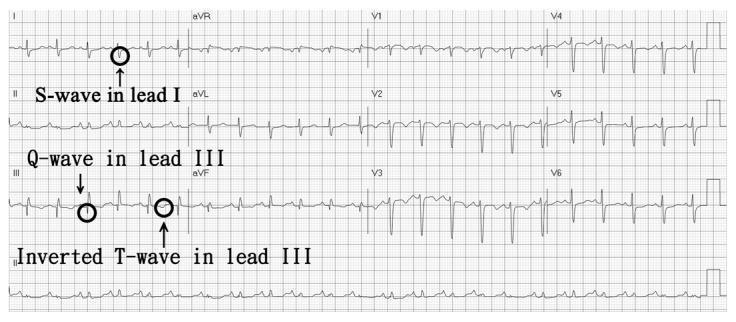
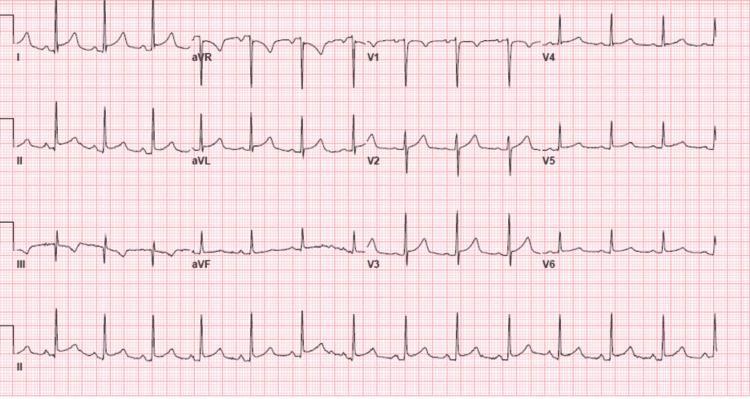
Acute PE: S1Q3T3 pattern with annotated black circles — deep S in I, Q in III, T-wave inversion in III; sinus tachycardia
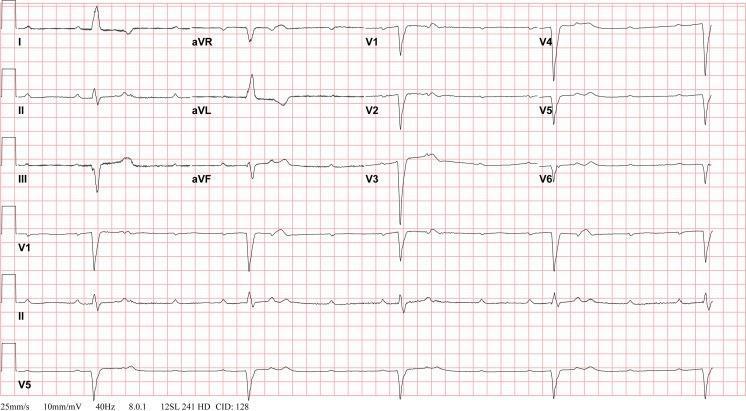
Acute PE: S1Q3T3 pattern + incomplete RBBB (QRS 110 ms) + T-wave inversions in V1–V3 and aVF — consistent with acute right ventricular strain
7. 💥 Ventricular Tachycardia (VT)
ECG Changes
| Feature | Finding |
|---|---|
| Rate | 100–250 bpm |
| QRS | Wide (>120 ms), bizarre morphology |
| Rhythm | Regular (monomorphic VT) or irregular (polymorphic/torsades) |
| P waves | Absent or dissociated from QRS (AV dissociation) |
| Fusion beats | Narrow QRS "capture" or hybrid beats = pathognomonic for VT |
| Concordance | All precordial leads positive or negative = strongly suggests VT |
| Brugada criteria | RS absent in precordials, RS >100 ms, AV dissociation, morphology criteria |
ECG Image
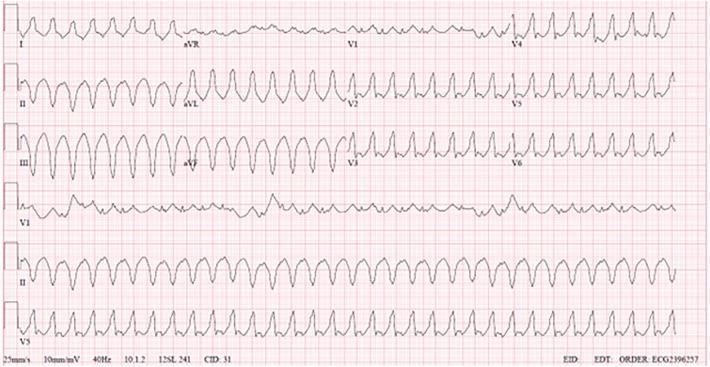
Monomorphic VT: rapid wide-complex tachycardia, positive precordial concordance, no discernible P waves — associated with structural heart disease
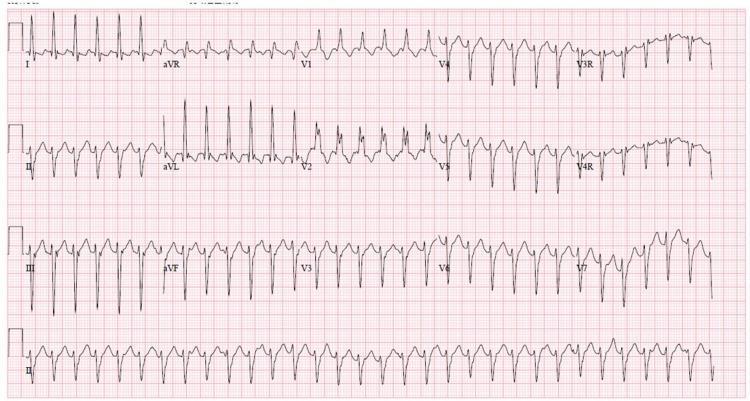
Left fascicular VT (Belhassen): RBBB morphology + left axis deviation — idiopathic, verapamil-sensitive form; typically younger patients without structural disease
8. 🔥 Acute Pericarditis
ECG Changes (4 Stages)
| Stage | Finding |
|---|---|
| Stage I (hours–days) | Diffuse concave ("saddle-shaped") ST elevation in all leads except aVR and V1; PR depression in II + PR elevation in aVR |
| Stage II (1–3 weeks) | ST normalizes; T waves flatten |
| Stage III | Diffuse T-wave inversion |
| Stage IV | ECG normalizes |
Key differentiators from STEMI:
- Diffuse (not territory-specific) ST elevation
- Concave (not convex/tombstone) morphology
- PR segment depression
- Spodick's sign: downsloping TP segment
- No reciprocal changes (except aVR)
ECG Images

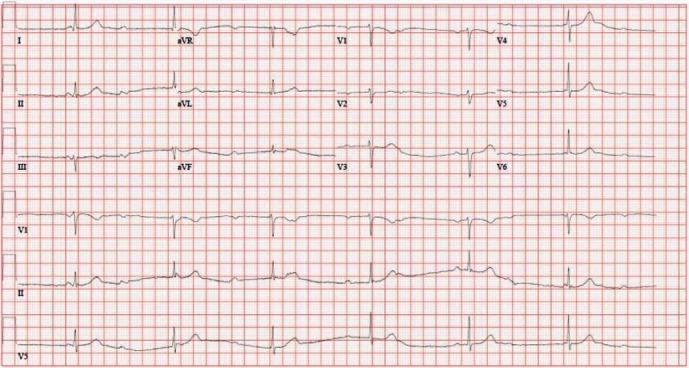
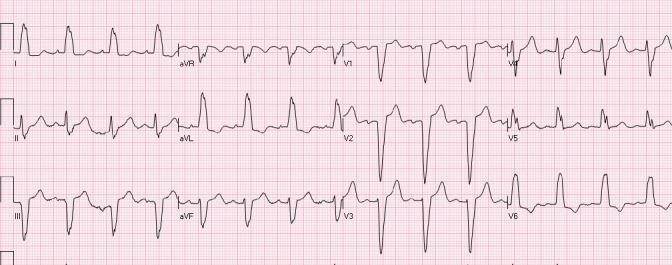
Acute pericarditis: concave ST elevation in I, II, III, aVF, V2–V6; PR depression in II; reciprocal ST depression + PR elevation in aVR; Spodick's sign present
Pericarditis Stage I: saddle-shaped ST elevation across multiple territories, PR depression in II, III, aVF, V4–V6, reciprocal PR elevation in aVR — no Q waves
9. 🔀 Left Bundle Branch Block (LBBB)
ECG Changes
| Feature | Finding |
|---|---|
| QRS duration | ≥120 ms (complete LBBB) |
| V1 | Deep broad QS or rS pattern |
| I, aVL, V5–V6 | Broad, notched M-shaped (bifid) R waves — no Q waves |
| ST-T discordance | ST/T-wave changes opposite to QRS direction |
| Lateral T-waves | T-wave inversion in I, aVL, V5–V6 |
| No septal Q waves | Absent in lateral leads |
| Clinical significance | New LBBB in ACS = treat as STEMI equivalent (Sgarbossa criteria) |
ECG Images
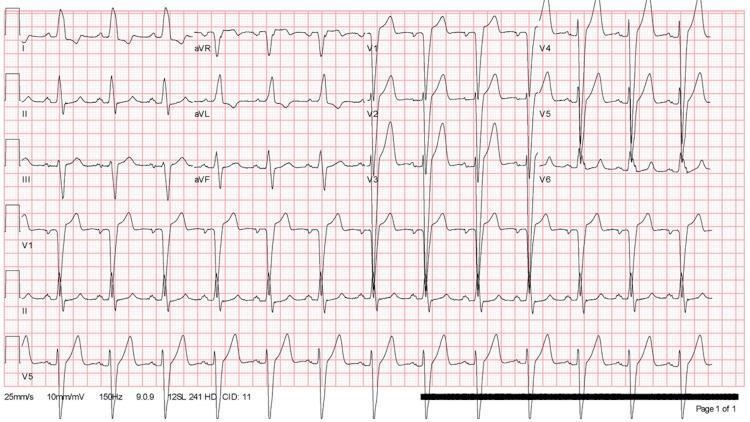
Classic LBBB: wide QRS >120 ms, notched M-shaped R waves in I, aVL, V5–V6; deep broad S in V1–V3; T-wave discordance (upright in V1–V3, inverted laterally)
LBBB with discordant ST elevation in V1–V3 and ST depression in I, aVL, V6 — Sgarbossa criterion: discordant STE ≥1 mm is expected, but concordant STE suggests underlying ischemia
10. ⚗️ Hyperkalemia
ECG Changes (Progressive with rising K⁺)
| Serum K⁺ | ECG Finding |
|---|---|
| 5.5–6.5 mEq/L | Tall, narrow-based "tented" peaked T waves (earliest sign, best in V2–V4) |
| 6.5–7.5 mEq/L | Prolonged PR interval, flattening/loss of P waves |
| 7.5–8.0 mEq/L | Widened QRS (intraventricular conduction delay) |
| >8.0 mEq/L | Sine-wave pattern (fusion of QRS and T), ventricular fibrillation, asystole |
⚠️ Hyperkalemia is a medical emergency. Give IV calcium gluconate immediately when ECG changes are present to stabilize the myocardial membrane.
ECG Images
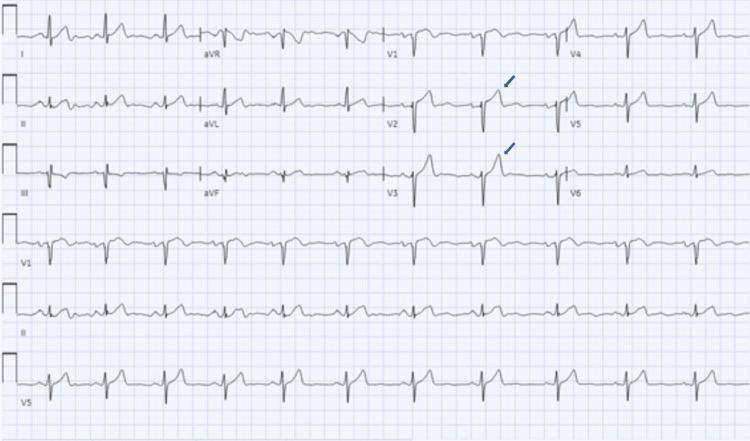
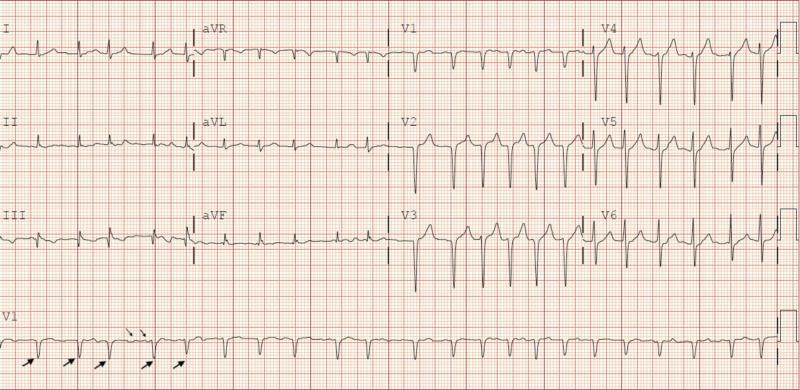
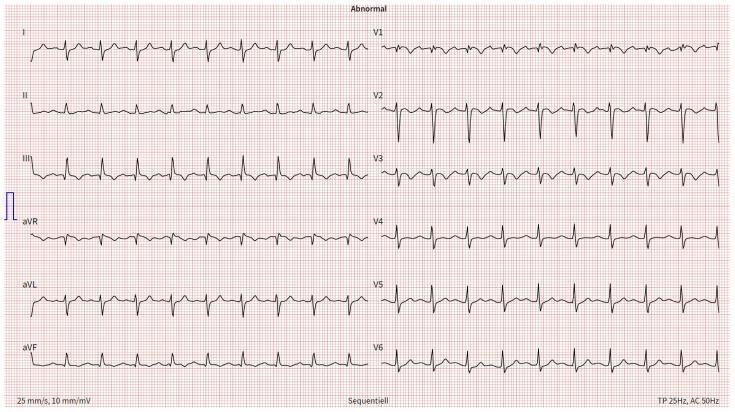
Hyperkalemia (K⁺ = 7.3 mEq/L): classic tall, narrow-based peaked T waves in V2–V4 (blue arrows) — earliest ECG sign, no QRS widening yet at this stage
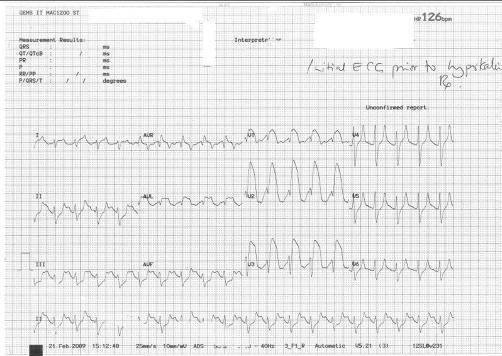
Severe hyperkalemia: broad-complex tachycardia at ~126 bpm with sine-wave QRS morphology, peaked T waves in V2–V4, absent P waves — pre-arrest state
Quick Reference Summary Table
| # | Condition | Key ECG Finding |
|---|---|---|
| 1 | STEMI | ST elevation + Q waves in territory; reciprocal depression |
| 2 | Atrial Fibrillation | Absent P waves + irregularly irregular rhythm |
| 3 | Complete AV Block | P-QRS dissociation + slow escape rhythm |
| 4 | HCM | LVH voltage + giant T-wave inversions (apical) |
| 5 | WPW | Short PR + delta wave + widened QRS |
| 6 | Pulmonary Embolism | S1Q3T3 + sinus tachycardia + right heart strain |
| 7 | Ventricular Tachycardia | Wide QRS tachycardia + AV dissociation |
| 8 | Pericarditis | Diffuse saddle-shaped ST elevation + PR depression |
| 9 | LBBB | Wide QRS + notched R in I/V5–V6 + ST discordance |
| 10 | Hyperkalemia | Peaked T waves → QRS widening → sine wave |
Sources: Harrison's Principles of Internal Medicine 22E; Tintinalli's Emergency Medicine; Ganong's Review of Medical Physiology; ROSEN's Emergency Medicine — ECG images from peer-reviewed PMC literature.
This is a shared conversation. Sign in to Orris to start your own chat.