
Growth chart and its uses in psm
Reading File
A growth chart is a graphical tool used in preventive and social medicine (PSM) to monitor a child's physical growth over time, plotting parameters like weight, height, and head circumference against age. It helps detect malnutrition, growth faltering, and developmental concerns early.
Searching sources...
Finding Sources
Finding Sources
Found the key sections in Park's PSM. Now reading them all in parallel.
Reading File
Reading File
Good content so far. Let me read the remaining portion covering all uses of the growth chart.
Reading File
I have all the content needed. Let me also fetch the growth chart image for a visual display.
Loading Image
I now have comprehensive content from Park's PSM. Here is the full detailed answer:
Growth Chart and Its Uses in PSM
(Source: Park's Textbook of Preventive and Social Medicine)
Definition
The growth or "road-to-health" chart is a visible display of the child's physical growth and development. It was first designed by David Morley and later modified by WHO. It is designed primarily for the longitudinal follow-up (growth monitoring) of a child, so that changes over time can be interpreted.
- Weight is used as the primary parameter because it is the most sensitive measure of growth - any deviation from "normal" can be detected easily by comparison with reference curves.
- A child can lose weight but not height, making weight-for-age plots particularly useful.
- The chart offers a simple and inexpensive way of monitoring weight gain and child health over time.
WHO Child Growth Standards (2006)
In 1993, WHO reviewed the older NCHS growth references and found they did not adequately represent early childhood growth. A Multicentre Growth Reference Study (MGRS) was conducted between 1997 and 2003 in 6 countries: Brazil, Ghana, India, Norway, Oman, and USA, gathering data from 9,440 healthy breast-fed infants and young children (0-60 months).
Standards generated include percentile and Z-score curves for:
- Length/height-for-age
- Weight-for-age
- Weight-for-length
- Weight-for-height
- BMI-for-age (new addition compared to older NCHS/WHO reference)
The image below shows the comparison of WHO vs. NCHS weight-for-age Z-scores for girls:
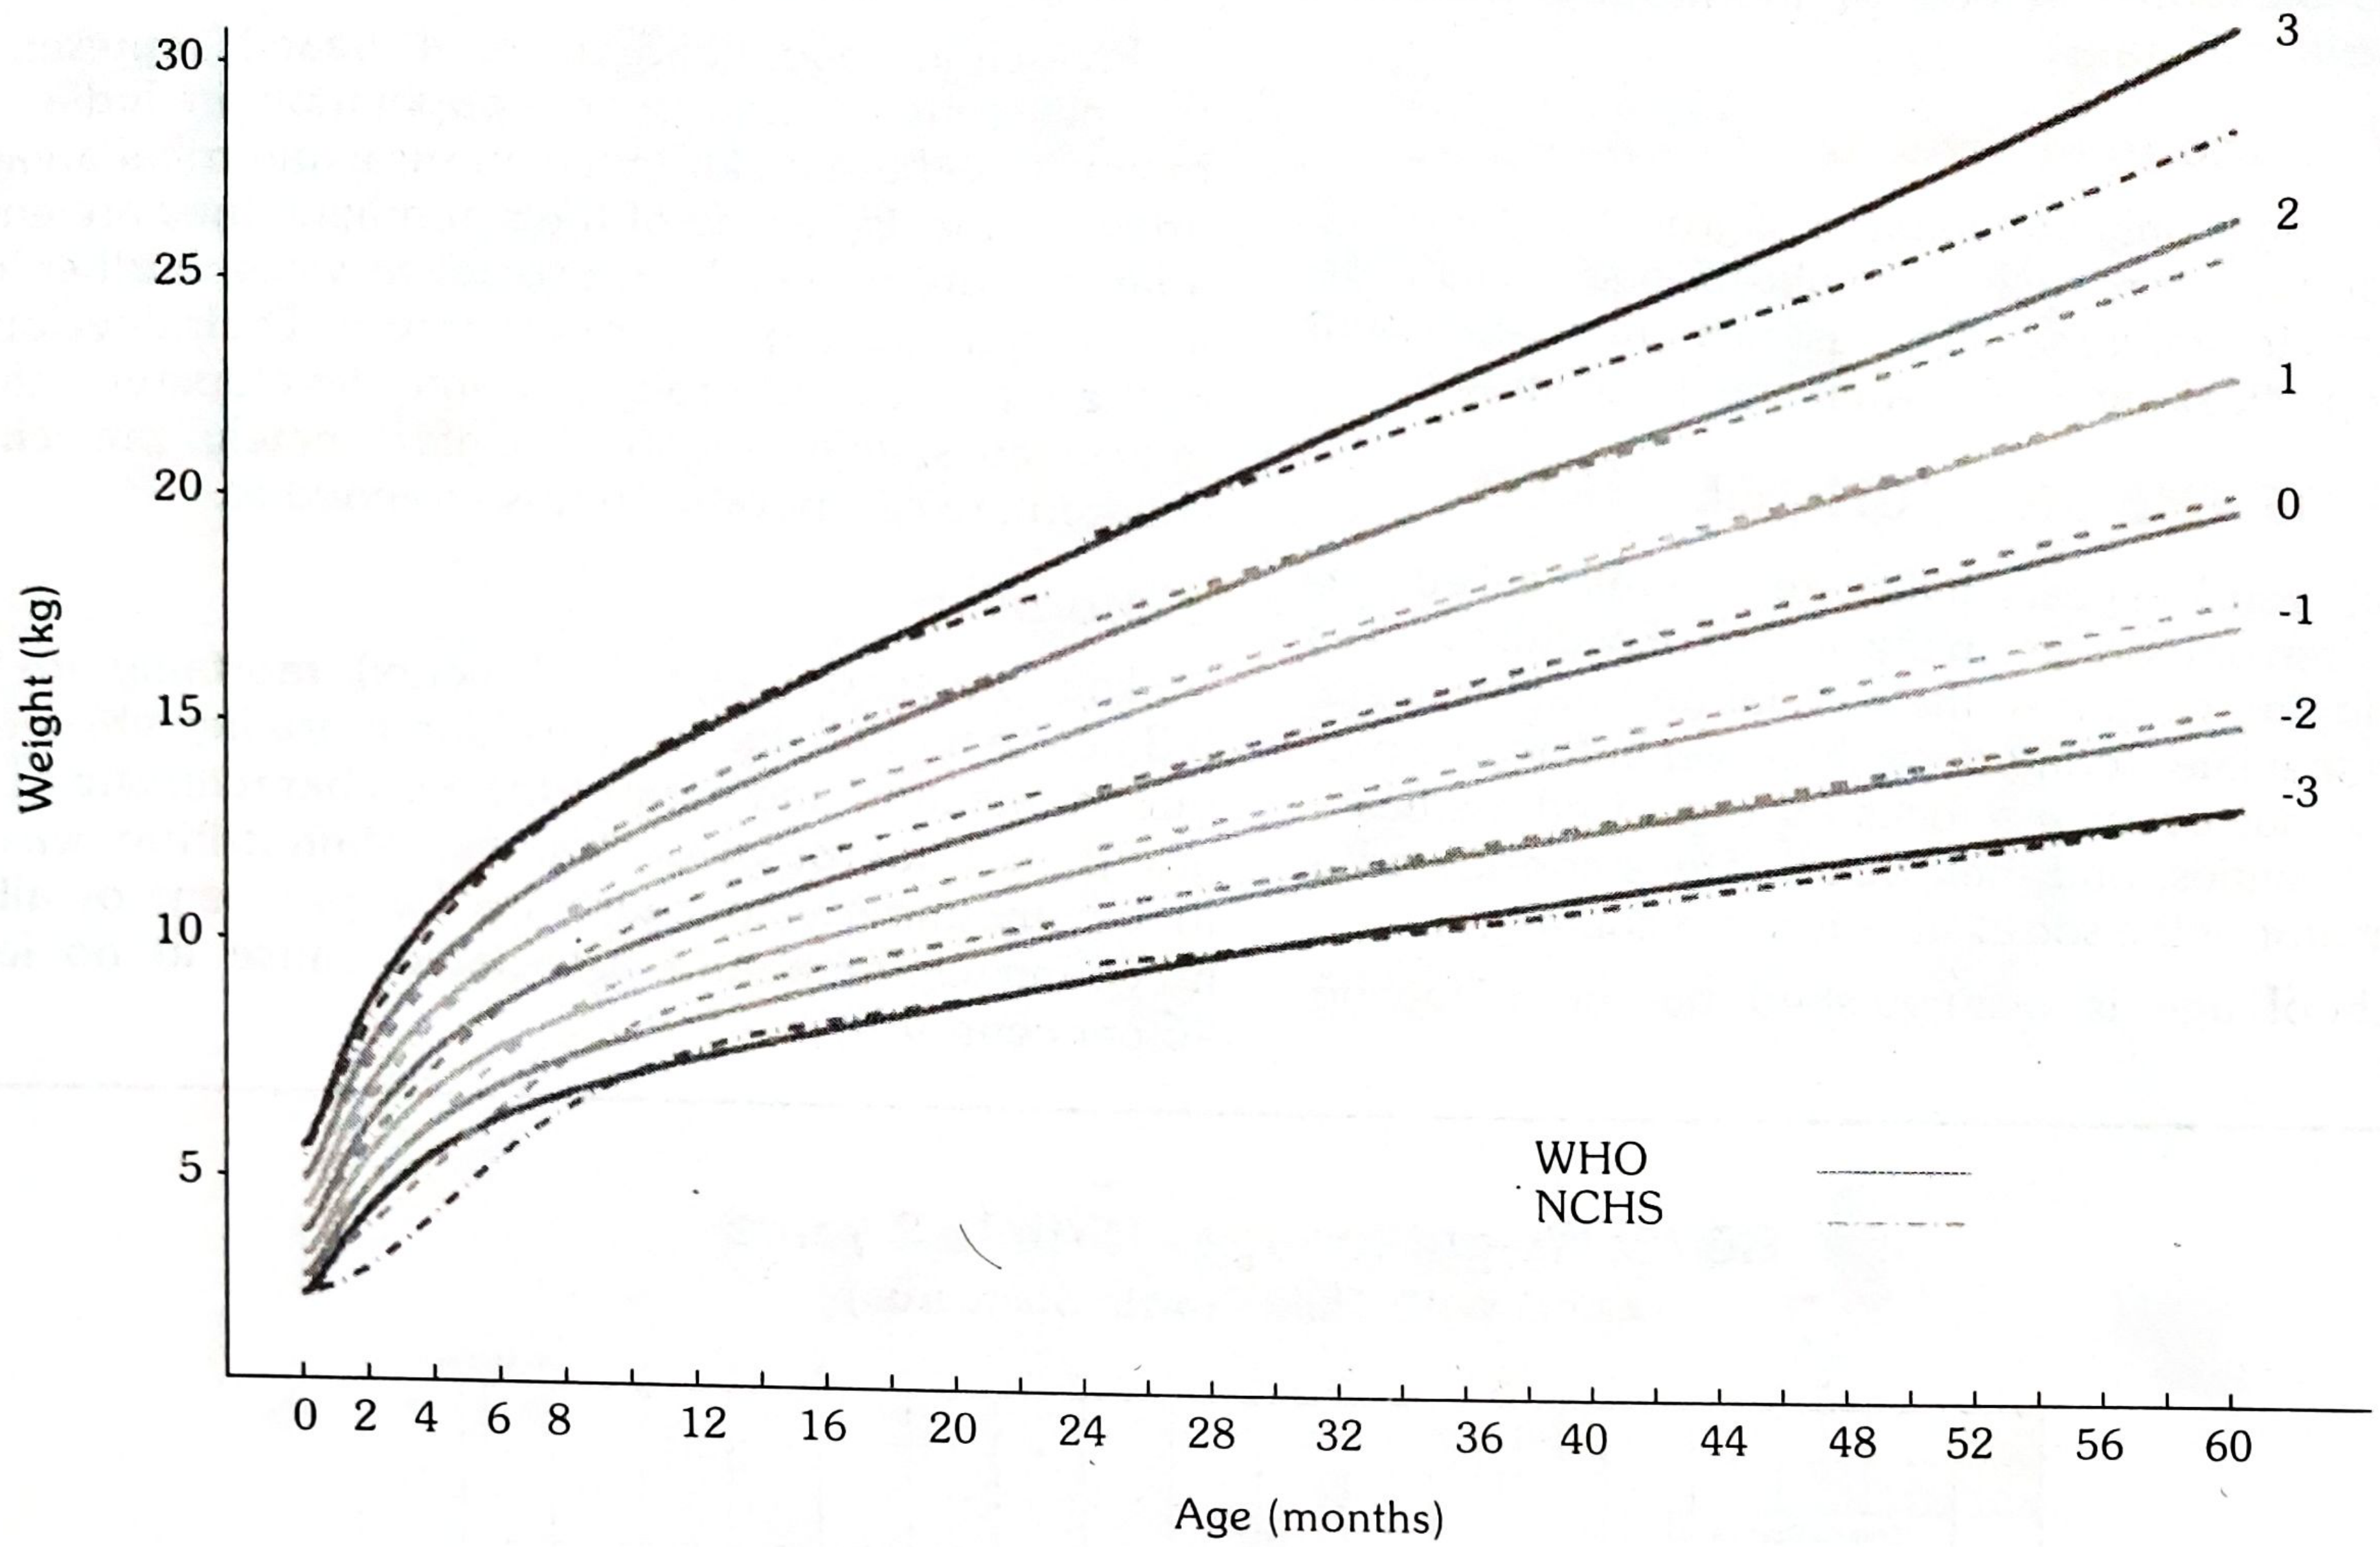
Key differences with NCHS/WHO reference:
- Stunting will be greater throughout childhood using new WHO standards
- Underweight rates increase during first half of infancy for breast-fed infants, decrease thereafter
- Wasting rates are substantially higher during infancy under new WHO standards
- Overweight rates also differ
Growth Chart Used in India
India adopted the new WHO Child Growth Standards (2006) in February 2009 for use within:
- National Rural Health Mission (NRHM)
- Integrated Child Development Services (ICDS)
Mother and Child Protection (MCP) Card
A joint "Mother and Child Protection Card" was developed which includes:
- Family identification and registration
- Birth record and pregnancy record
- Immunization schedule
- Breast-feeding and supplementary food details
- Baby's developmental milestones
- Birth spacing information
- Reasons for special care
The card is kept by the mother and brought to the health centre at every visit.
Zones on the Indian Growth Chart
| Zone | SD Cutoff |
|---|---|
| Normal | Above -2 SD |
| Undernutrition | Below -2 SD |
| Severely underweight | Below -3 SD |
In states like Maharashtra, the chart further grades undernutrition into Grade I, II, III, and IV.
Key principle: The direction of growth is more important than the position of dots on the line. Flattening or falling of the weight curve signals growth failure - the earliest sign of protein-energy malnutrition (PEM), which may precede clinical signs by weeks to months.
Uses of Growth Chart
The growth chart has been described as a "passport to child health care" (Park's PSM). It has seven major uses:
| # | Use | Details |
|---|---|---|
| 1 | Growth Monitoring | Longitudinal tracking of weight gain; of great value in child health care |
| 2 | Diagnostic Tool | Identifies "high-risk" children; malnutrition detected long before clinical signs/symptoms appear |
| 3 | Planning and Policy Making | By grading malnutrition, provides an objective basis for planning at local and central levels |
| 4 | Educational Tool | Due to its visual nature, mothers can be educated about their child's care and encouraged to participate actively in growth monitoring |
| 5 | Tool for Action | Guides health workers on the type of intervention needed; helps make referrals easier |
| 6 | Evaluation | Assesses effectiveness of corrective measures and the impact of programmes or special interventions for improving child growth and development |
| 7 | Tool for Teaching | Used for teaching importance of adequate feeding, deleterious effects of diarrhoea, etc. |
Summary Points for Exam
-
Originally designed by David Morley, modified by WHO
-
Also called "road-to-health card"
-
Uses weight-for-age as primary parameter (weight = most sensitive index of growth)
-
Based on WHO MGRS study (1997-2003), 9,440 children from 6 countries
-
India adopted WHO standards in February 2009 under NRHM/ICDS
-
Growth direction > position on chart
-
Growth faltering = earliest sign of PEM
-
Uses: monitoring, diagnosis, planning, education, action, evaluation, teaching
-
Park's Textbook of Preventive and Social Medicine, pp. 636-637
This is a shared conversation. Sign in to Orris to start your own chat.