
Growth & development principles
Reading File
Growth and development is a broad topic spanning pediatrics, physiology, and related disciplines. Let me search the medical library for the most relevant content.
Searching sources...
Finding Sources
Finding Sources
Finding Sources
Finding Sources
Finding Sources
Finding Sources
Finding Sources
Finding Sources
Reading File
Reading File
Reading File
Reading File
Reading File
Reading File
Reading File
Reading File
I now have rich material from Park's Textbook of Preventive and Social Medicine. Let me also pull the developmental milestones and specific growth data sections.
Reading File
Reading File
I now have comprehensive content. Let me compile the complete answer.
Loading Image
Here is a complete, structured overview of Growth & Development Principles drawn from Park's Textbook of Preventive and Social Medicine and Goldman-Cecil Medicine.
Growth & Development - Principles
1. Definitions
Growth refers to the increase in the physical size of the body - measurable in kilograms and centimetres.
Development refers to the increase in skills and functions - intellectual, emotional, and social capacities.
The two are always considered together because the child grows and develops as a whole entity. Normal growth and development require:
- Optimal nutrition
- Freedom from recurrent infections
- Freedom from adverse genetic and environmental influences
(Park's Textbook of Preventive and Social Medicine)
2. Determinants of Growth & Development
| Factor | How it Influences Growth |
|---|---|
| Genetic inheritance | Influences height, weight, mental and social development, personality |
| Nutrition | Growth retardation is a direct indicator of malnutrition; recovery follows dietary improvement |
| Age | Growth rate is maximum during foetal life, first year of life, and puberty |
| Sex | Girls' growth spurt at 10-11 years; boys' spurt slightly later at 12-13 years |
| Physical surroundings | Sunshine, housing quality, ventilation, lighting all affect growth |
| Psychological factors | Love, tender care, and parent-child relationships affect social, emotional, and intellectual development |
| Infections & parasitosis | Maternal infections (rubella, syphilis) affect intrauterine growth; postnatal infections (diarrhoea, measles) slow growth - especially in malnourished children |
| Economic factors | Children from better socioeconomic families show better height and weight |
| Other factors | Birth order, birth spacing, birth weight, parental education, single vs. multiple pregnancies |
3. Growth Curves - Three Patterns
The growth process from birth to age 20 follows three distinct curves (percentages of total growth accomplished by maturity):
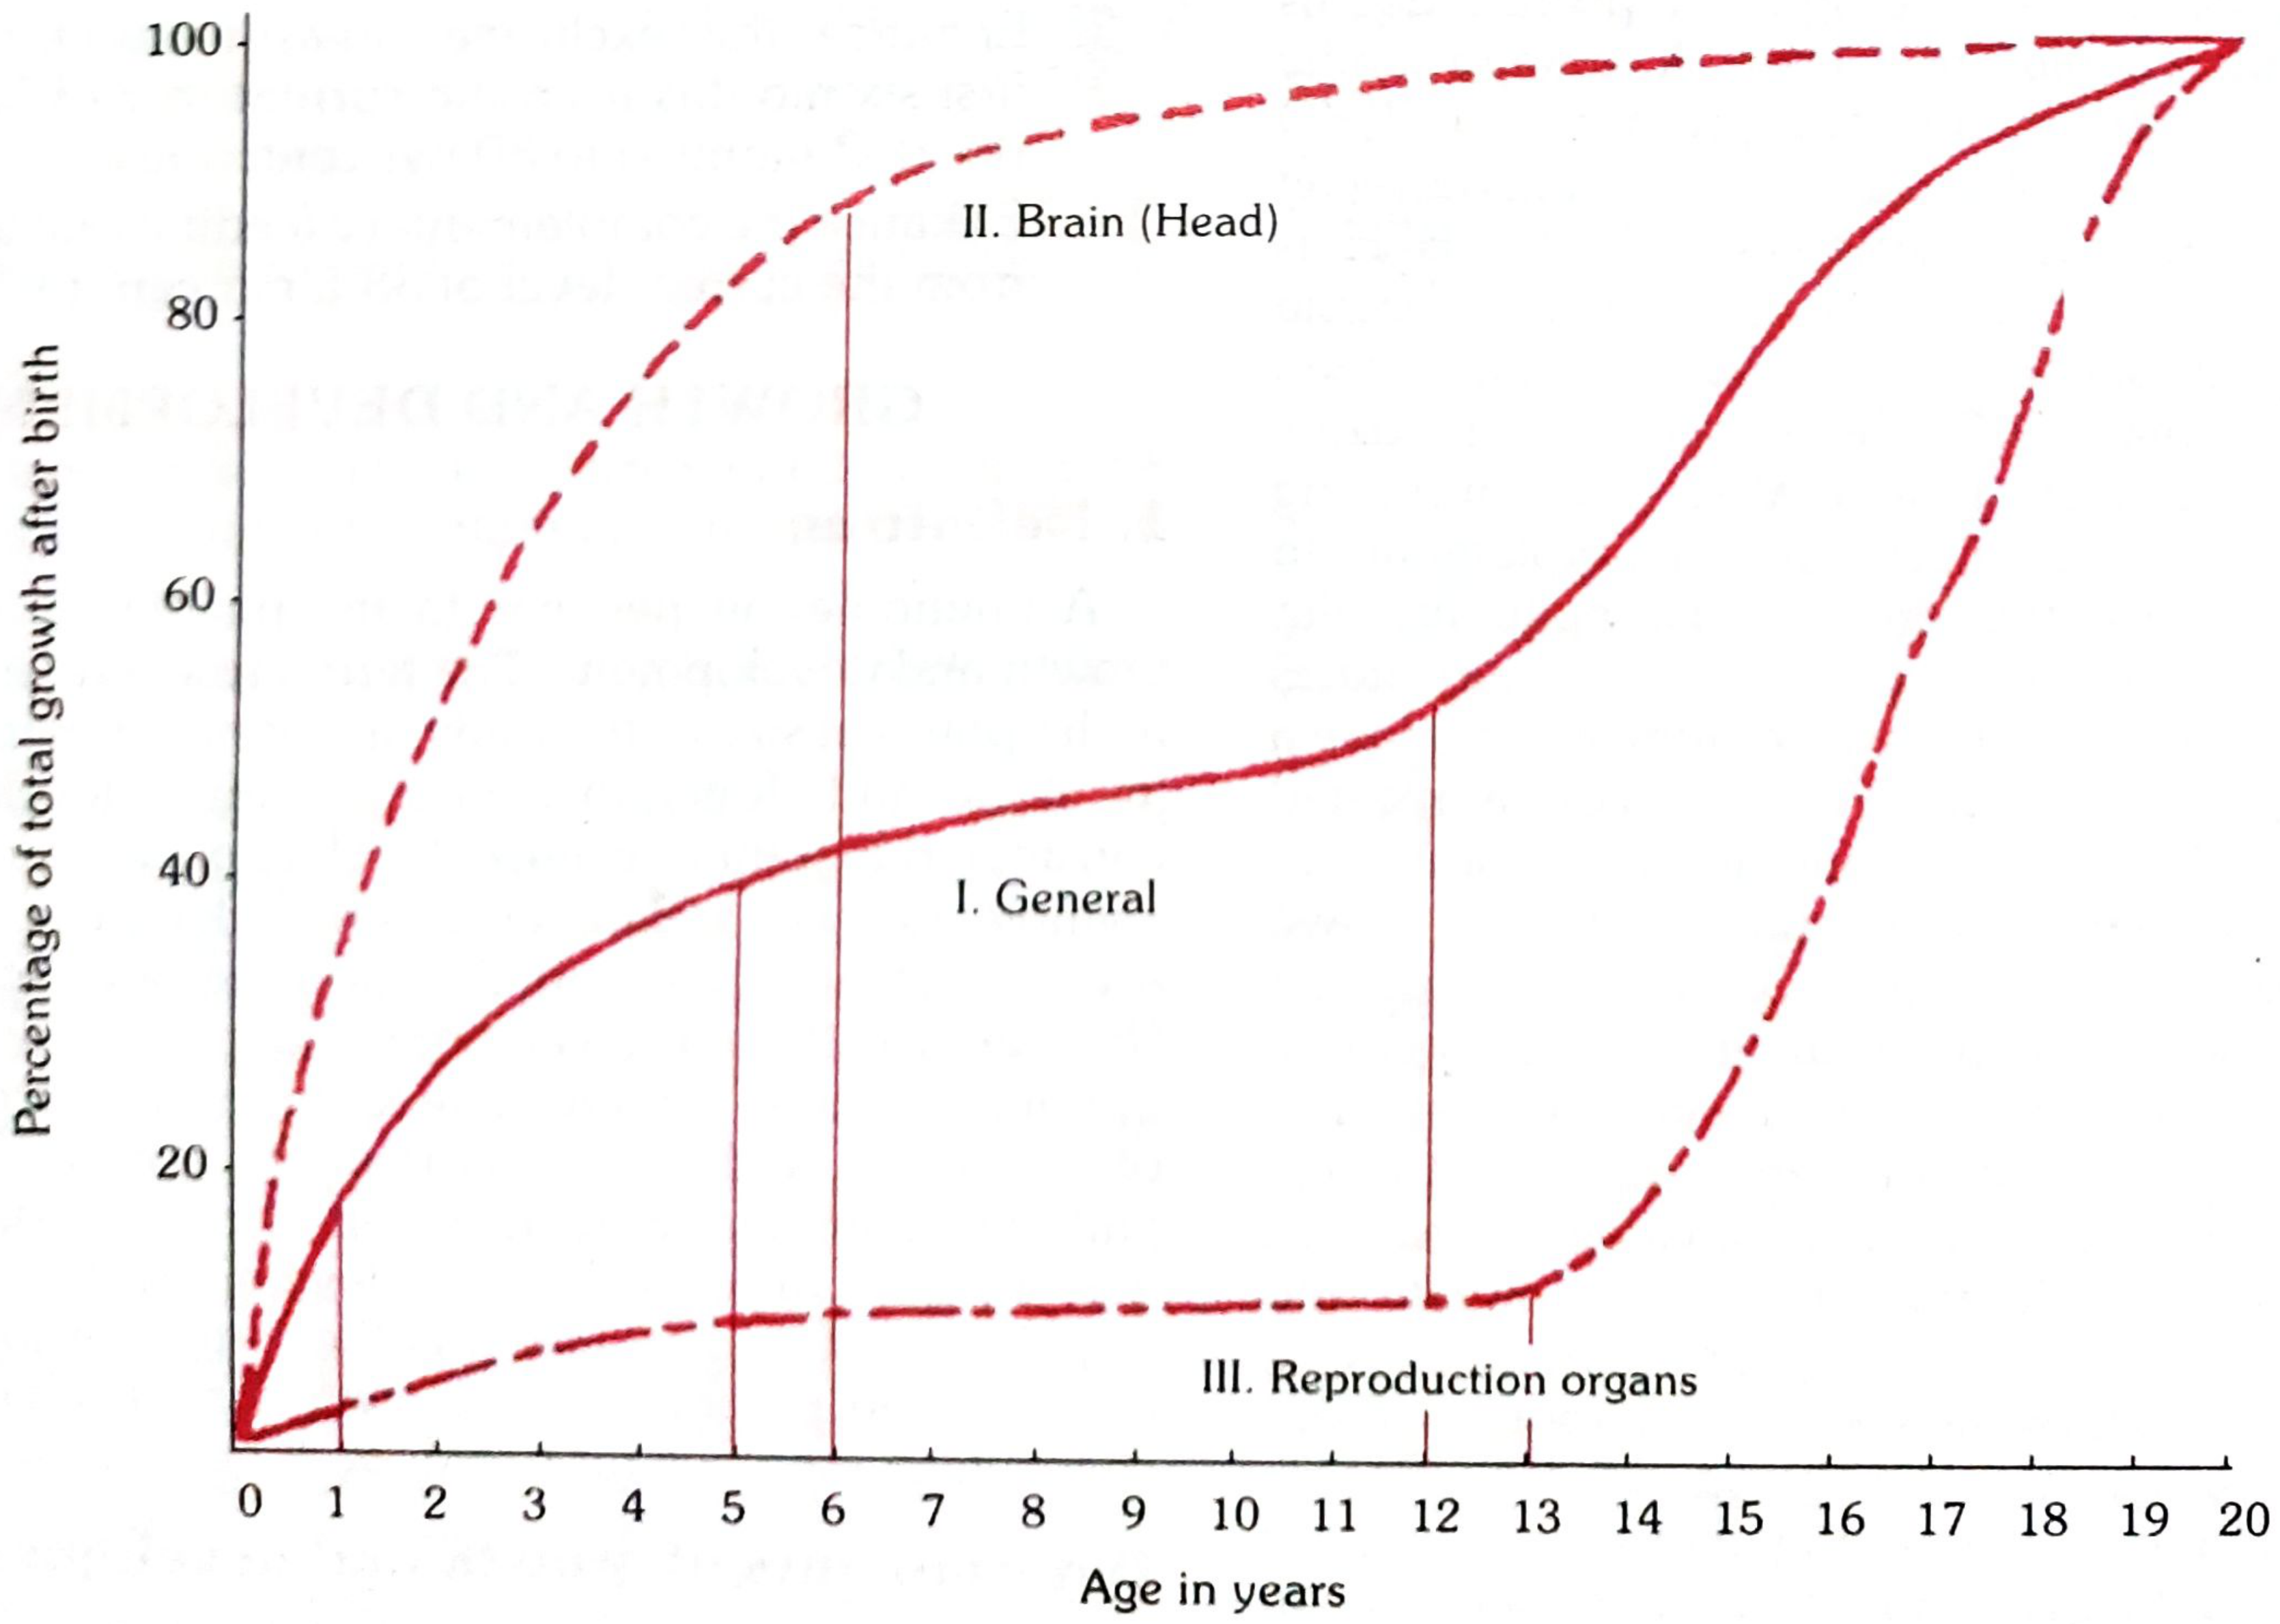
- Curve I - General (body, organs, musculoskeletal): Steady rise, with a major acceleration at puberty
- Curve II - Brain/Head: Spectacular growth in the pre-school years - by age 6, ~90% of adult brain size is reached
- Curve III - Reproductive organs: Minimal growth until puberty, then rapid ascent
The key takeaway: brain growth is front-loaded - the pre-school window is the most critical period for cognitive development.
4. Concept of Normality
A "normal" child is one whose characteristics fall within ±2 standard deviations (SDs) from the mean for age and sex - conventionally between the 3rd and 97th centiles.
- Children outside this range are not automatically abnormal, especially if their growth trajectory runs parallel to the centile lines
- A measurement outside ±3 SD (above 99th or below 1st centile) is more likely to indicate significant abnormality
5. Methods of Assessment
The standard growth parameters in children are:
- Weight - most sensitive single measure
- Height/Length (recumbent length in infants)
- Head circumference
- Chest circumference
Three comparison methods:
- Mean/Median ± 2 SD - a variation of 2 SD from the median is within normal limits
- Percentiles (centiles) - easier to interpret clinically; 3rd-97th centile = "normal" range
- Age-independent indices - weight-for-length, weight-for-height; useful when exact age is uncertain
Assessment can be:
- Longitudinal - same child measured repeatedly at intervals (best for tracking individual progress)
- Cross-sectional - comparing a child to peers of the same age at a single point in time
6. Physical Growth Benchmarks
Weight
| Age | Approximate Weight |
|---|---|
| Birth | ~3.2 kg (boys); ~3.0 kg (girls) |
| 4 months | ~7 kg |
| 12 months | ~10 kg (birth weight triples) |
| 24 months | ~12 kg |
| 60 months | ~18 kg |
- Birth weight doubles by ~5 months, triples by 12 months
Height (WHO Standards - Length/Height for Age, Median)
| Age (months) | Boys (cm) | Girls (cm) |
|---|---|---|
| 0 | 49.9 | 49.1 |
| 12 | 75.7 | 74.0 |
| 24 | 87.8 | 86.4 |
| 36 | 96.1 | 95.1 |
| 48 | 103.3 | 102.7 |
| 60 | 110.0 | ~109 |
(Park's Textbook of Preventive and Social Medicine - WHO 2006 standards)
Head Circumference
- Birth: ~34 cm
- 1 year: ~47 cm
- 2 years: ~49 cm
7. Growth Rate - Key Periods
| Period | Growth Rate |
|---|---|
| Foetal life | Maximum rate overall |
| First year of life | Rapid (birth weight triples) |
| 1-10 years | Slower, steady |
| Puberty (girls: 10-11 yrs; boys: 12-13 yrs) | Second major acceleration (growth spurt) |
8. Pubertal Growth & Development
(Goldman-Cecil Medicine)
Girls:
- First sign: Thelarche (breast budding) - average age 10 years in White girls, ~9 years in African American girls
- Menarche: 2-4 years after thelarche; average age 12.9 years (White American), 12.2 years (African American)
- Only 20% of cycles are ovulatory at menarche; takes ~4 more years for 80% to be ovulatory
- Average weight gain during puberty: 7-25 kg (mean ~17.5 kg)
- Body fat increases from 16% to 27% by end of puberty
- Puberty completion: average 4 years (range 1.5-8 years)
Boys:
- First sign: Testicular enlargement and scrotal thinning at ~10 years
- Adrenarche: ~6 months after testicular enlargement
- Facial hair: ~3 years after pubic hair appears
- Average weight gain: 7-30 kg (mean ~23.7 kg)
- Body fat drops to ~12% by end of puberty
- Puberty completion: average 3 years (range 2-5 years)
Pubertal weight gain accounts for approximately half of ideal adult body weight.
Tanner Stages (Sexual Maturity Ratings, SMR):
- SMR 1: Prepubertal
- SMR 2-4: Progressive puberty
- SMR 5: Full adult sexual characteristics
- By age 16 (girls) and 18 (boys): >90% of adult skeletal mass is accrued
9. Growth Surveillance & the Growth Chart
The Road-to-Health chart (designed by David Morley, later modified by WHO) is the primary tool for longitudinal growth monitoring.
Recommended weighing intervals:
- Birth to 1 year: monthly
- Second year: every 2 months
- 2-5 years: every 3 months
Interpretation principles:
- The direction of growth is more important than the absolute position on the chart
- A flattening or falling weight curve signals growth failure - the earliest sign of protein-energy malnutrition, preceding clinical signs by weeks to months
- Normal zone: between -2 SD and +2 SD
- Severe undernutrition: below -3 SD
India adopted the WHO Child Growth Standards 2006 (based on the Multicentre Growth Reference Study, 1997-2003, conducted across 6 countries including India) in February 2009.
10. Environmental & Social Determinants
Child (biological): Birth weight, gestational age, prior illnesses, nutritional status from prenatal life onward
Family: Parent-child relationship, family size (>4 children associated with higher malnutrition rates), birth spacing, maternal education (especially mothers' literacy)
Socioeconomic: Under-privileged children of the same age are consistently smaller, lighter, and less advanced in psychomotor and intellectual performance
Environmental: Safe water access, sanitation, housing, exposure to infections
11. Developmental Domains
Beyond physical growth, development is assessed across four domains:
| Domain | Examples |
|---|---|
| Physical/Motor | Head control, sitting, standing, walking; fine motor skills |
| Cognitive/Intellectual | Problem solving, language comprehension |
| Language/Communication | Cooing, babbling, first words, sentences |
| Social/Emotional | Smiling, bonding, play, self-regulation |
These are assessed using milestones - age-specific expected achievements. Failure to reach milestones triggers developmental surveillance and further evaluation.
Summary Table: Key Principles
| Principle | Core Idea |
|---|---|
| Growth ≠ Development | Physical size vs. acquisition of skills/functions |
| Rate varies by age | Maximum in foetal life and puberty; slowest in mid-childhood |
| Multi-determinant | Genetics, nutrition, infection, socioeconomic, environment |
| Brain growth is early | Pre-school years are the critical window |
| Normal range | ±2 SD from mean (3rd-97th centile) |
| Surveillance is longitudinal | Direction of growth matters more than absolute values |
| Global standard | WHO 2006 Child Growth Standards are the benchmark |
Sources: Park's Textbook of Preventive and Social Medicine; Goldman-Cecil Medicine, 2-Volume Set
This is a shared conversation. Sign in to Orris to start your own chat.