
LJ media microbiology
Lowenstein Jensen medium LJ culture mycobacterium tuberculosis colonies
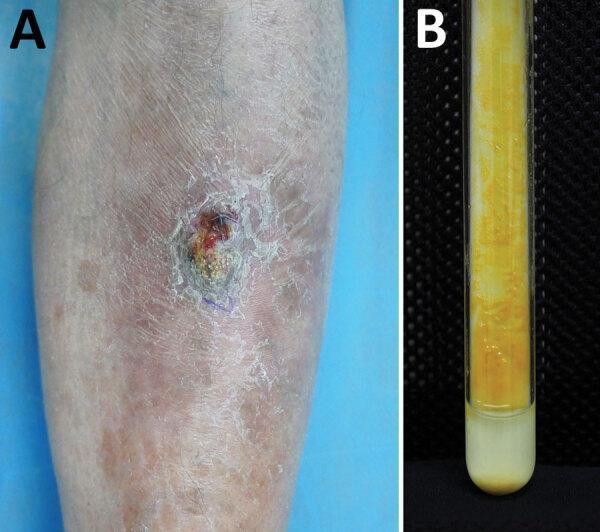
A composite image consisting of a clinical photograph and a laboratory culture diagnostic image illustrating a case of cutaneous mycobacterial infection. Panel A: Clinical photograph of the left shin of a 63-year-old male showing a solitary, well-circumscribed, dull red nodule. The lesion exhibits a verrucous (wart-like) surface texture with peripheral scaling and crusting, suggestive of chronic granulomatous inflammation. The surrounding skin shows mild erythematous and atrophic changes. Panel B: A diagnostic laboratory image showing a Löwenstein-Jensen (LJ) medium slant in a test tube. There is heavy growth of smooth, bright orange-pigmented colonies covering the surface of the slant. The scotochromogenic characteristic of the colonies, which produce pigment even in the absence of light, is a key diagnostic feature of certain non-tuberculous mycobacteria, such as the Mycobacterium gordonae complex. This visual sequence links physical clinical manifestations with microbiological confirmatory evidence.
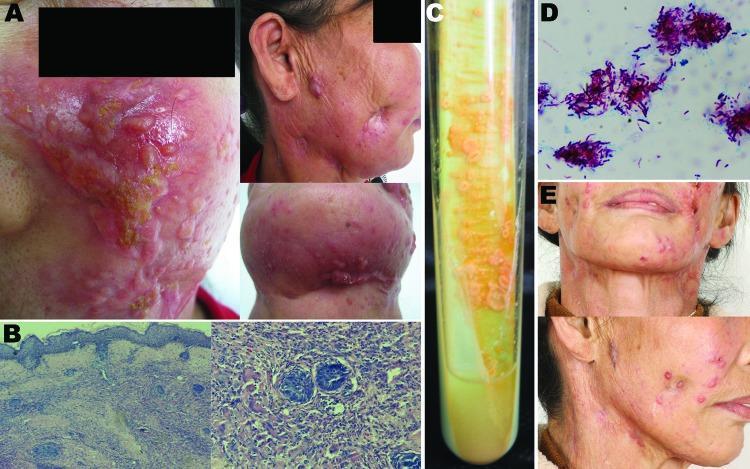
This composite educational image details a case of cutaneous Mycobacterium shigaense infection. Panel A features clinical photographs of a 56-year-old patient's face and neck, presenting with extensive reddish papules, nodules, and indurated plaques, along with concave scarring and crusting indicative of chronic skin involvement. Panel B provides histopathological micrographs showing epidermal hyperplasia and deep dermal granulomatous inflammation containing multinucleated giant cells and epithelioid cell infiltrates. Panel C demonstrates microbiology via a Löwenstein-Jensen medium slant, showing the growth of smooth, creamy, yolk-yellow bacterial colonies. Panel D displays a microscopic Ziehl-Neelsen stain (acid-fast stain) highlighting numerous bright pink/purple acid-fast bacilli clustered together against a blue background. Panel E presents clinical follow-up photographs showing marked resolution of active inflammation and flattening of lesions after four months of antimicrobial therapy, leaving behind atrophic and hyperplastic scars. This visual sequence is intended for the study of infectious dermatology, specifically atypical mycobacterial infections and their diagnostic confirmation through histology and culture.
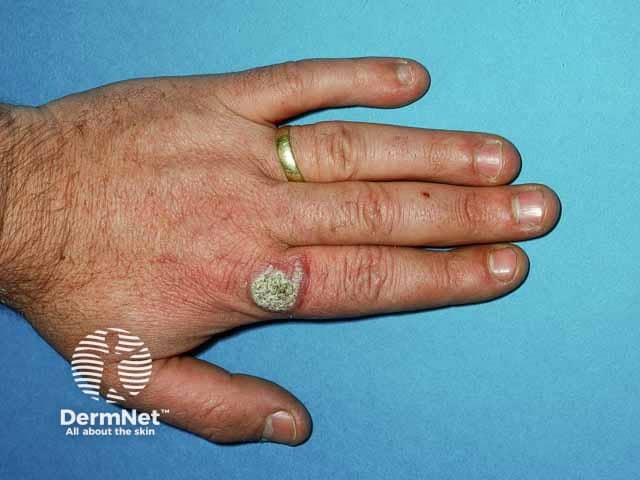
Imaging modality: Clinical photography of a cutaneous lesion on the dorsum of the left hand. This external photograph shows a solitary verrucous plaque with a crusted, scale-covered surface located over the dorsal metacarpal region. The lesion is erythematous to violaceous with mild surrounding edema and subtle desquamation. The surface demonstrates hyperkeratosis with a pale crust and a slightly indurated base; surrounding skin appears non-bullous and without deep ulceration. The overall morphology is characteristic of a chronic granulomatous, tuberculoid-type lesion presenting as a warty, exophytic nodule that may ulcerate or drain. In the clinical context of warty Mycobacterium marinum infection (fish-tank granuloma), aquatic exposure or minor hand trauma in a water-related environment is a critical clinical clue. Lesions typically affect extremities and evolve over weeks to months. Differential diagnoses include cutaneous tuberculosis, other non-tuberculous mycobacterial infections (e.g., M. kansasii), sporotrichosis, nocardiosis, mycetoma, verruca vulgaris, and pyogenic granuloma. Definitive diagnosis requires biopsy with histopathology showing granulomatous inflammation and possible Langhans giant cells, culture on Lowenstein-Jensen/Middlebrook media, and molecular assays (PCR). Therapeutic significance lies in selecting combination antimicrobials (e.g., rifampin with ethambutol or clarithromycin) for prolonged courses. This image supports dermatology education, infectious disease training, and case-based teaching on atypical mycobacterial infections. Education.
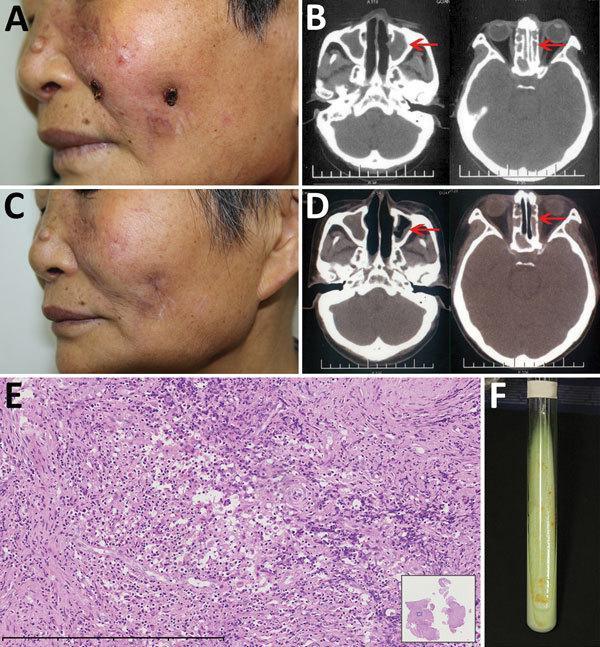
A multi-panel figure illustrating a case of Mycobacterium gordonae infection in an immunocompetent adult. Panel A presents a clinical photograph of the face showing erythematous facial ulcers with central yellow crusting on the cheek. Panel B shows axial CT scans of the paranasal sinuses with arrows indicating opacification and heterogeneous hypersignal in the ethmoid and left maxillary sinuses, consistent with infectious sinusitis. Panels C and D demonstrate clinical and radiological resolution post-treatment, showing atrophic scarring and re-aeration of the previously affected sinuses. Panel E displays a histopathological section (H&E stain) of the nasal mucosa at 20x magnification, revealing dense inflammatory infiltration composed of lymphocytes, histiocytes, and plasma cells. Panel F illustrates a microbiological tissue culture in a Löwenstein–Jensen medium slant, showing characteristic smooth, yolk-yellow pigmented colonies of M. gordonae after 3 weeks of incubation. This educational composite highlights the diagnostic triad of clinical dermatology, radiology, and microbiology in non-tuberculous mycobacterial infections.
Lowenstein-Jensen (LJ) Medium
What It Is
- Medical Microbiology 9e, p. 39
- Jawetz, Melnick & Adelberg's Medical Microbiology 28e, p. ~1050
Composition
| Ingredient | Role |
|---|---|
| Coagulated whole eggs | Solidifies the medium (replaces agar); provides nutrients |
| Glycerol | Carbon and energy source |
| Potato flour | Nutritive component |
| Defined salts | Ionic environment for growth |
| Malachite green | Inhibitory dye - suppresses gram-positive bacteria and other contaminants |
Classification
- Non-selective LJ: standard formulation
- Selective variants: antibiotics added to further reduce contamination
- Gruft: adds penicillin + nalidixic acid
- Mycobactose (Coletsos): adds cycloheximide + lincomycin + nalidixic acid
Primary Use
- Isolation of Mycobacterium tuberculosis from clinical specimens (sputum, BAL, CSF, urine, tissue biopsies)
- Isolation of non-tuberculous mycobacteria (NTM)
- Drug susceptibility testing (DST) - the 1% proportion method uses LJ medium as an economic variant, particularly in resource-limited settings
Colony Appearance on LJ
| Organism | Colonies on LJ |
|---|---|
| M. tuberculosis | Rough, dry, buff/cream-coloured "cauliflower" or "bread-crumb" colonies; appear after 3-6 weeks |
| Photochromogens (e.g. M. kansasii) | Develop yellow/orange pigment only on light exposure |
| Scotochromogens (e.g. M. gordonae) | Develop orange/yellow pigment even in dark |
| Nonchromogens (e.g. MAC) | No pigment |
| Rapid growers | Appear within 7 days |
Incubation
- Temperature: 37°C for most mycobacteria
- Duration: 3-6 weeks for MTB (up to 8 weeks)
- Special exceptions:
- M. haemophilum, M. marinum, M. ulcerans: 30-32°C
- M. xenopi: 42°C
LJ vs. Liquid (Broth) Media
- Broth yields growth faster (1-3 weeks vs. 3-6 weeks)
- Automated, continuously monitoring
Key Identifying Features (Exam Points)
- Egg-based solid medium (solidified by inspissation, NOT agar)
- Contains malachite green as the selective inhibitory dye
- Gold standard culture medium for MTB in resource-limited settings
- Colonies appear in 3-6 weeks (slow due to MTB's long generation time of ~18 hours)
- MTB produces niacin (niacin test positive) on LJ - used for identification
- Pyruvate-enriched LJ is preferred for M. bovis (which grows poorly on glycerol-containing media)
Images: LJ Slants with Mycobacterial Growth
Antibiotic sensitivity testing micro
antibiotic disk diffusion test Kirby Bauer zone of inhibition agar plate
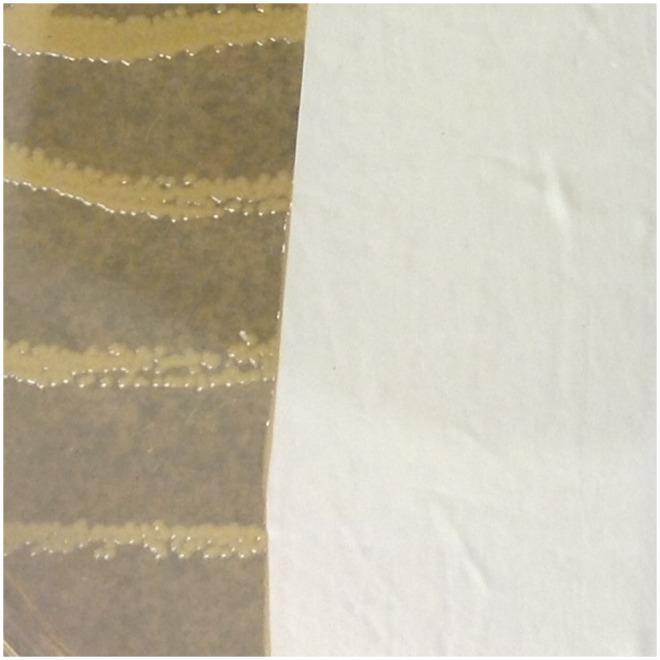
A microbiological assay image illustrating a zone of inhibition test (Kirby-Bauer variant) to evaluate the antimicrobial properties of medical personal protective equipment (PPE). The left side of the image displays an agar plate surface inoculated with Staphylococcus aureus, showing dense, yellowish, opaque bacterial colonies growing in parallel horizontal streaks across a brownish, translucent medium. The right side features a section of a white nitrile medical glove placed directly onto the agar. Notably, there is a lack of a clear zone of inhibition at the interface between the glove material and the bacterial growth; the colonies proliferate up to the very edge of the nitrile material. This visual serves as a clinical demonstration that this specific nitrile glove type provides no inherent antimicrobial inhibition against S. aureus. The image is used in medical education to teach concepts of infection control, material efficacy, and laboratory techniques for testing the antimicrobial properties of clinical supplies.
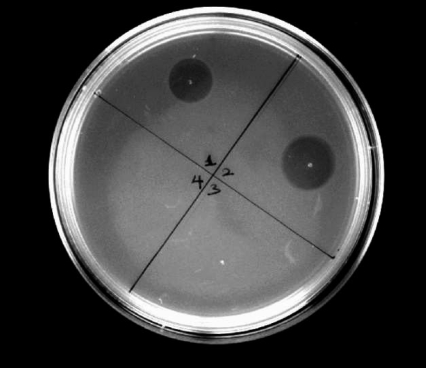
**Imaging Modality:** Microbiological agar plate bioassay (disk diffusion/well diffusion method). **Experimental Setup:** A standard circular Petri dish containing agar medium inoculated with a bacterial indicator strain (*Bacillus subtilis* LH45). The plate is divided into four quadrants (sectors) labeled 1 through 4 using manual markings. **Observed Findings:** - **Sector 1 (Top):** Presence of a well-defined, circular zone of inhibition (clear area), indicating potent antibacterial activity from authentic cinnamycin. - **Sector 2 (Right):** Presence of a circular zone of inhibition comparable in diameter to Sector 1, demonstrating restored bioactivity of synthesized His6-CinA(A–1K) after sequential enzymatic modification and alkaline treatment. - **Sector 3 (Bottom):** Absence of a zone of inhibition; the bacterial lawn remains confluent, indicating a lack of antimicrobial activity in the modified peptide without alkaline-induced maturation. - **Sector 4 (Left):** Control quadrant with no visible inhibition. **Key Diagnostic Features:** The image illustrates a comparative susceptibility test. The primary visual cue is the contrast between the translucent zones of clearance (active lantibiotics) and the opaque bacterial lawn (inactive samples or bacterial growth). This assay confirms the requirement of specific pH-dependent processing for the biological activation of cinnamycin derivatives.
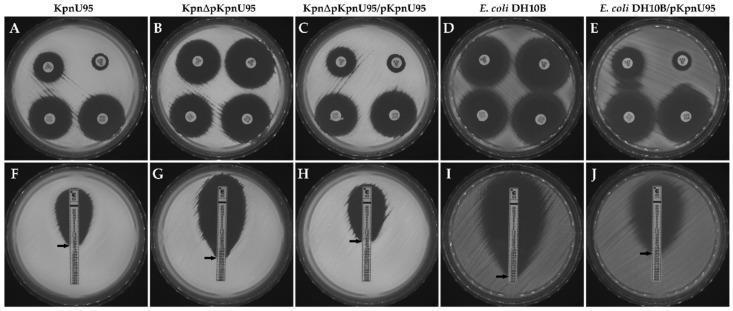
This composite diagnostic image demonstrates antimicrobial susceptibility testing (AST) results for Klebsiella pneumoniae (KpnU95) and Escherichia coli strains, illustrating the role of the pKpnU95 plasmid in conferring resistance. Panels A-E show a disk diffusion Extended-Spectrum Beta-Lactamase (ESBL) confirmation assay. Four antibiotic disks are visible on each agar plate: ceftazidime (CAZ), ceftazidime with clavulanic acid (CLA), cefotaxime (CTX), and cefotaxime with CLA. The clinical KpnU95 strain (A) and the pKpnU95-transformed strains (C, E) exhibit 'ghosting' or distortion of the inhibition zones between cephalosporins and CLA disks, positive for an ESBL phenotype. In contrast, the cured strain (B) and parent E. coli (D) show large, circular zones of inhibition indicating susceptibility. Panels F-J display Etest Minimum Inhibitory Concentration (MIC) strips for ciprofloxacin (CIP). Strains carrying the pKpnU95 plasmid (F, H, J) show a teardrop-shaped zone of inhibition that intersects the strip at higher numeric values, indicating elevated MICs and reduced susceptibility. The plasmid-free strains (G, I) show much lower intersections, signifying high susceptibility to ciprofloxacin.
E-test Etest strip MIC minimum inhibitory concentration ellipse agar
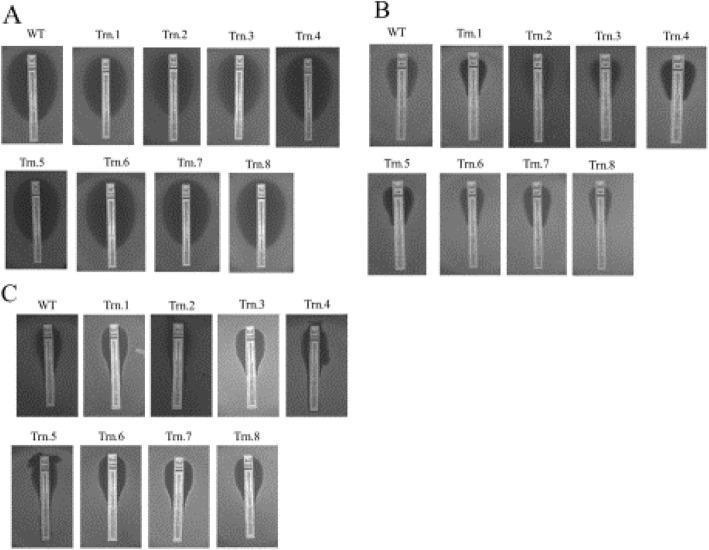
This diagnostic image displays a Minimum Inhibitory Concentration (MIC) strip test (Etest) comparing the antifungal susceptibility of Candida albicans wild-type (WT) and eight truncated chromosome 4 strains (Trn.1–Trn.8). The figure is divided into three sections: (A) Fluconazole (range 0.016–256 μg/ml), (B) Amphotericin B (range 0.002–32 μg/ml), and (C) Caspofungin (range 0.002–32 μg/ml). Each panel shows a vertical MIC strip containing a concentration gradient of the drug placed on an agar plate inoculated with the fungal strain. The elliptical zone of inhibition (clear area) surrounding the strip represents growth inhibition. The point where the ellipse intersects the strip indicates the MIC value. In all three sections, the elliptical inhibition patterns for the truncated strains are visually consistent with the wild-type strain, indicating that the chromosomal truncations did not significantly alter the susceptibility or resistance profile to these three classes of antifungal agents (azoles, polyenes, and echinocandins). This visual data supports the conclusion that the deleted portions of chromosome 4 do not harbor primary determinants for drug resistance in these test conditions.
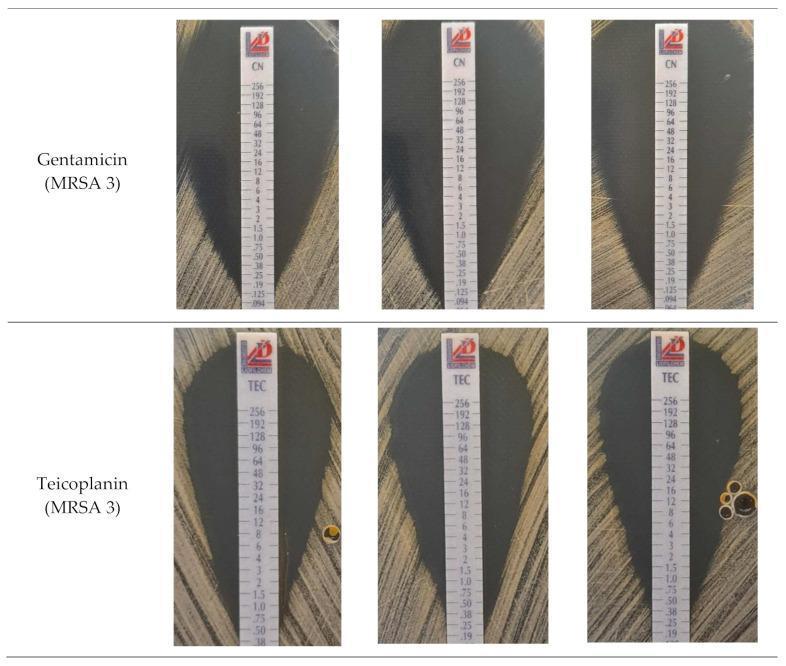
This diagnostic image displays a series of E-test (gradient diffusion) strips on agar plates, used for determining the Minimum Inhibitory Concentration (MIC) of antibiotics against Methicillin-resistant Staphylococcus aureus (MRSA) strain 3. The top row illustrates tests for Gentamicin (CN), while the bottom row shows tests for Teicoplanin (TEC). Each strip contains a pre-defined exponential gradient of antibiotic concentrations ranging from 0.016 to 256 µg/mL. Clear, dark teardrop-shaped zones of growth inhibition are visible against the opaque bacterial lawn. For Gentamicin, the elliptical inhibition zones are symmetrical and consistent. For Teicoplanin, the zones are broader, and some plates show small satellite colonies or irregularities within the elliptical clearing. The MIC value is determined clinically by identifying the numerical point on the strip where the edge of the bacterial growth ellipse intersects the plastic carrier. This laboratory specimen demonstrates antimicrobial susceptibility testing (AST) methodology in microbiology.
Antibiotic Sensitivity Testing (AST) in Microbiology
Overview
- Jawetz, Melnick & Adelberg's Medical Microbiology 28e
- Henry's Clinical Diagnosis and Management by Laboratory Methods
Key Terminology
| Term | Definition |
|---|---|
| MIC (Minimum Inhibitory Concentration) | Lowest concentration of antibiotic that visibly inhibits bacterial growth. This is the "gold standard" quantitative measure |
| MBC (Minimum Bactericidal Concentration) | Lowest concentration that kills ≥99.9% of the original inoculum |
| Breakpoint | MIC (or zone diameter) cutoff that classifies an isolate as Susceptible (S), Intermediate (I), or Resistant (R) |
| ECV/ECOFF (Epidemiologic Cutoff Value) | Maximum MIC expected in a wild-type (no acquired resistance) population; used for surveillance |
| Bacteriostatic | Drug inhibits growth but does not kill; requires host immune system to clear infection |
| Bactericidal | Drug kills bacteria directly |
Standard Testing Medium
- Has good batch-to-batch reproducibility
- Has low levels of sulfonamide, trimethoprim, and tetracycline inhibitors
- Supports growth of most non-fastidious bacteria
Methods of AST
1. Dilution Methods
A. Broth Dilution (Microdilution)
- Serial twofold dilutions of antibiotic in broth in a 96-well microdilution plate
- Inoculated with standardized bacterial suspension (~5 × 10⁵ CFU/mL)
- After incubation (16-24 h at 35°C), lowest concentration with no visible turbidity = MIC
- Automated systems: Vitek 2 (bioMérieux), MicroScan, Phoenix - read spectrophotometrically/fluorometrically
- Advantage: Quantitative MIC result; automated; rapid (some systems in 8-18 hours)
- Disadvantage: Expensive; fixed panel of antibiotics
B. Agar Dilution
- Antibiotic incorporated into Mueller-Hinton agar plates at different concentrations
- Bacteria spotted/inoculated on the surface
- Time consuming; limited to special circumstances (e.g., anaerobes)
2. Disk Diffusion (Kirby-Bauer Method)
- Prepare bacterial suspension matching 0.5 McFarland turbidity standard (~1.5 × 10⁸ CFU/mL)
- Swab entire surface of Mueller-Hinton agar plate (150 mm) evenly
- Place antibiotic-impregnated disks (up to 12 per 150 mm plate)
- Incubate 16-24 h at 35°C
- Measure diameter of zone of inhibition in mm (to nearest mm)
- Compare to CLSI zone diameter breakpoints → report S / I / R
3. Gradient Diffusion (E-test / MIC Test Strip)
- Two commercial formats: E-test (bioMérieux) and MIC Test Strip/MTS (Liofilchem)
- Correlates well with broth microdilution MIC
- Advantage: Provides true quantitative MIC; useful for single antibiotics, fastidious organisms, newly introduced drugs, or drugs not on a laboratory's panel
- Limitation: More expensive than disk diffusion for routine testing
Interpretation: Breakpoints
- MIC distribution of target organism (wild-type vs. resistant populations)
- PK/PD properties of the antimicrobial (how drug concentrations behave in the body)
- Clinical outcomes data
| Category | Meaning | Clinical implication |
|---|---|---|
| S - Susceptible | MIC ≤ susceptible breakpoint | Standard dosing likely effective |
| I - Intermediate (or "Susceptible, increased exposure") | MIC in intermediate range | Higher dose or concentrated site needed |
| R - Resistant | MIC ≥ resistant breakpoint | Drug unlikely to be effective |
Factors Affecting AST Results
| Factor | Effect |
|---|---|
| Medium composition | Excess Ca²⁺/Mg²⁺ → Pseudomonas appears falsely resistant to aminoglycosides; NaCl enhances detection of MRSA |
| Inoculum size | Larger inoculum → lower apparent susceptibility; resistant mutants more likely to emerge |
| pH | Affects activity of aminoglycosides, tetracyclines, erythromycin |
| Incubation length | Longer = resistant mutants may emerge; drug may deteriorate |
| Metabolic activity | Actively growing organisms are more susceptible |
| Drug stability | Penicillins degrade slowly; aminoglycosides and ciprofloxacin are more stable |
Special/Additional Methods
Direct β-Lactamase Tests
- Detect β-lactamase enzyme production (not inhibitory tests)
- Methods: acidometric, iodometric, chromogenic (nitrocefin - most common)
- Nitrocefin turns red in presence of β-lactamase
- Useful for Staphylococcus, H. influenzae, N. gonorrhoeae, Enterococcus
Automated Systems
- Vitek 2, MicroScan WalkAway, BD Phoenix use spectrophotometry/fluorometry to read microbroth dilution panels
- Include "expert systems" with programmed rules for known intrinsic resistances, unusual resistance profiles, and interpretive rules
- Allow computerized antibiogram data collection
Serum Bactericidal Titer (SBT)
- Patient's own serum tested against their isolated pathogen
- Used in special circumstances (e.g., endocarditis, osteomyelitis)
Quality Control
- Reference strains (e.g., S. aureus ATCC 25923, E. coli ATCC 25922, P. aeruginosa ATCC 27853) are tested alongside clinical isolates every time testing is performed
- Zone diameters and MICs for control strains must fall within published acceptable ranges
CLSI Key Documents
| Document | Content |
|---|---|
| M100 | Performance Standards for AST (updated annually - breakpoint tables) |
| M02 | Disk diffusion method |
| M07 | Broth microdilution method |
| M24 | Mycobacteria and aerobic actinomyces |
| M45 | Fastidious and facultatively anaerobic bacteria |
| M27 | Yeast antifungal testing |
| M38 | Filamentous fungi |
Short
Antibiotic Sensitivity Testing (AST) - Quick Summary
Purpose
Methods
1. Disk Diffusion (Kirby-Bauer)
- Antibiotic-impregnated paper disks placed on agar inoculated with bacteria
- Measure zone of inhibition (mm) after 16-24 h
- Larger zone = more susceptible (inversely correlates with MIC)
- Result: qualitative (S/I/R only)
2. Broth Microdilution
- Serial twofold dilutions of antibiotic in 96-well plate
- Lowest concentration with no visible turbidity = MIC
- Result: quantitative (exact MIC in μg/mL)
- Automated: Vitek 2, MicroScan, Phoenix
3. E-test (Gradient Diffusion)
- Plastic strip with antibiotic gradient placed on agar
- Forms elliptical zone; MIC read where ellipse intersects strip scale
- Combines disk + dilution; gives quantitative MIC
Key Terms
| Term | Meaning |
|---|---|
| MIC | Lowest concentration inhibiting visible growth |
| MBC | Lowest concentration killing ≥99.9% bacteria |
| Breakpoint | MIC cutoff defining S / I / R |