
Explain to me the concept of likelihood ratio in screening
The likelihood ratio (LR) tells you how much a test result changes the probability of disease. A positive LR >10 or negative LR <0.1 is generally considered strong; values near 1.0 change nothing. They are calculated from sensitivity and specificity and are applied via Bayes' theorem (pre-test odds × LR = post-test odds).
Searching sources...
Reading File
Finding Sources
Finding Sources
Good sources found. Let me read the most relevant sections from Harrison's and the Echocardiography textbook.
Reading File
Reading File
Reading File
Let me fetch the nomogram image and the LR table for a visual aid, and also get more of Harrison's explanation.
Reading File
Reading File
Loading Image
Excellent - I now have everything needed for a thorough answer. Let me also fetch the threshold model image and get the LR table data.
Reading File
I now have all the content needed for a thorough, well-sourced explanation. Here is the full answer:
Likelihood Ratio in Screening and Diagnostic Testing
What Is a Likelihood Ratio?
A likelihood ratio (LR) is the probability that a given test result would occur in a patient with the disease, divided by the probability that the same result would occur in a patient without the disease. It tells you how much a test result should shift your suspicion of disease - either up (positive result) or down (negative result).
As Harrison's Principles of Internal Medicine 22E puts it, the LR "provides a measure of how well the test distinguishes those with from those without disease."
Why Use LR Instead of Sensitivity/Specificity Alone?
Sensitivity and specificity describe a test's accuracy, but they do not directly tell you how much a result will shift your clinical probability. That shift depends on the interaction between sensitivity, specificity, and the pretest probability - the LR captures all of this in a single number.
- Predictive values (PPV, NPV) also depend on disease prevalence, making them population-specific and non-transferable.
- LRs are independent of prevalence and can be applied to any individual patient given their specific pretest probability.
Two Types of Likelihood Ratio
1. Positive Likelihood Ratio (LR+)
"How much more likely is a positive result in someone WITH the disease vs. someone WITHOUT it?"
$$LR+ = \frac{\text{Sensitivity}}{1 - \text{Specificity}} = \frac{\text{True Positive Rate}}{\text{False Positive Rate}}$$
- A test with 90% sensitivity and 90% specificity gives LR+ = 0.90 / (1 - 0.90) = 9. A positive result is 9 times more likely in a diseased patient than a healthy one.
- Most tests in medicine have LR+ between 1.5 and 20.
2. Negative Likelihood Ratio (LR-)
"How much more likely is a negative result in someone WITH the disease (i.e., a false-negative) vs. someone WITHOUT it (a true-negative)?"
$$LR- = \frac{1 - \text{Sensitivity}}{\text{Specificity}} = \frac{\text{False Negative Rate}}{\text{True Negative Rate}}$$
- For the same 90%/90% test: LR- = (1 - 0.90) / 0.90 = 0.11. A negative result is only about 1/10th as likely in a diseased patient as in a healthy one.
Interpreting LR Values
| LR+ | Meaning |
|---|---|
| >10 | Large shift upward - excellent for ruling IN disease |
| 5-10 | Moderate shift upward - good test |
| 2-5 | Small shift - modest value |
| 1-2 | Minimal or no shift - poor test |
| = 1 | Useless - does not change probability at all |
| LR- | Meaning |
|---|---|
| <0.1 | Large shift downward - excellent for ruling OUT disease |
| 0.1-0.2 | Good test for ruling out |
| 0.2-0.5 | Moderate shift downward |
| >0.5 | Minimal shift - poor for ruling out |
The Textbook of Clinical Echocardiography gives a useful example: LV thrombus on echo with 95% sensitivity and 88% specificity yields LR+ = 7.9 (good) and LR- = 0.06 (excellent). The negative LR is excellent because a high-quality scan will almost never miss an apical thrombus.
The SnNout mnemonic: a high-Sensitivity test with a negative result rules out disease (low LR-).
The SpPin mnemonic: a high-Specificity test with a positive result rules in disease (high LR+).
Applying LR: Converting Pre-test to Post-test Probability
This is done via Bayes' theorem, most practically using the odds form:
$$\text{Post-test odds} = \text{Pre-test odds} \times LR$$
Then convert back: Probability = Odds / (1 + Odds).
Step-by-step example (from Harrison's):
- 41-year-old man, atypical chest pain, pretest probability of CAD = 10% (pre-test odds = 0.10/0.90 = 0.111)
- Exercise treadmill test is positive: LR+ = 2.4
- Post-test odds = 0.111 × 2.4 = 0.267
- Post-test probability = 0.267 / 1.267 = ~21% (modest change - the test didn't help much)
For a 60-year-old man with typical angina, pretest probability = 80%:
- Pre-test odds = 0.80/0.20 = 4.0
- Post-test odds = 4.0 × 2.4 = 9.6
- Post-test probability = 9.6 / 10.6 = ~91% (again, didn't change much because the pre-test probability was already high)
This illustrates a key principle: tests are most informative when pretest probability is intermediate (roughly 20-80%). At the extremes, even a good test barely moves the needle.
The LR Nomogram
Rather than doing the arithmetic each time, you can use the Fagan nomogram - a three-column graphical tool with pre-test probability on the left, LR in the middle, and post-test probability on the right. Place a ruler from the pre-test probability through the LR and read off the post-test probability directly.
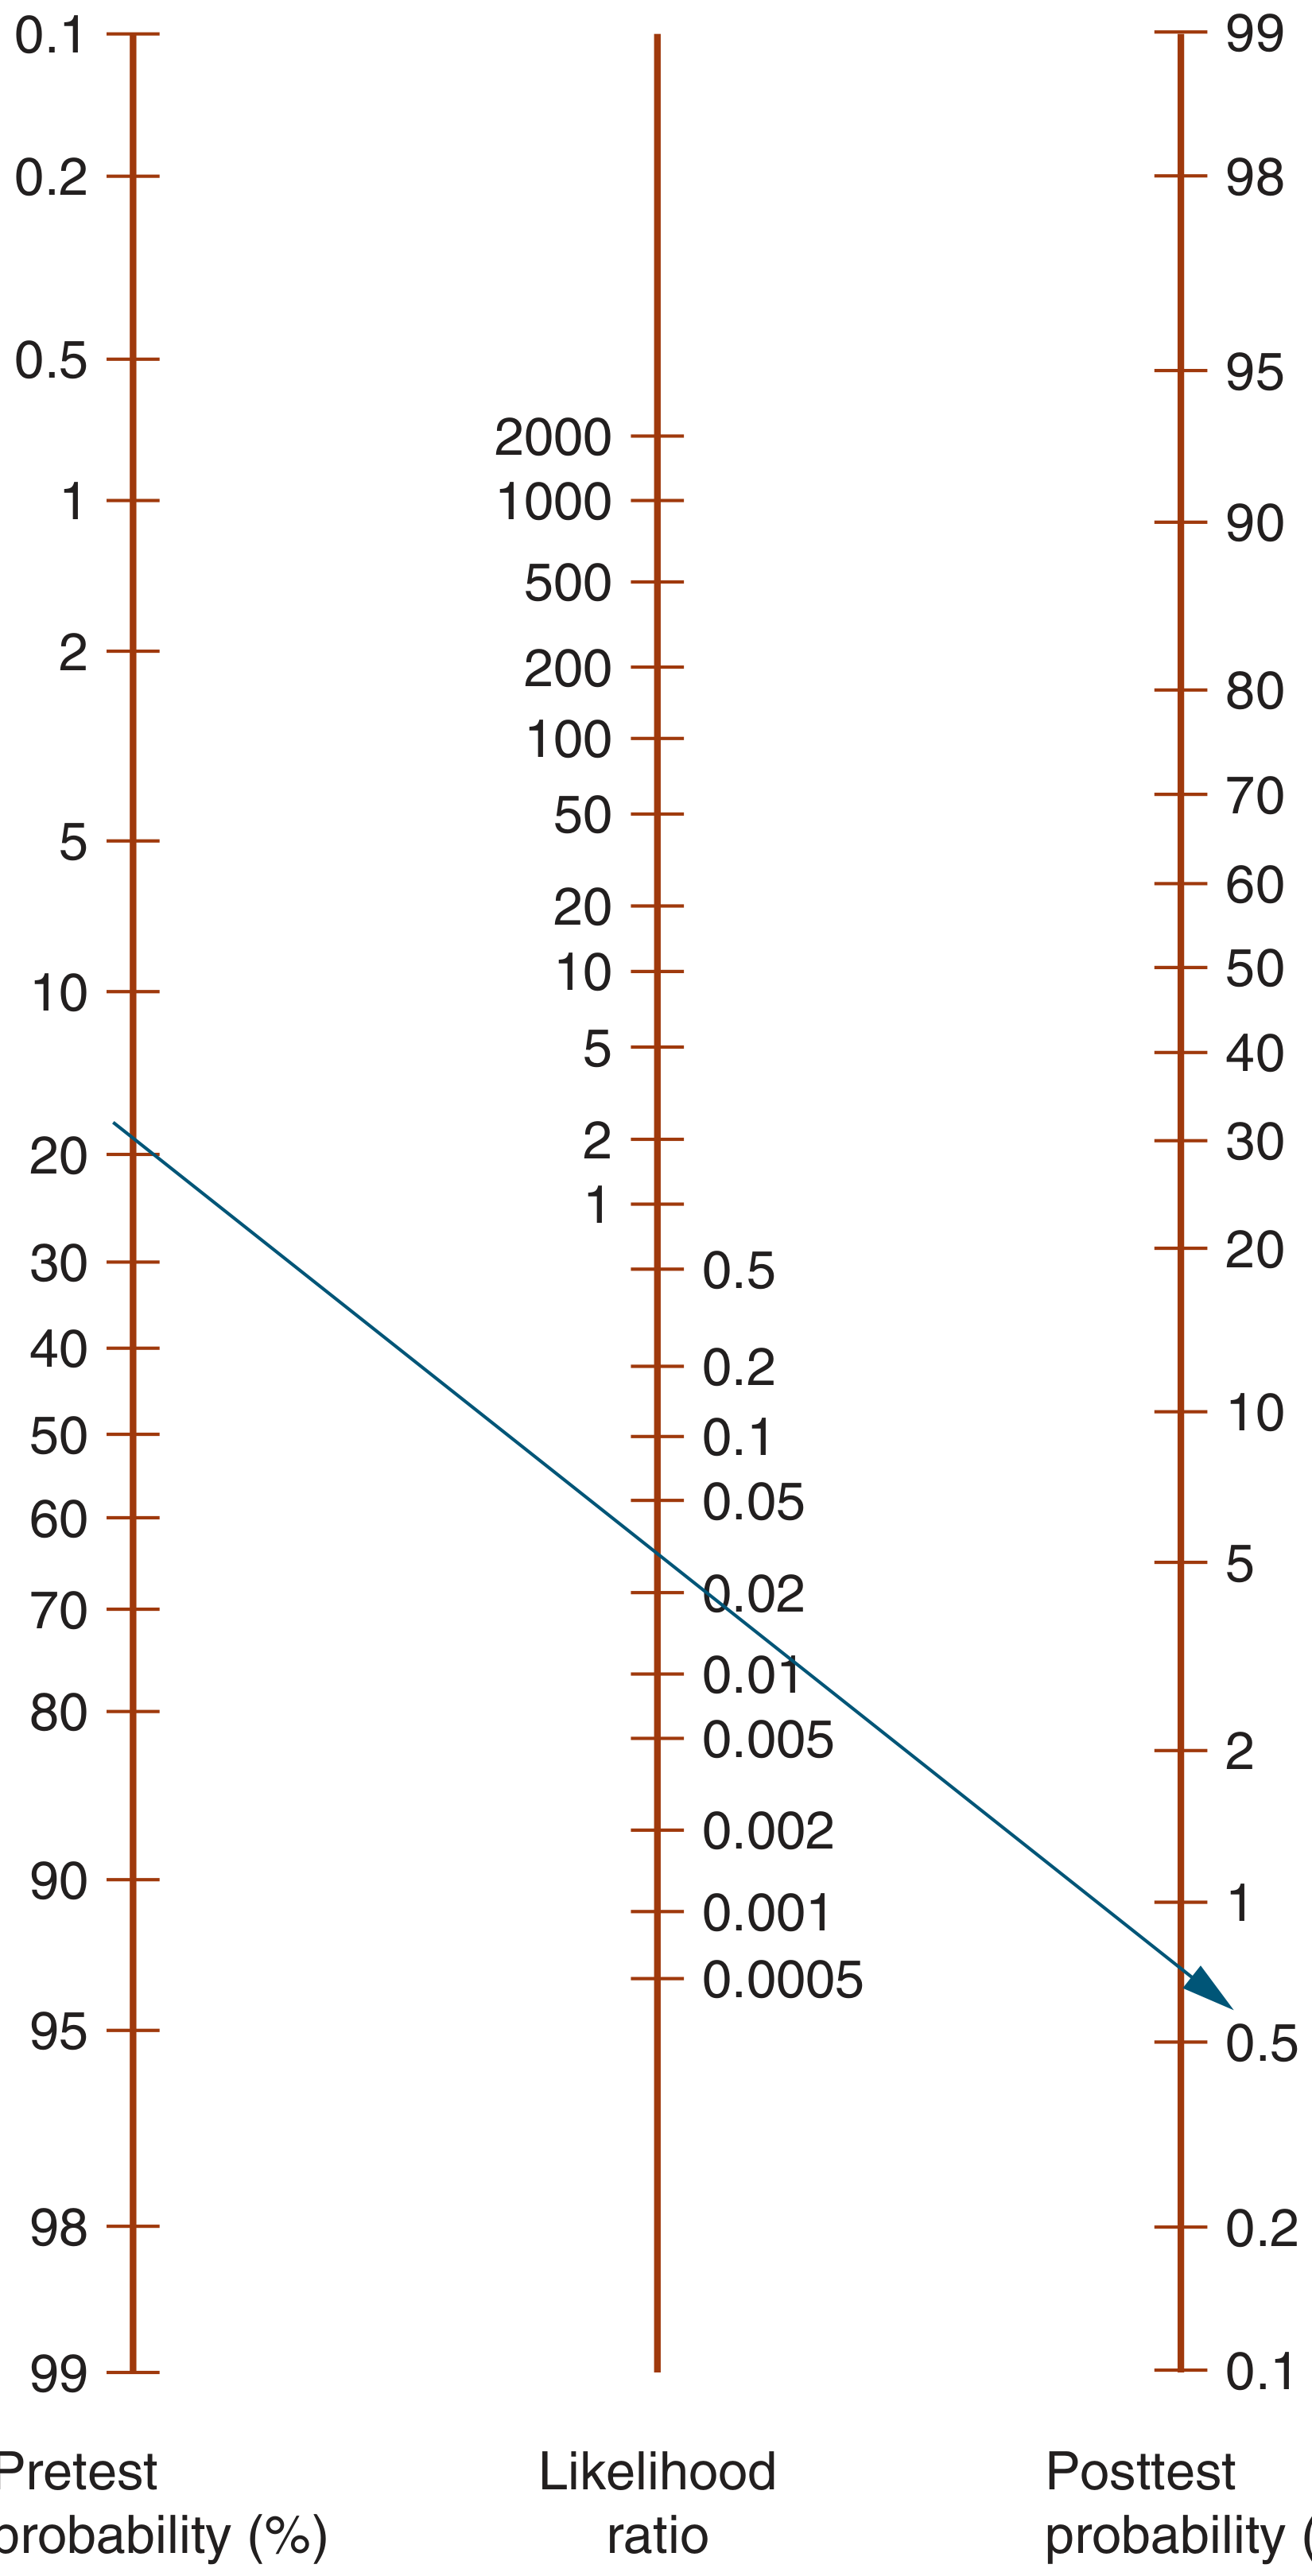
Fagan nomogram - connect pretest probability to the likelihood ratio with a straightedge to read off posttest probability.
LR Table: How Much Does It Shift Probability?
From Symptom to Diagnosis, 4th Ed (Table 1-5):
| LR | Pre-test 5% | Pre-test 10% | Pre-test 20% | Pre-test 50% | Pre-test 70% |
|---|---|---|---|---|---|
| 10 | 34% | 53% | 71% | 91% | 96% |
| 3 | 14% | 25% | 43% | 75% | 88% |
| 1 | 5% | 10% | 20% | 50% | 70% |
| 0.3 | 1.5% | 3.2% | 7% | 23% | 41% |
| 0.1 | 0.5% | 1% | 2.5% | 9% | 19% |
Note how an LR of 1 changes nothing - the posttest probability equals the pretest. And an LR+ of 10 applied to a 50% pretest probability shoots you up to 91%.
Important Cautions
From Symptom to Diagnosis, 4th Ed:
- If pretest probability is HIGH, a negative test rarely rules out disease no matter how small the LR- is. You need another test.
- If pretest probability is LOW, a positive test rarely rules in disease no matter how large the LR+ is. This is why mass screening in low-prevalence populations generates many false positives - even an excellent test (high LR+) applied to a 1% prevalence population still gives a low post-test probability.
- LR = 1 is completely useless.
Summary
| Concept | Formula | Clinical Meaning |
|---|---|---|
| LR+ | Sensitivity / (1 - Specificity) | How much a positive result raises disease probability |
| LR- | (1 - Sensitivity) / Specificity | How much a negative result lowers disease probability |
| Post-test odds | Pre-test odds × LR | Bayes' theorem in odds form |
| LR+ >10 | Rules IN (SpPin) | High specificity drives this |
| LR- <0.1 | Rules OUT (SnNout) | High sensitivity drives this |
| LR = 1 | Useless test | No shift in probability |
Sources: Harrison's Principles of Internal Medicine 22E, pp. 67-68 | Textbook of Clinical Echocardiography, p. 147 | Symptom to Diagnosis, 4th Ed, pp. 20-21
This is a shared conversation. Sign in to Orris to start your own chat.